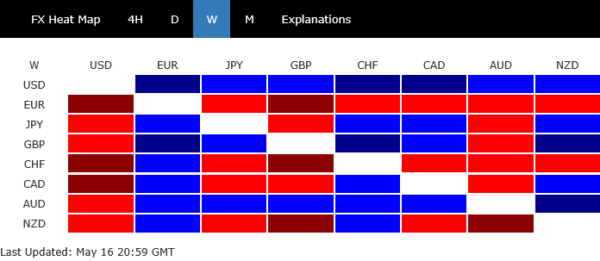
Risk sentiment improved last week, driven by the solid US non-farm payroll report that helped ease fears of a deepening slowdown. Adding to the optimism was a thaw in US-China relations. While no concrete breakthrough emerged, the fact that both sides were willing to engage again offered some relief to global markets weary of tariff escalations.
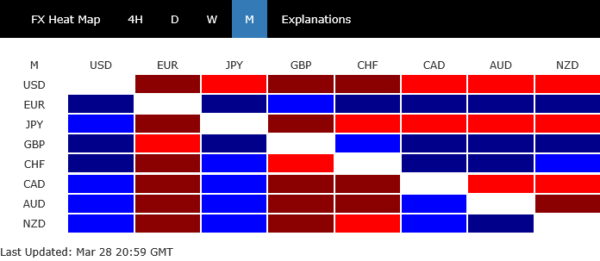
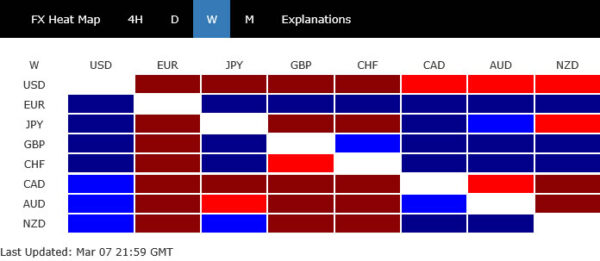
Dollar capitalized on this shift late in the week, rebounding after a string of weak data had previously weighed on sentiment. Although the greenback still finished as the second worst performer for the week, the technical picture points to scope for a near-term bounce.
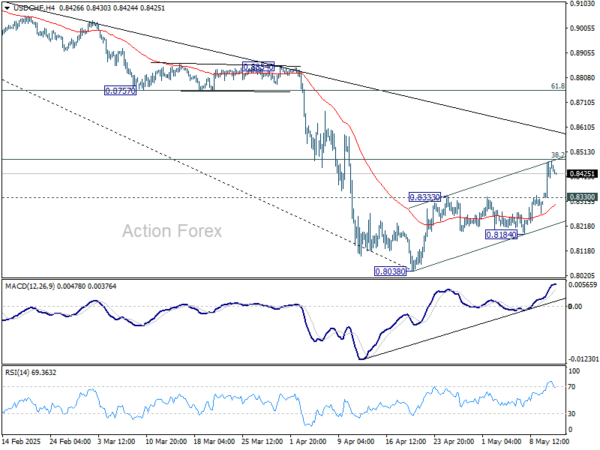
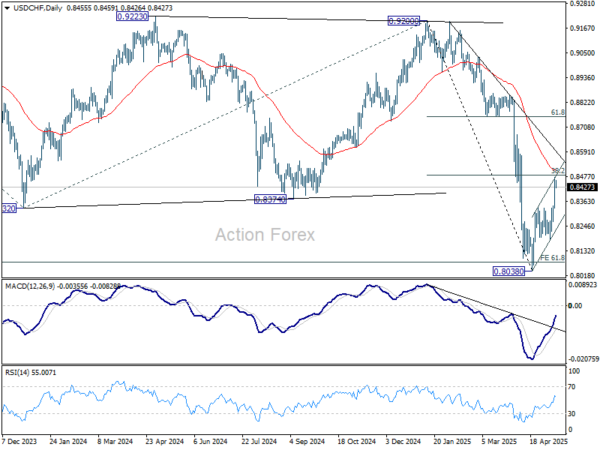
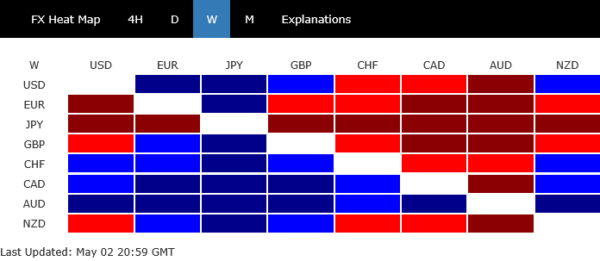
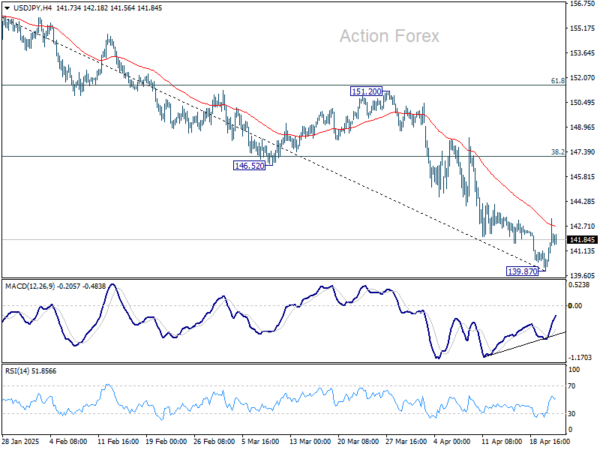
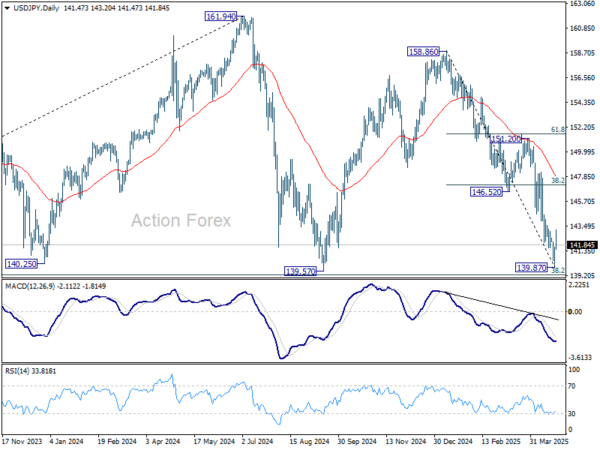
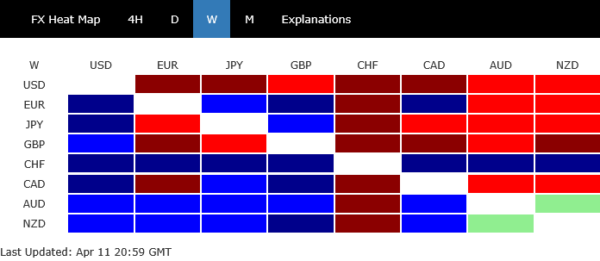
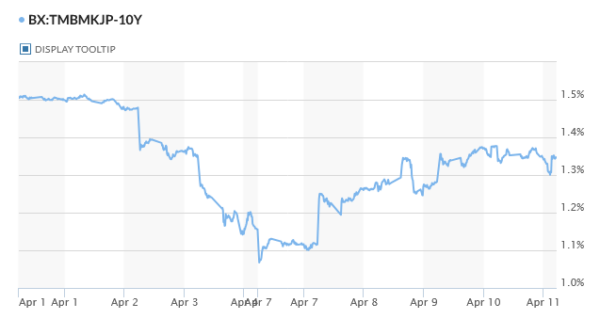
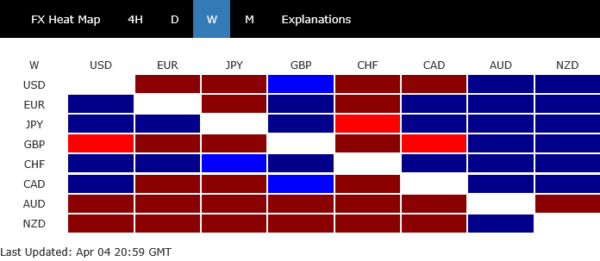
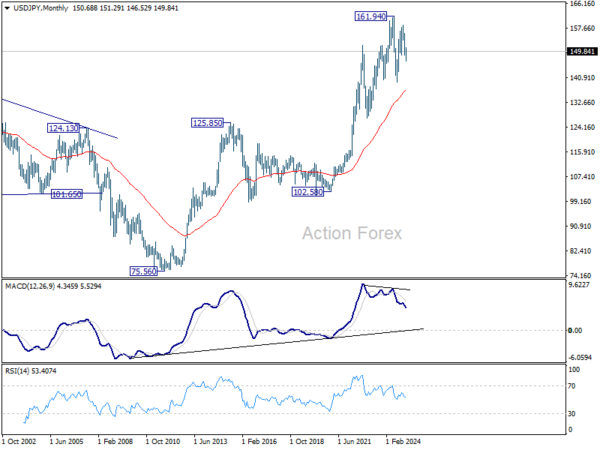
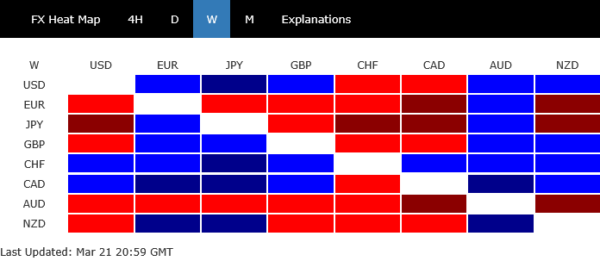
By contrast, Yen was the worst performer, pressured by improving risk appetite and technical breakouts in crosses, with further weakness likely if sentiment remains supported. Swiss Franc also underperformed, dragged down not just by reduced demand for safe-haven assets but also by a negative inflation print, which solidified expectations of another SNB rate cut this month.
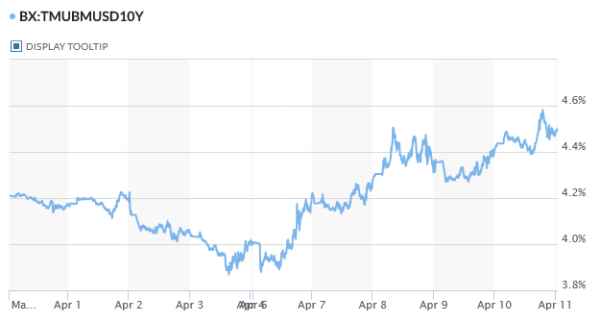
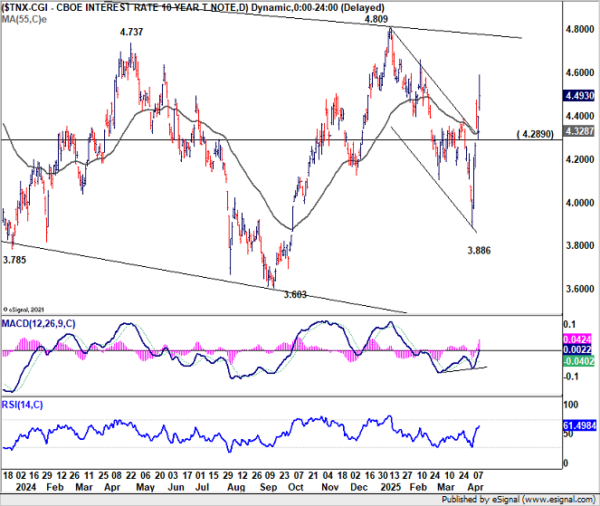
In the middle of the pack were Euro and Loonie. Both ECB and BoC delivered rate decisions in line with expectations. ECB cut by 25bps and BoC held steady. Yet, their respective advances against Dollar faded as improving trade prospects and rebounding US yields provided a floor for the greenback.
NFP Rescues Sentiment, Fed Cut Bets Recede Further
After a week dominated by downbeat US data—particularly the contractionary ISM manufacturing and services, sentiment got a needed boost from May’s non-farm payrolls. While hiring did slow, the headline print of 139k jobs, paired with a steady unemployment rate and stronger-than-expected wage growth, helped restore some confidence in the durability of the US labor market.
For now, the economy appears to be holding up reasonably well against the growing cloud of tariff uncertainty. Rather than crumbling under pressure, the labor market continues to show resilience, suggesting the real economic drag from trade tensions may not fully materialize until later in the year—if at all.
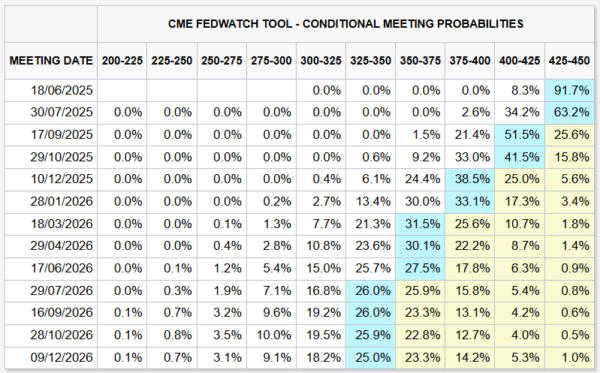
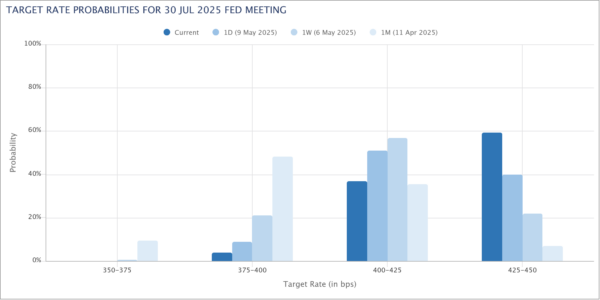
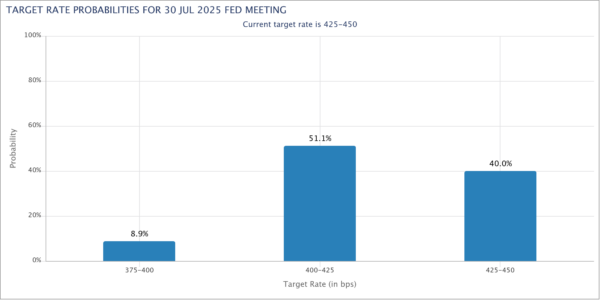
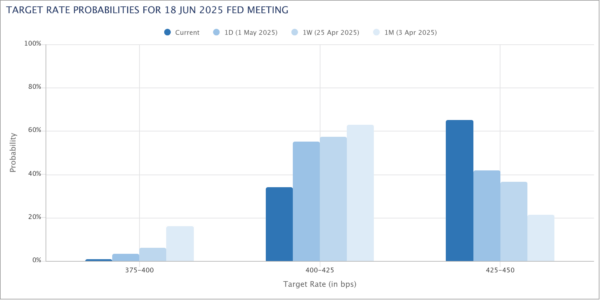
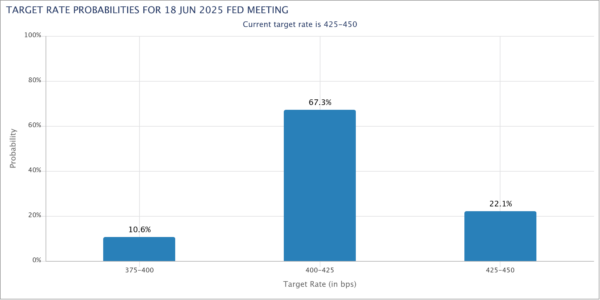
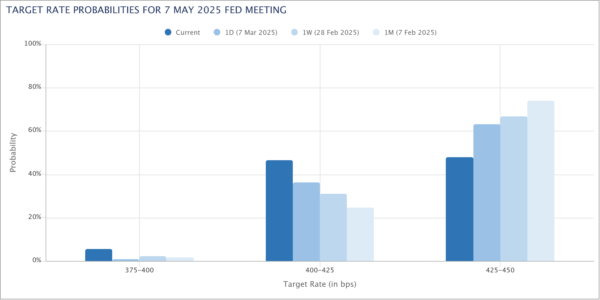
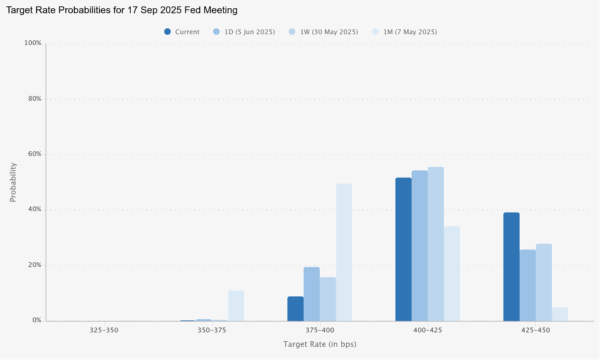
In response, market pricing for Fed policy has shifted. A rate hold at the June FOMC meeting is now virtually assured. Fed fund futures currently show an 83% chance of no change in July, up from 74% a week ago. September pricing has also adjusted notably, with odds of a hold rising to nearly 40%, from just 28% last week.
This shift in expectations aligns with the more cautious wing of the Fed. As Minneapolis Fed President Neel Kashkari recently explained, two camps have emerged within the FOMC. One favors looking through tariff-induced price shocks as temporary and advocates rate cuts to support growth. The other sees a more prolonged inflation threat from drawn-out trade disputes and retaliatory measures, suggesting policy caution is warranted.
Fed Governor Adriana Kugler has added detail to this latter view, identifying three channels through which tariffs may embed inflation. First, she cautioned that higher short-run inflation expectations may give firms more pricing power, extending inflation’s lifespan. Second, “opportunistic pricing” could allow businesses to raise prices even on goods unaffected by tariffs. Finally, she warned that reduced productivity, stemming from cost pressures and weakened investment, could feed longer-term inflation.
For now, the labor market’s endurance gives the inflation-hawk camp more credibility.
Renewed US-China Trade Talks Offer Glimmer of Hope
Signs of thawing in US-China tensions added some additional cautious optimism. The long-awaited phone call between US President Donald Trump and Chinese President Xi Jinping finally took place last week, breaking weeks of silence and geopolitical posturing. More critically, the conversation was not just symbolic—it quickly translated into concrete steps, including a formal resumption of trade negotiations.
Trump announced that Treasury Secretary Scott Bessent, Commerce Secretary Howard Lutnick, and Trade Representative Jamieson Greer will meet Chinese counterparts in London on Monday for renewed trade talks. The resumption of dialogue is a modest but meaningful shift away from the stalemate that has plagued relations.
Adding to the sense of tentative de-escalation, Beijing has quietly taken steps to ease the pressure on US supply chains. According to a Reuters report, China granted temporary export licenses to rare-earth suppliers servicing the top three US automakers. This comes after Beijing’s April decision to restrict exports of rare earths and magnets—critical inputs for automotive, aerospace, and tech industries—sparked widespread supply chain disruptions.
The impact of these restrictions is already visible. Ford recently suspended production of its Explorer SUV at its Chicago plant for a week due to a rare-earth shortage. That incident highlights how deeply reliant advanced manufacturing has become on these materials—and how easily geopolitical leverage can disrupt production cycles. Beijing’s decision to grant temporary relief may signal a tactical concession ahead of negotiations, without altering its broader strategic posture.
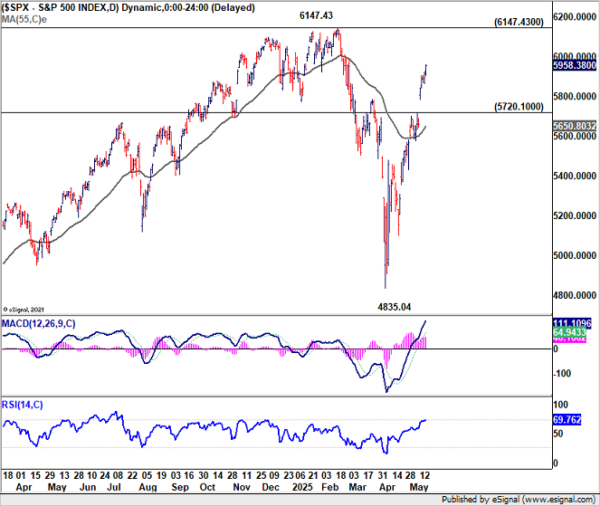
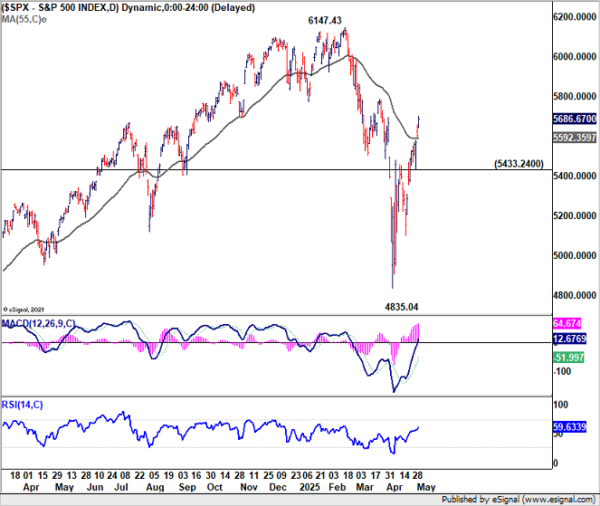
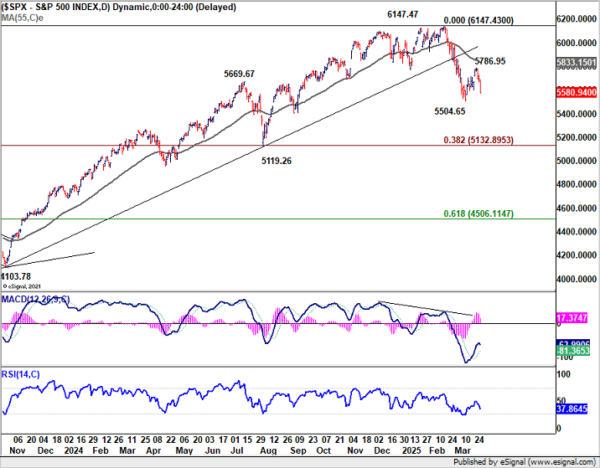
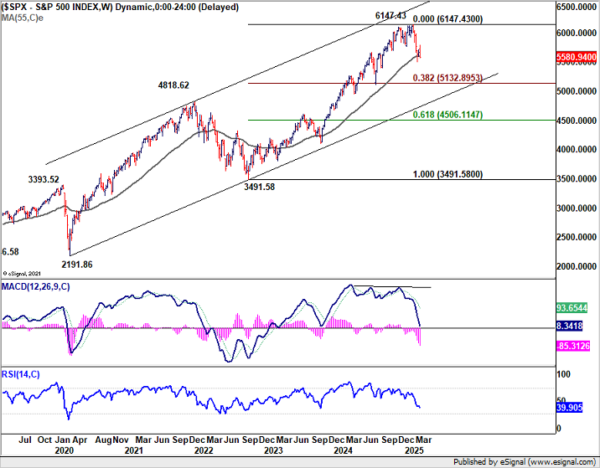
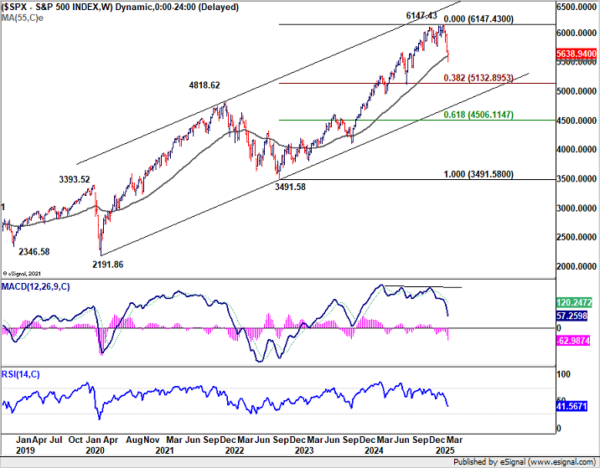
Wall Street Ends Higher But Rally May Stall at Key Levels
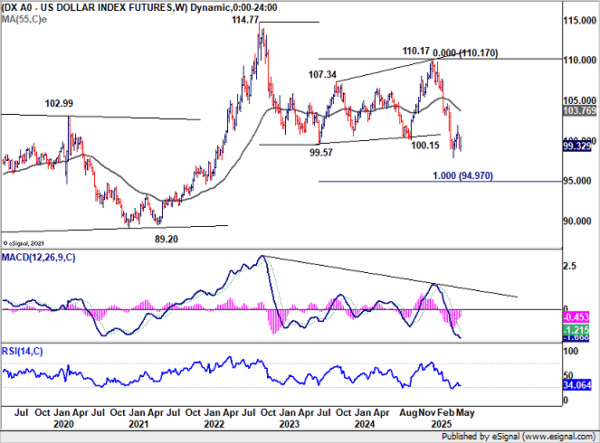
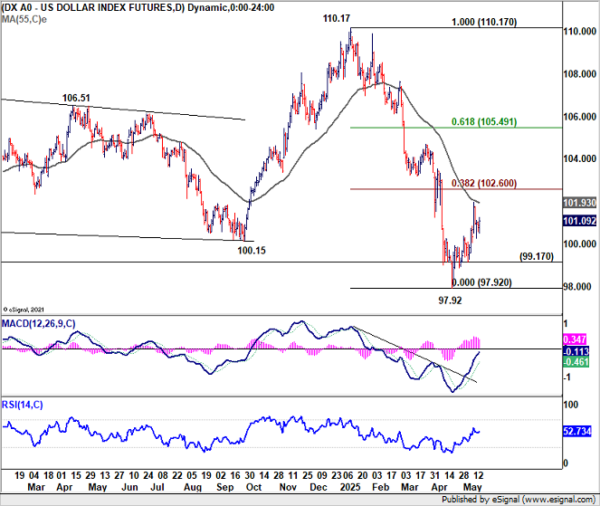
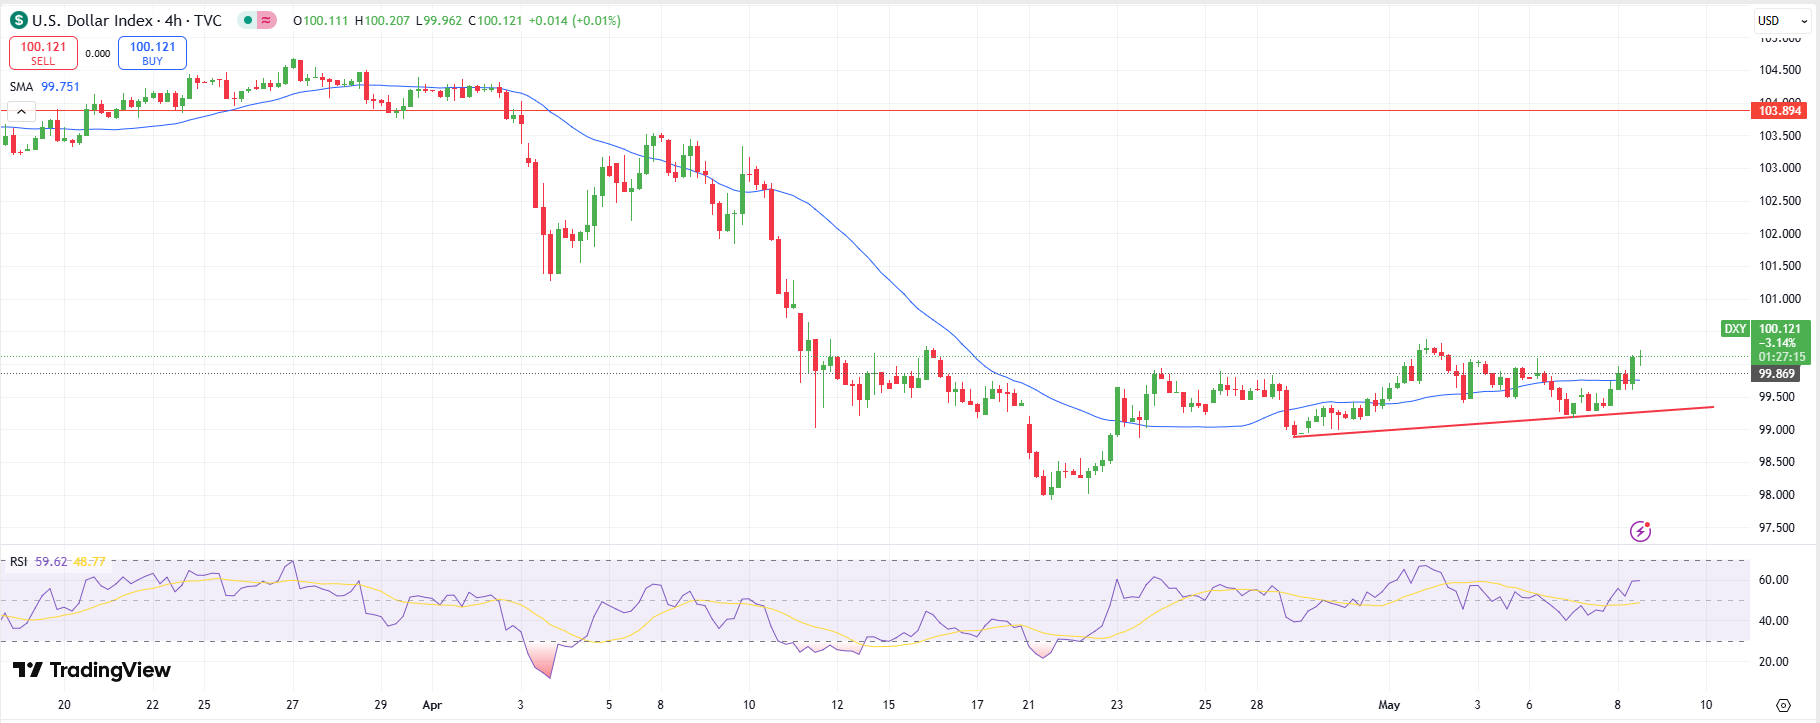
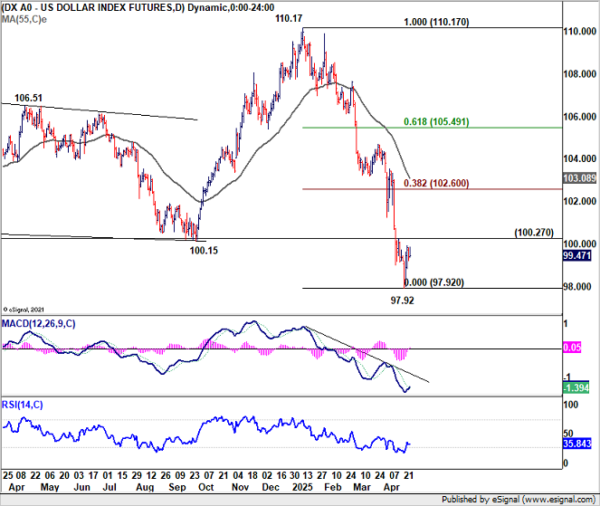
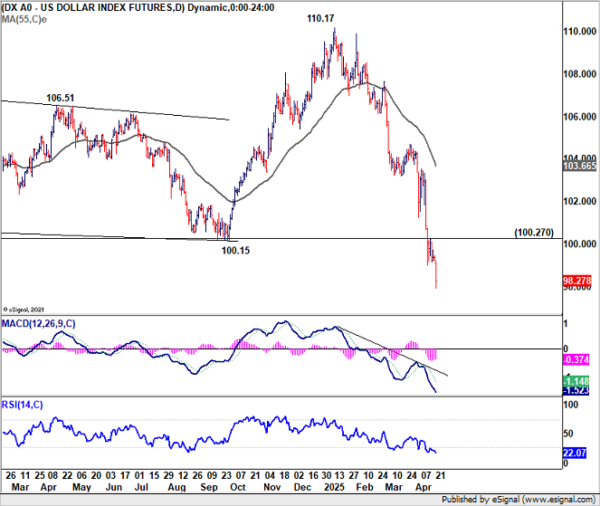
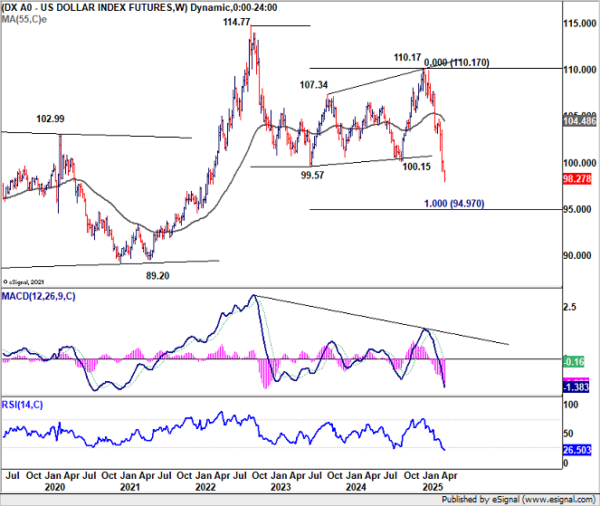
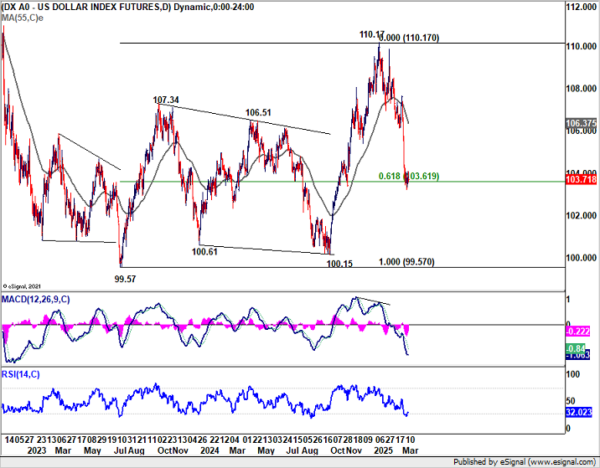
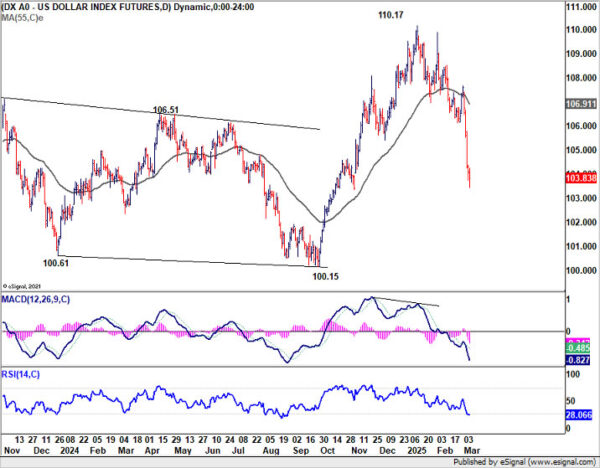
Despite ending the week on a positive note, major US stock indexes are showing signs of fatigue, with momentum staying unconvincing. Any further gains are likely to face stiff resistance ahead. Meanwhile, Dollar Index continued to struggle to breakout from recently established range. There is room for a bounce in Dollar as the near term consolidation is set to extend.
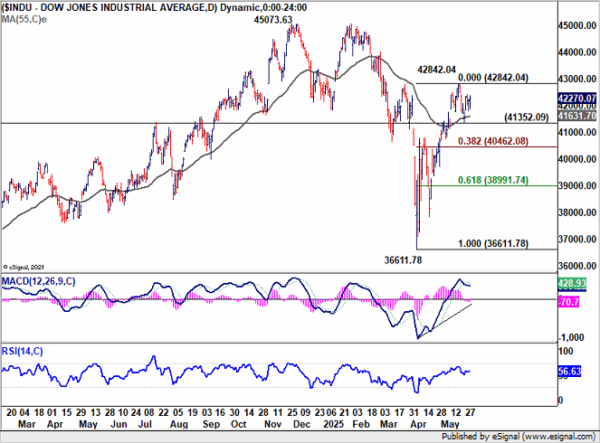
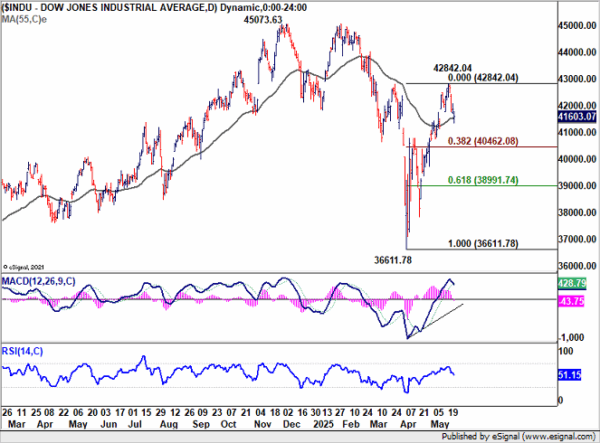
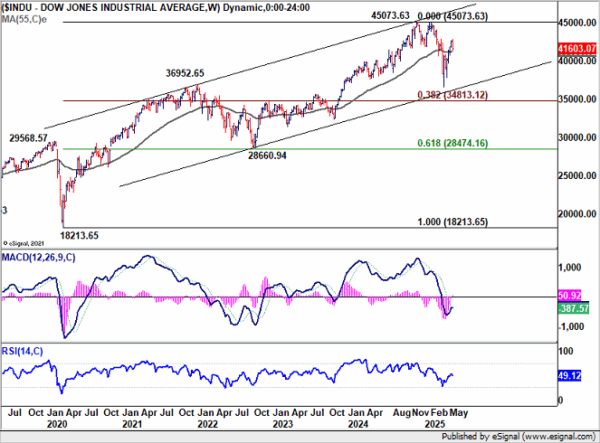
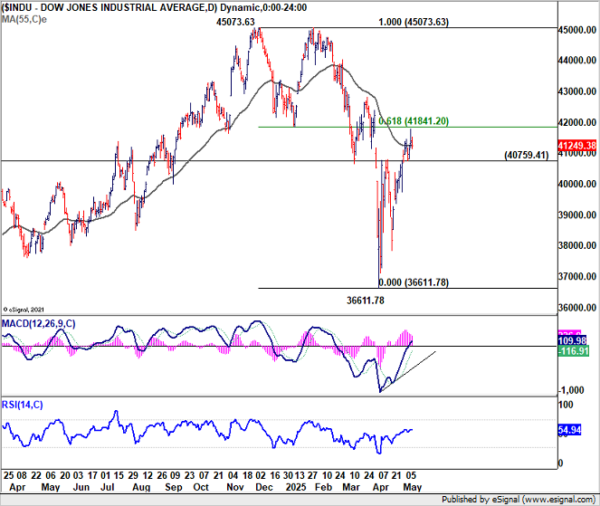
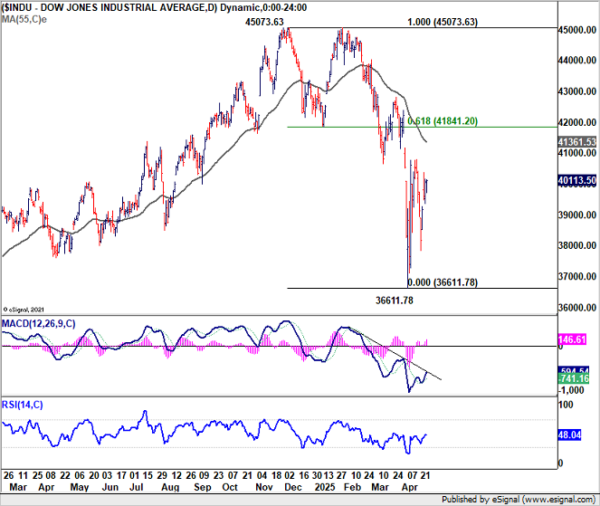
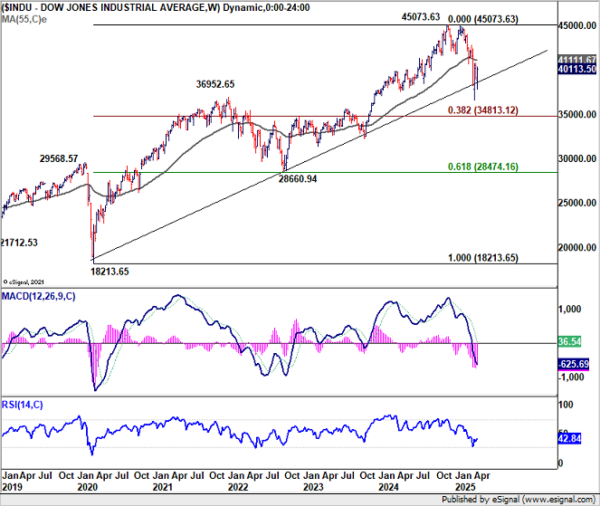
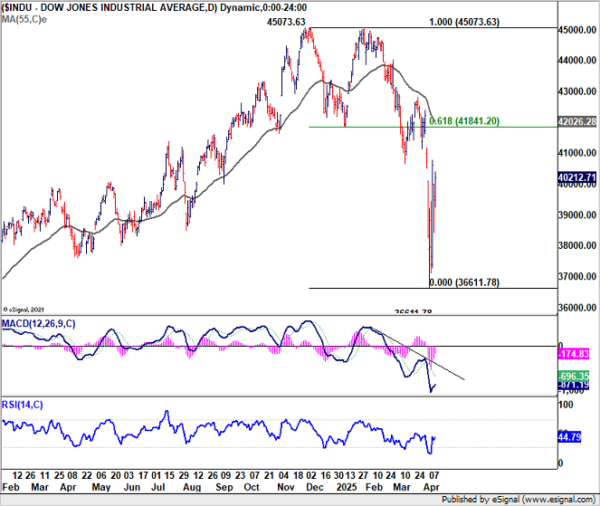
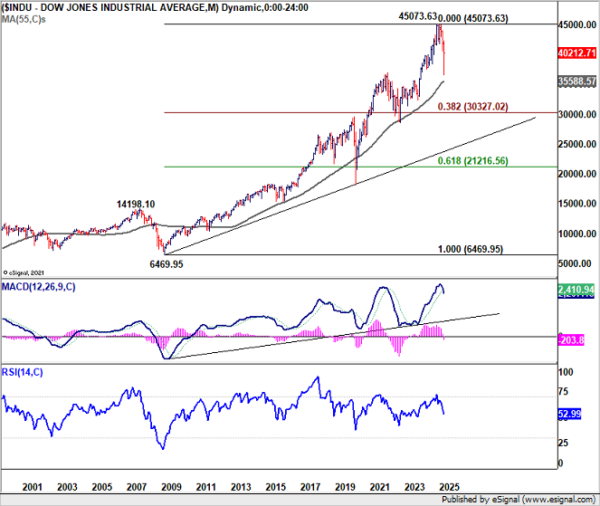
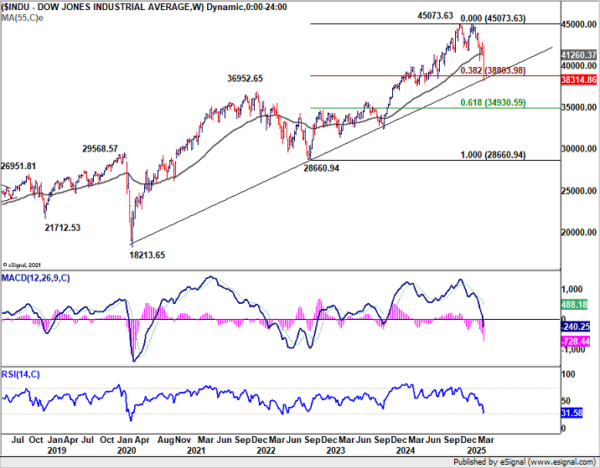
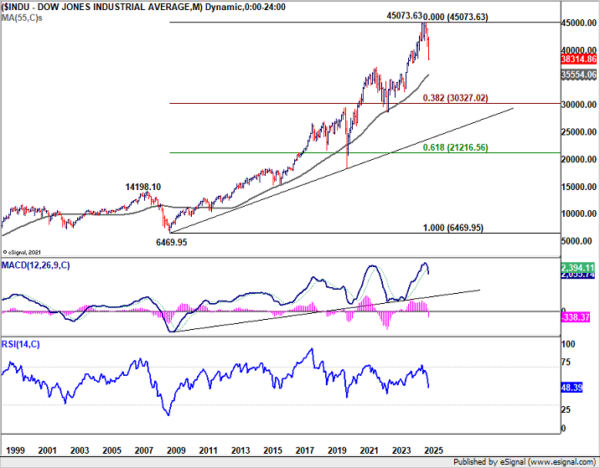
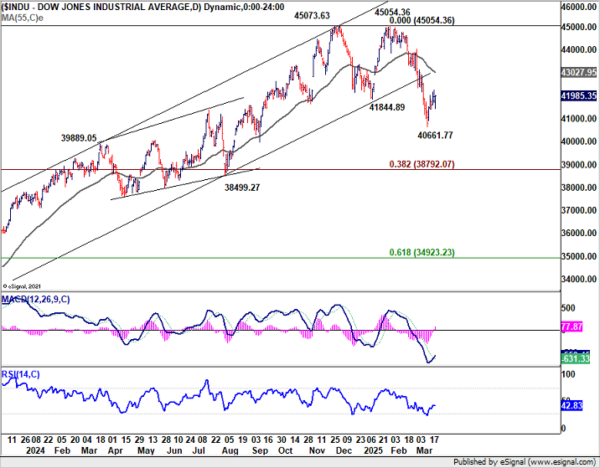
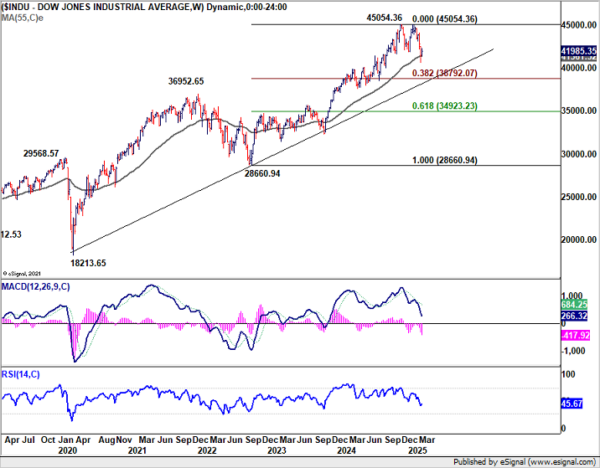
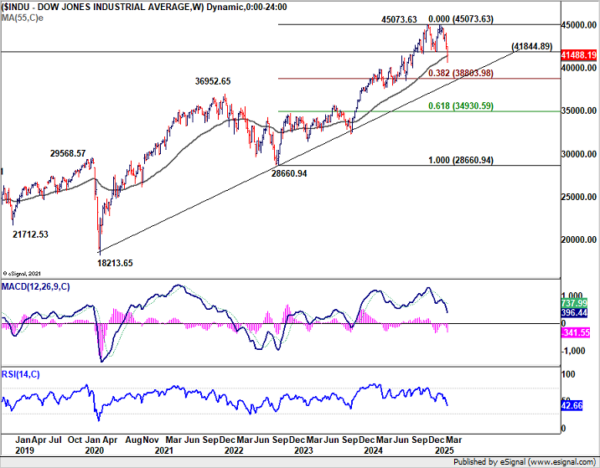
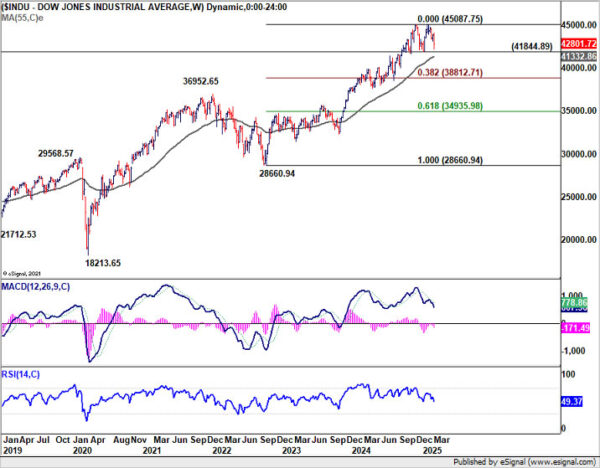
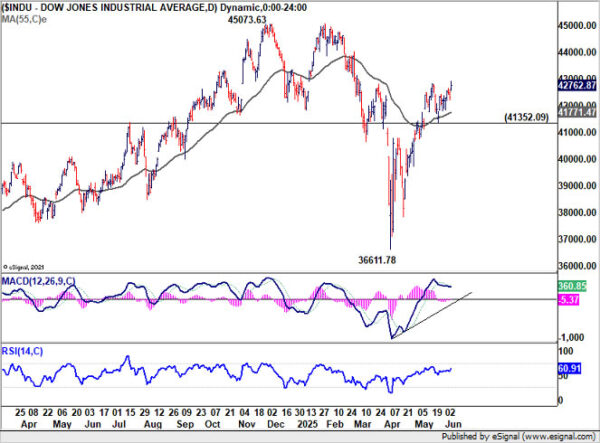
DOW’s rise from 36611.78 is still seen as the second leg of the corrective pattern from 45073.63 high. While further rally might be seen, upside should be limited by 45073.63 to bring near term reversal. Also, considering that D MACD is now staying below signal line, firm break of 41352.09 support will at least indicate short term topping, and bring deeper pullback.
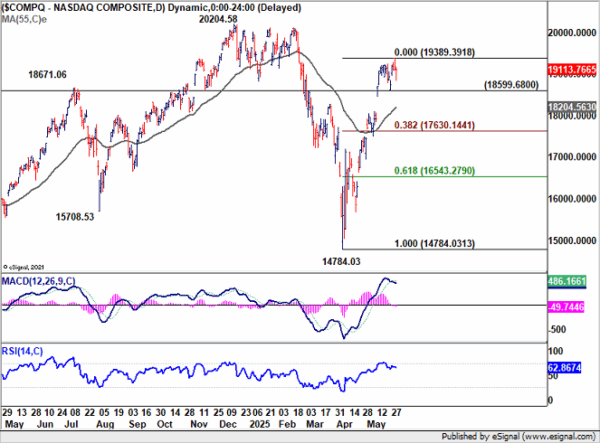
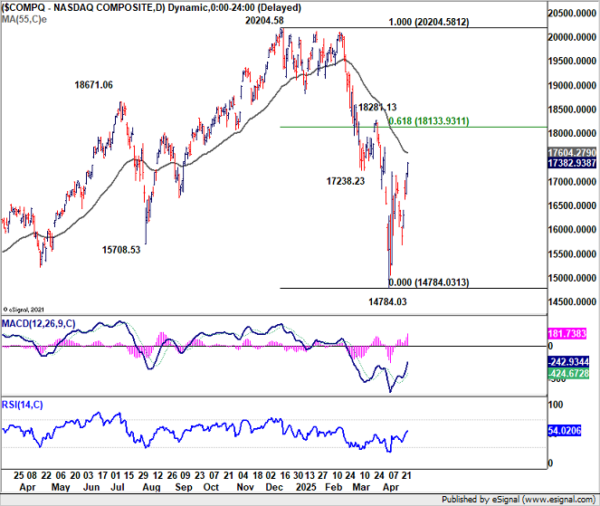
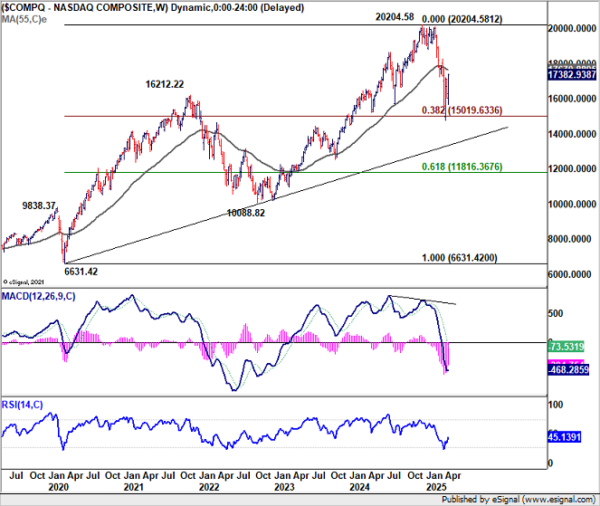
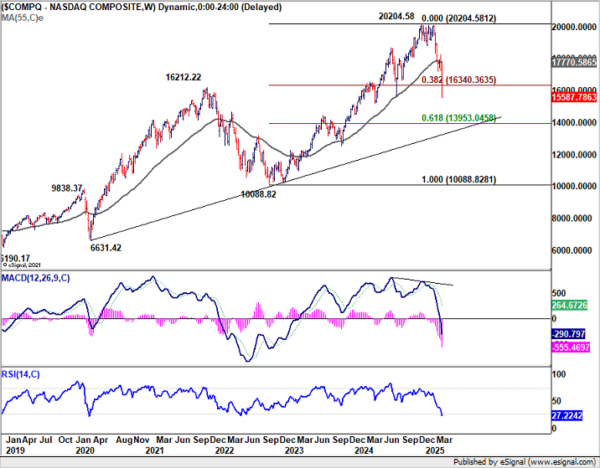
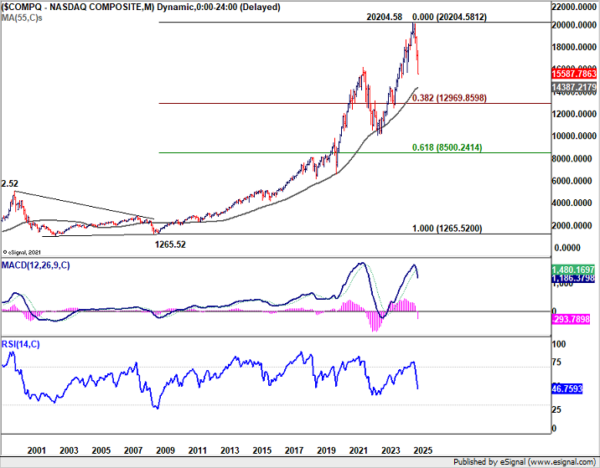
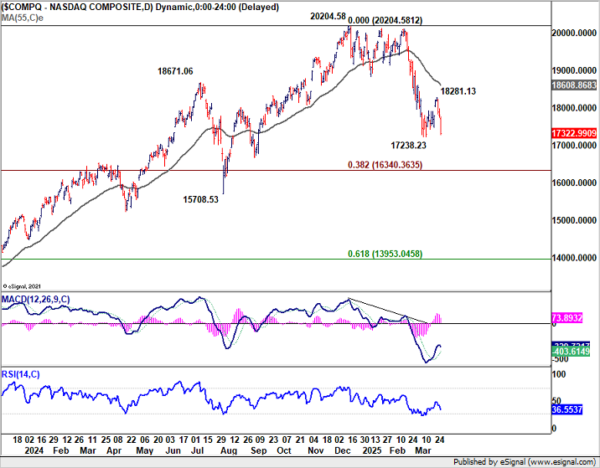
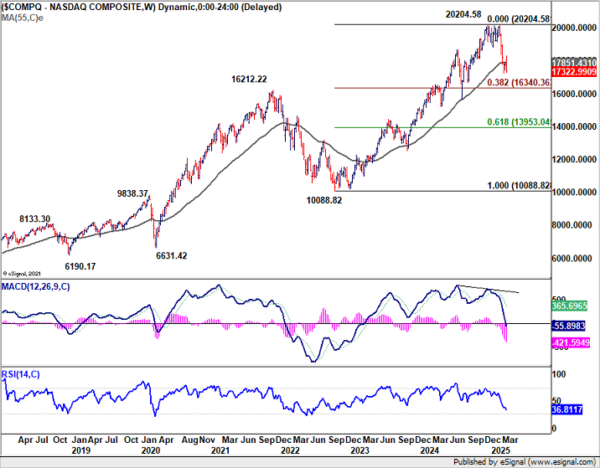
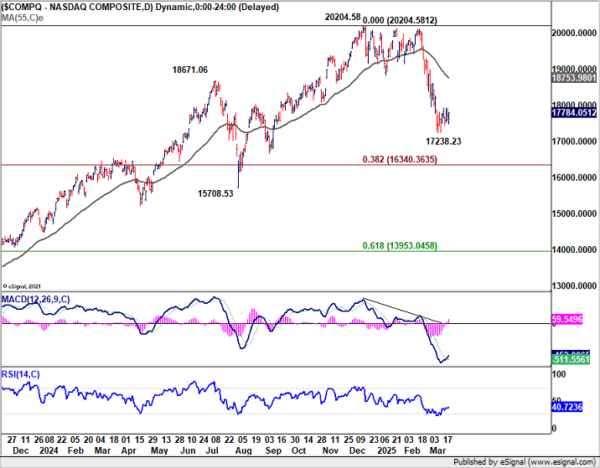
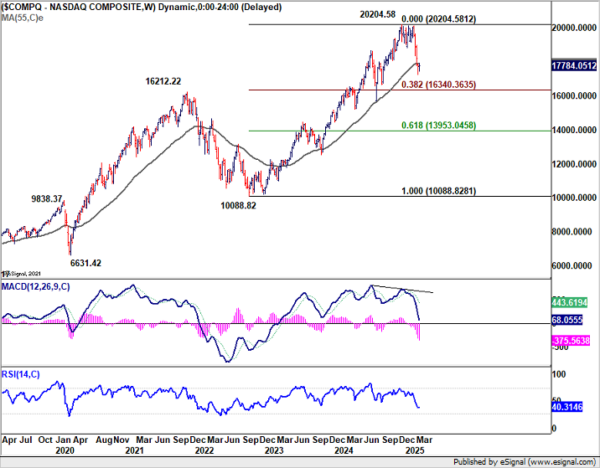
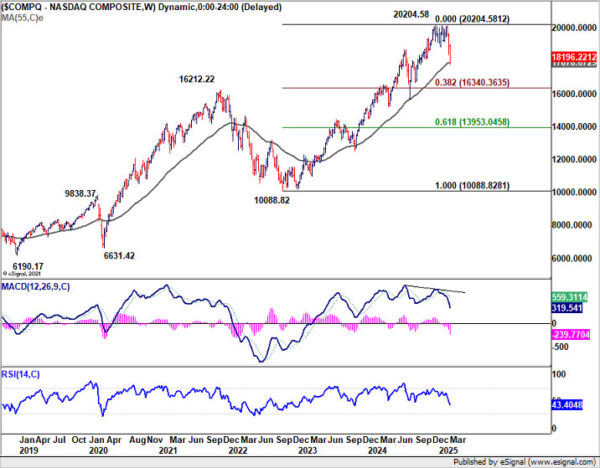
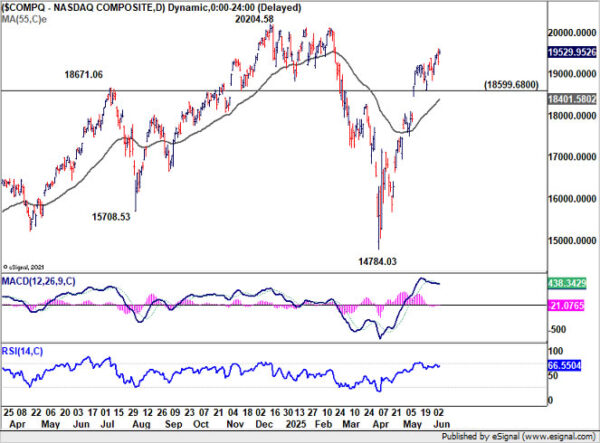
NASDAQ’s picture is similar. Rise from 14784.03 is seen as the second leg of the consolidation pattern from 20204.58. While further rally might be seen, strong resistance should emerge from 20204.58 to bring near term reversal. Considering that D MACD is staying below signal line, firm break of 18599.68 support will at least indicate short term toping, and bring deeper pullback.
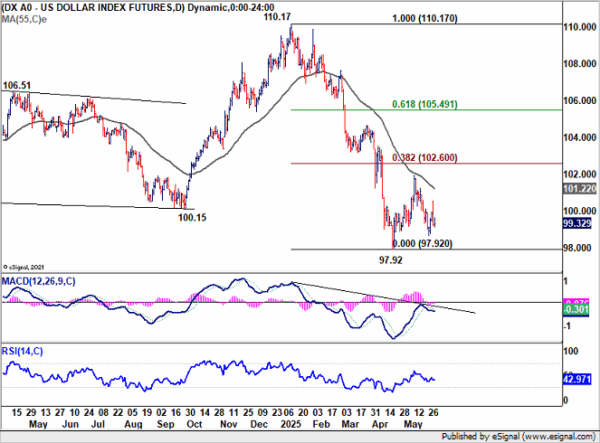
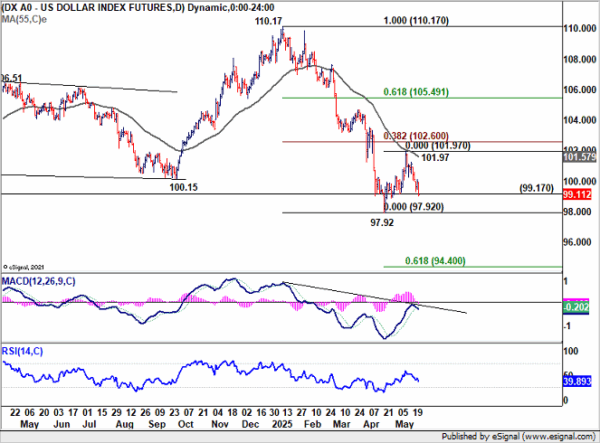
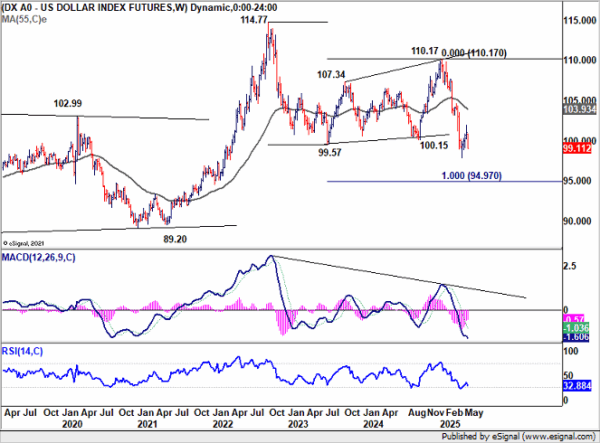
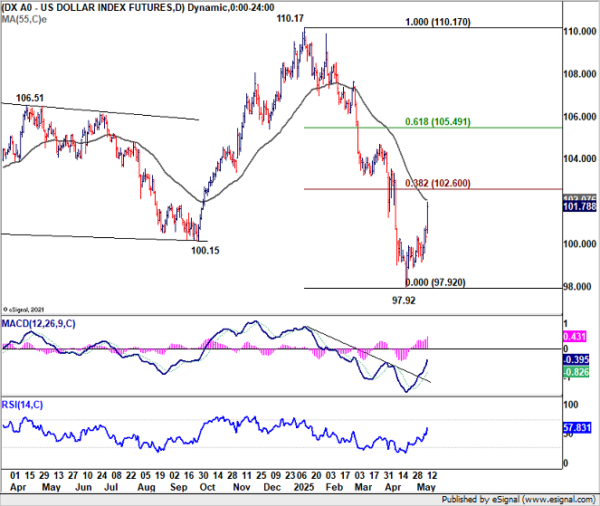
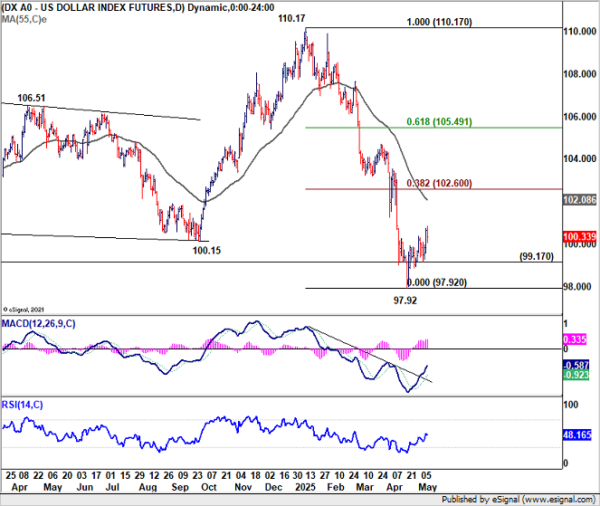
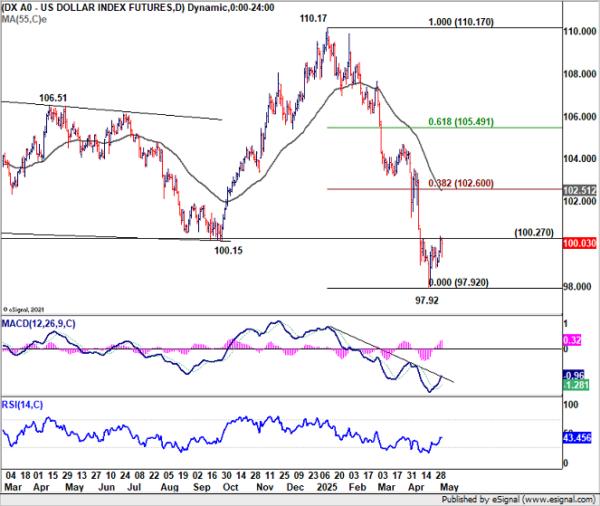
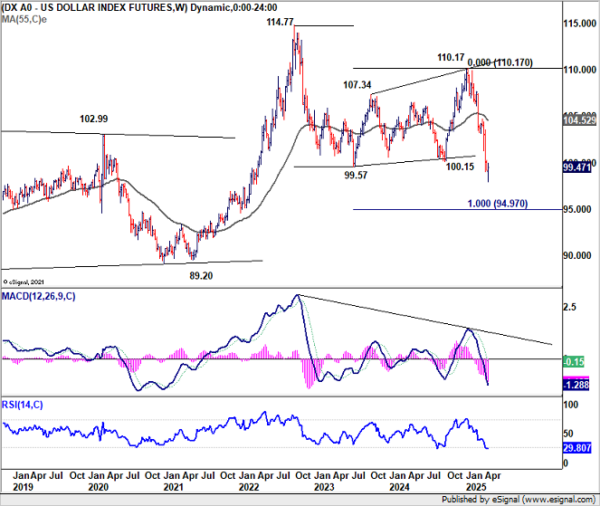
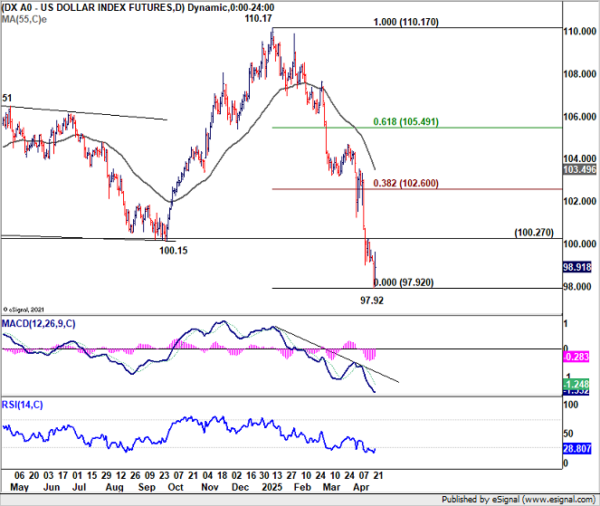
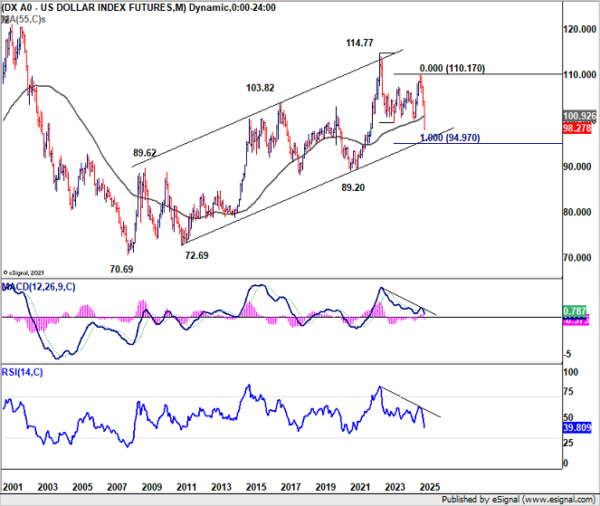
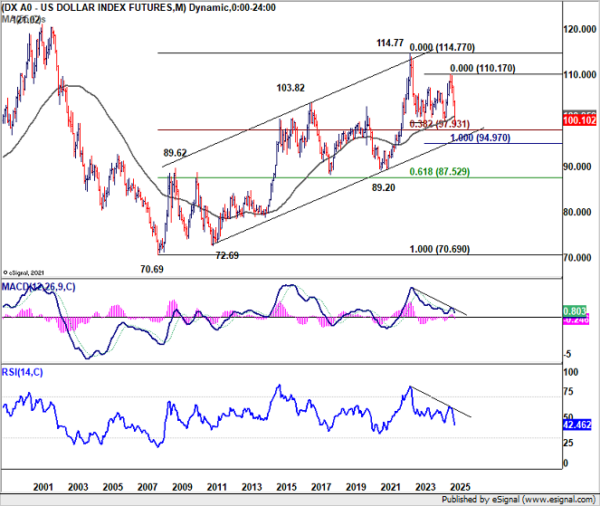
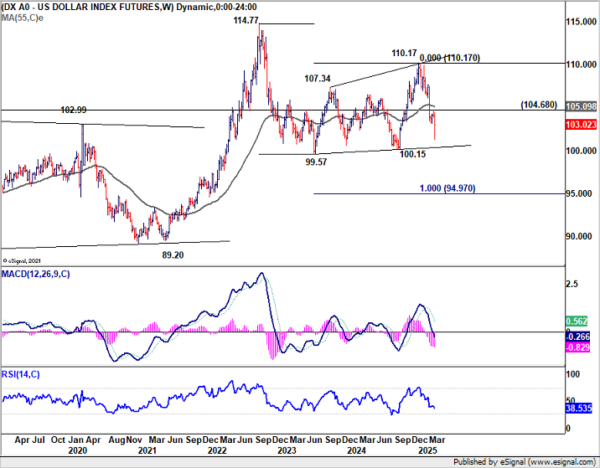
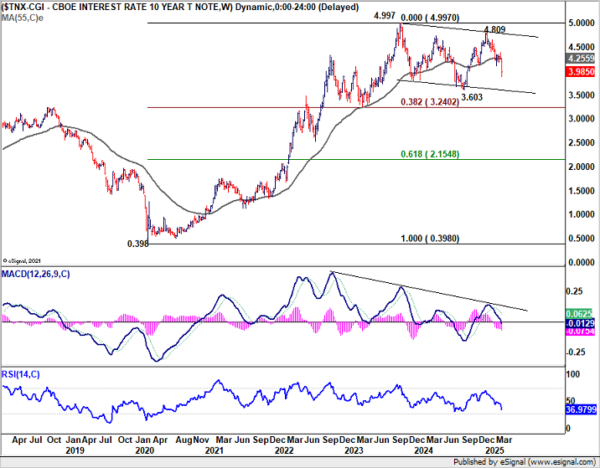
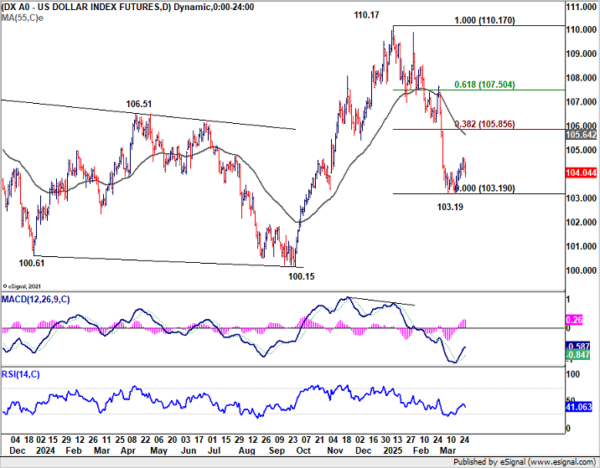
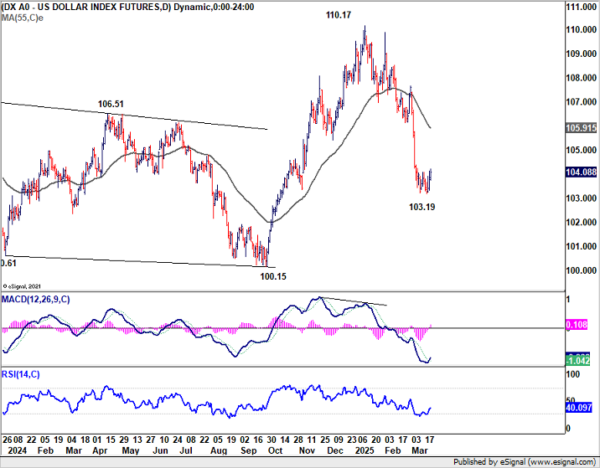
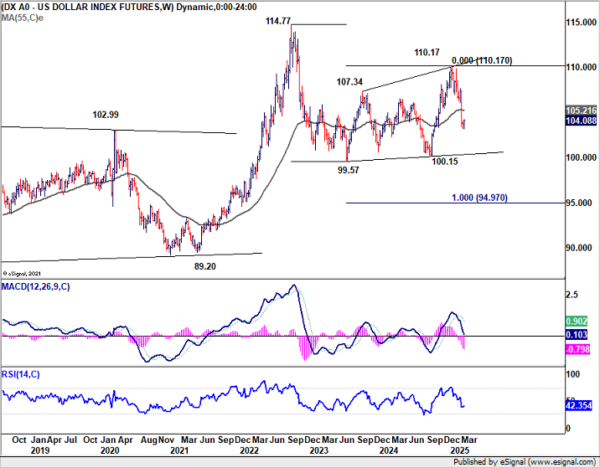
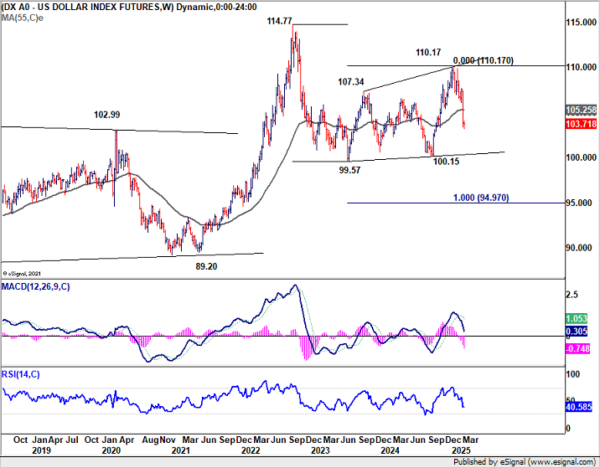
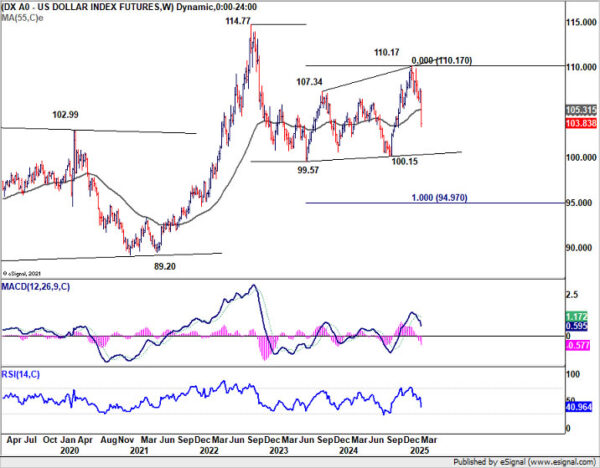
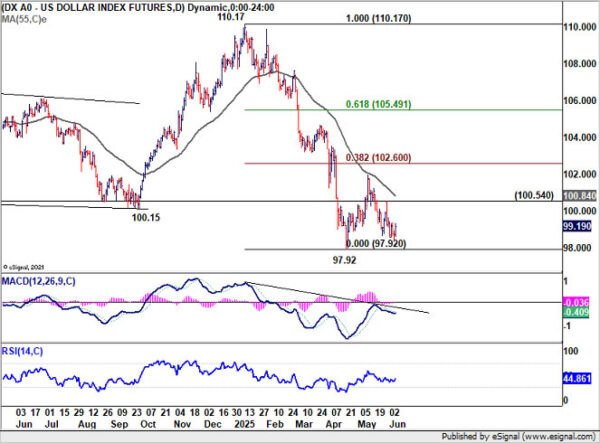
Dollar index struggled to find decisive momentum to break through 97.92 low. Price action from there are seen as a corrective pattern to the decline from 110.17. Break of 100.54 resistance will indicate that the third leg of the consolidations has started, and target 38.2% retracement of 110.17 to 97.92 at 102.60.
BoC Hold, ECB Cuts, EUR/CAD Ranges
Two major central banks, BoC and ECB, delivered expected decisions last week. BoC left its overnight rate unchanged at 2.75% for the second straight meeting, as policymakers await greater clarity on the impact of global trade negotiations. While markets expect easing to resume later this year, the timing remains unclear. The central bank appears willing to act in the second half of the year but is seeking more definitive economic data before committing to further policy moves.
Meanwhile, ECB followed through with a 25bps rate cut, lowering its deposit rate to 2.00%. After the meeting, a number of Governing Council members hinted at a possible pause in July. Some Governing Council members went further, suggesting the ECB may have already “won the battle” against inflation. With the policy rate now considered deep in neutral territory, the threshold for additional easing has risen substantially, especially amid persistent global trade and geopolitical risks.
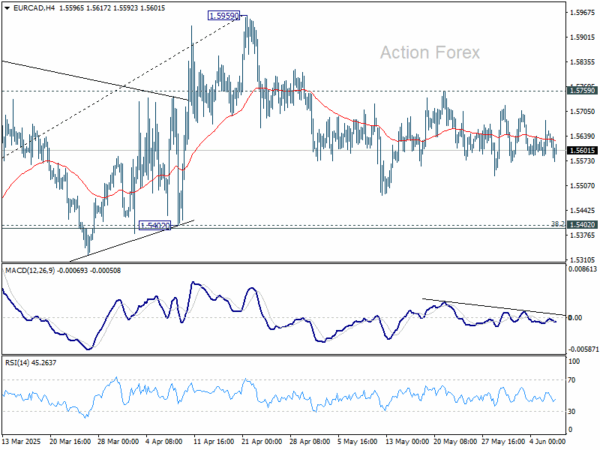
Technically, EUR/CAD continued to gyrate inside established range last week, as consolidation pattern from 1.5959 extended. Another dip cannot be ruled out in the near term. But downside should be contained by 1.5402 cluster support (38.2% retracement of 1.4483 to 1.5959 at 1.5395 to bring rebound. On the upside, break of 1.5759 resistance will bring retest of 1.5959 high.
EUR/USD Weekly Outlook
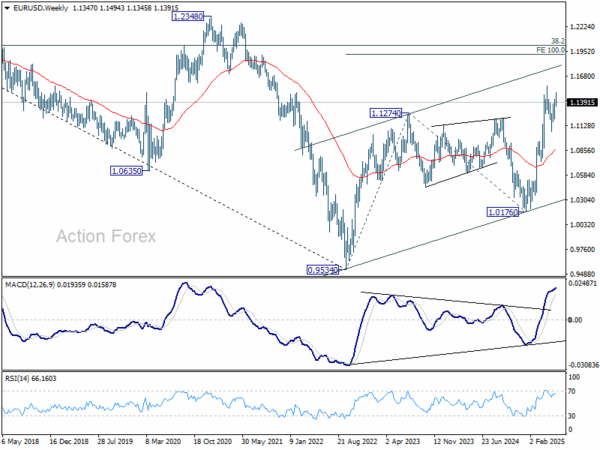
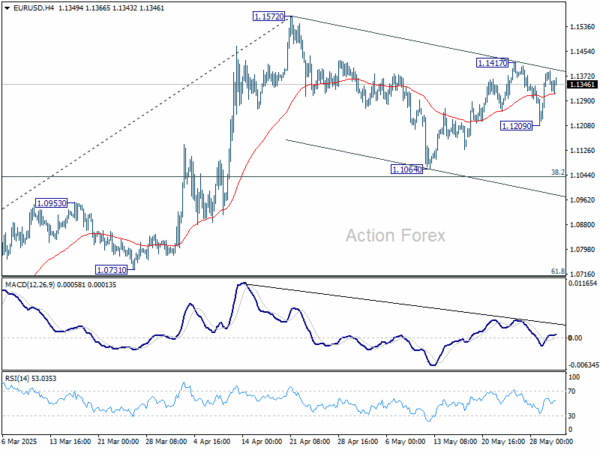
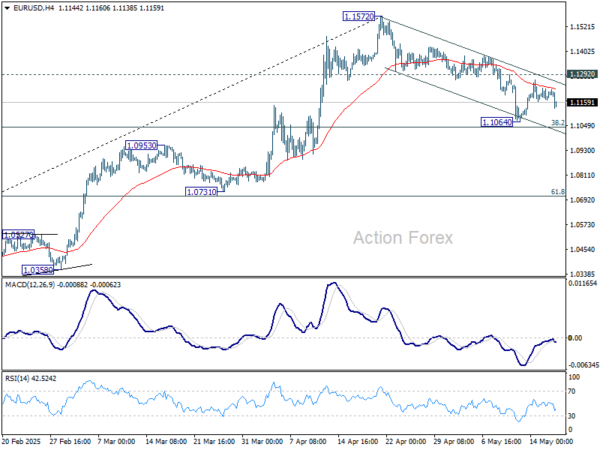
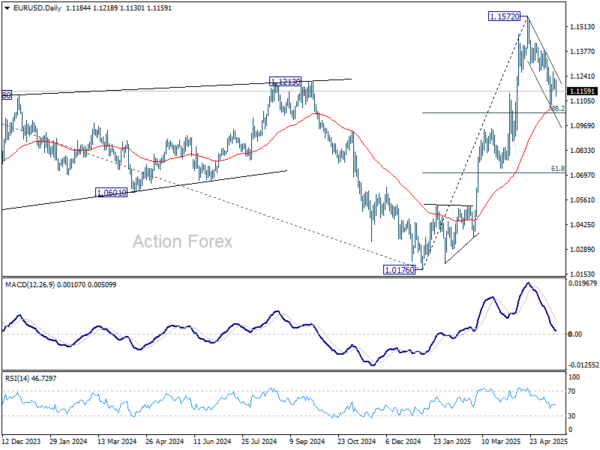
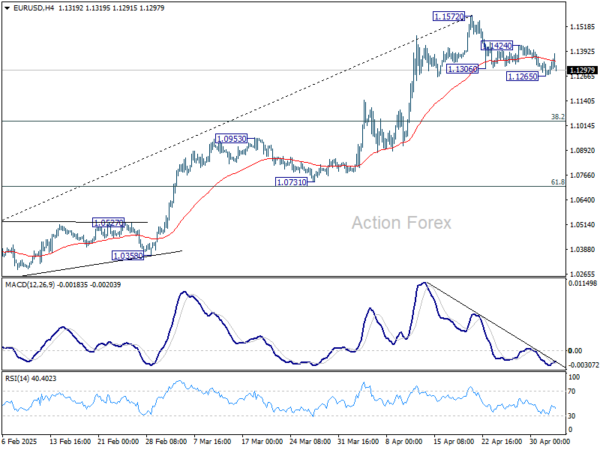
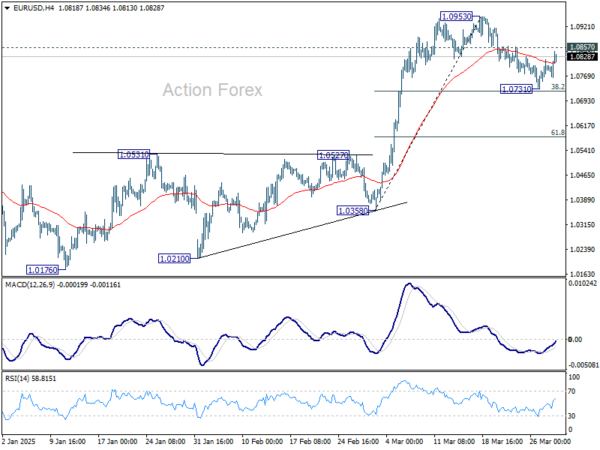
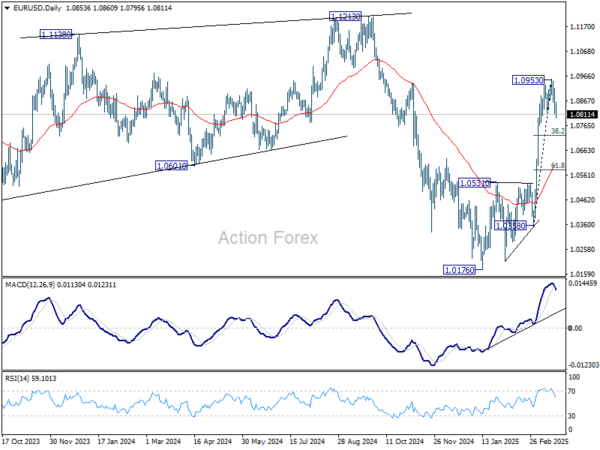
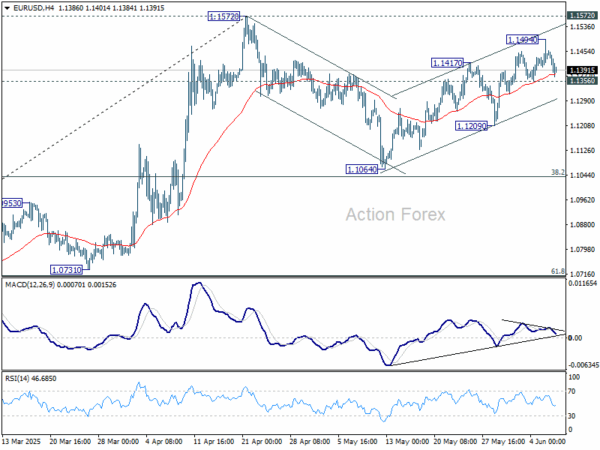
EUR/USD edged higher to 1.1494 last week but lost momentum again. Initial bias stays neutral this week first. Price actions from 1.1572 are seen as a corrective pattern to rally from 1.0716. While rebound from 1.1064 might extend, strong resistance should emerge from 1.1572 to limit upside. On the downside, break of 1.1356 support will argue that the correction is already in the third leg, and target 1.1209 support for confirmation.
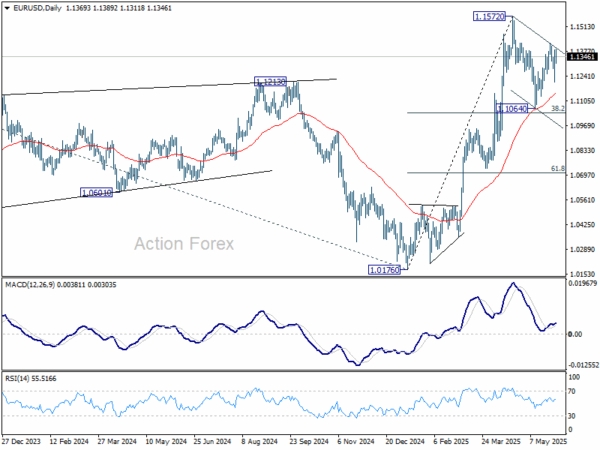
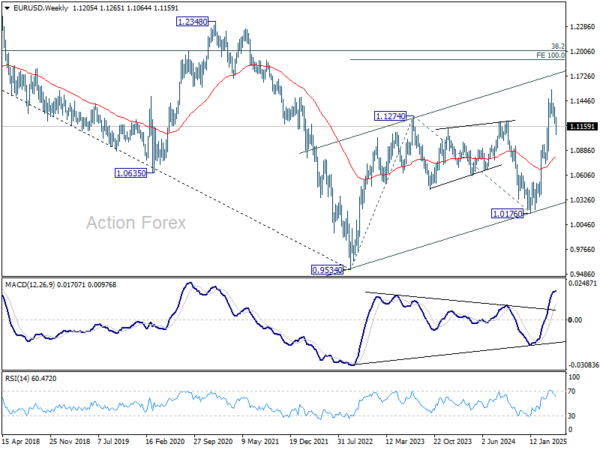
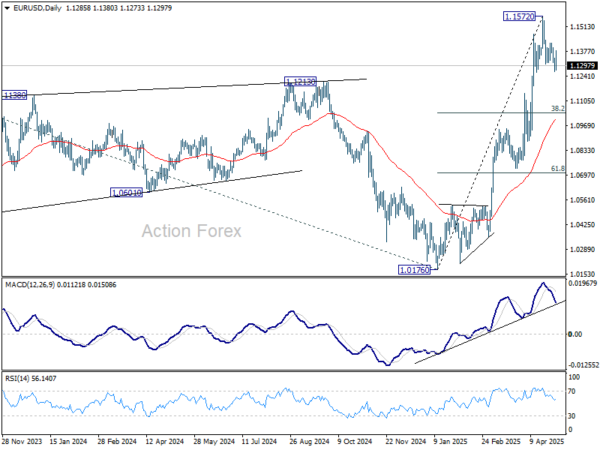
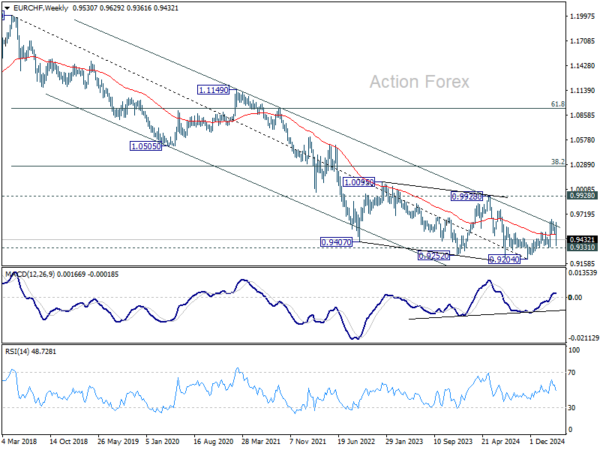
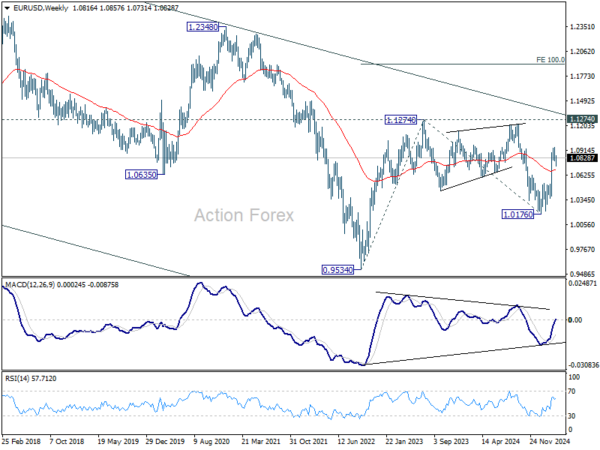
In the bigger picture, rise from 0.9534 long term bottom could be correcting the multi-decade downtrend or the start of a long term up trend. In either case, further rise should be seen to 100% projection of 0.9534 to 1.1274 from 1.0176 at 1.1916. This will now remain the favored case as long as 55 W EMA (now at 1.0875) holds.
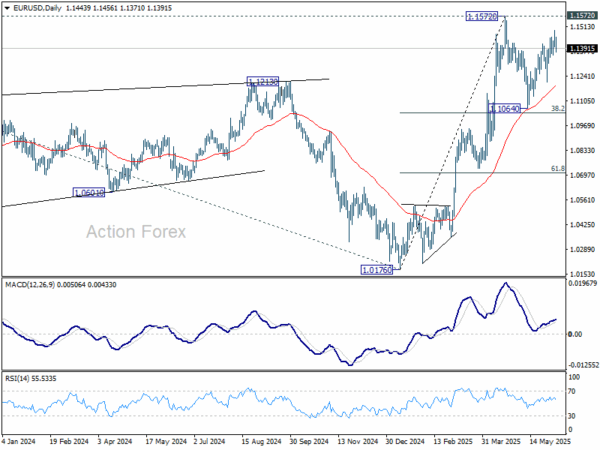
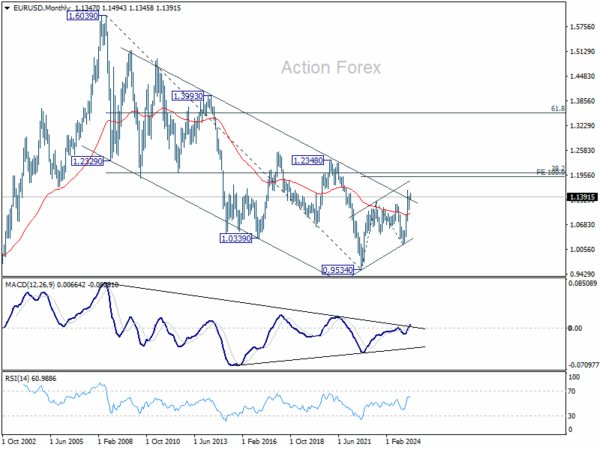
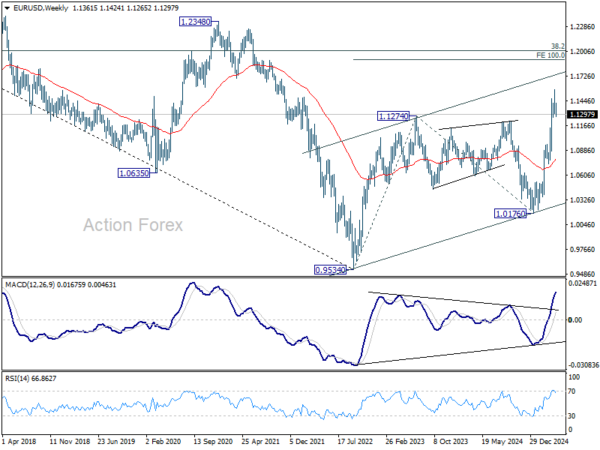
In the long term picture, the case of long term bullish reversal is building up. Sustained break of falling channel resistance (now at around 1.1278) will argue that the down trend from 1.6039 (2008 high) has completed at 0.9534. A medium term up trend should then follow even as a corrective move. Next target is 38.2% retracement of 1.6039 to 0.9534 at 1.2019.