Tag: Macroeconomics

  • Australian Dollar maintains position, upside seems limited as China braces for US tariffs

    Australian Dollar maintains position, upside seems limited as China braces for US tariffs


    • The Australian Dollar could struggle as China is due to be hit with a 10% tariff later in the day.
    • Traders monitor the development surrounding the tariff deal with China.
    • Trump would suspend his tariffs after both countries agreed to send 10,000 soldiers to the US border to prevent drug trafficking.

    The Australian Dollar (AUD) rebounds on Tuesday, ending its six-day losing streak as the AUD/USD pair rises amid a weakening US Dollar (USD). The USD depreciated after US President Donald Trump announced late Monday that he would pause tariffs on Mexico and Canada. However, market volatility remains a concern as investors closely watch developments in the ongoing tariff negotiations with China, Australia’s key trading partner. China is due to be hit with across-the-board tariffs of 10% that begin at 05.00 GMT on Tuesday.

    President Trump stated that he would suspend steep tariffs on Mexico and Canada after their leaders agreed to deploy 10,000 soldiers to the US border to combat drug trafficking. The tariffs on Mexico and Canada have been postponed for at least 30 days. This decision comes just two days after Trump imposed 25% tariffs on Mexican and Canadian goods and 10% tariffs on imports from China.

    The AUD may lose its ground due to the increased likelihood that the Reserve Bank of Australia (RBA) could consider a rate cut in February. The RBA has maintained the Official Cash Rate (OCR) at 4.35% since November 2023, emphasizing that inflation must “sustainably” return to its 2%-3% target range before any policy easing.

    Australian Dollar appreciates due to improved risk sentiment

    • The US Dollar Index (DXY), which measures the US Dollar’s value against six major currencies, stabilizes around 108.70 at the time of writing after giving up most of its gains in the previous session.
    • The White House announced late Monday that US President Donald Trump signed an executive order to initiate the creation of a government-owned investment fund, according to Reuters. This fund could allow the US to profit from TikTok if an American buyer is secured. TikTok has until early April to find an approved partner or purchaser. Trump is pushing for the US to acquire a 50% stake in the company.
    • Data released by the Institute for Supply Management (ISM) on Monday showed that the Manufacturing PMI rose to 50.9 in January from 49.3 in December. This reading came in better than the estimation of 49.8.
    • The US Personal Consumption Expenditures (PCE) Price Index, the Fed’s preferred inflation gauge, rose 0.3% MoM in December, up from 0.1% in November. On an annual basis, PCE inflation accelerated to 2.6% from the previous 2.4%, while core PCE, which excludes food and energy, remained steady at 2.8% YoY for the third straight month.
    • Fed Chair Jerome Powell emphasized during the post-meeting press conference that the central bank would need to see “real progress on inflation or some weakness in the labor market” before considering any further adjustments to monetary policy.
    • US Treasury Secretary Scott Bessent warned Key Square Capital Management partners a year ago that “tariffs are inflationary and would strengthen the US Dollar—hardly a good starting point for a US industrial renaissance.” However, according to the Financial Times (FT), Bessent last week advocated for new universal tariffs on US imports, proposing an initial 2.5% rate that would gradually increase.
    • President Trump announced his threat on X (formerly Twitter) to levy 100% tariffs on BRICS nations if they attempt to introduce an alternative currency to challenge the US dollar in international trade.
    • Australia’s Retail Sales declined by 0.1% month-on-month in December 2024, marking the first drop in nine months. Although the decline was less severe than the anticipated 0.7% contraction. The annual sales increased by 4.6% compared to December 2023. On a seasonally adjusted basis, sales rose 1.0% QoQ in the December quarter of 2024.
    • China’s Caixin Manufacturing Purchasing Managers’ Index (PMI) declined to 50.1 in January, down from 50.5 in December. The reading fell short of market expectations, which had anticipated a steady 50.5.
    • ANZ, CBA, Westpac, and now National Australia Bank (NAB) all anticipate a 25 basis point (bps) rate cut from the Reserve Bank of Australia (RBA) in February. Previously, the NAB had forecasted a rate cut in May but has now moved its projection forward to the February RBA meeting.
    • The Reserve Bank of Australia released its January 2025 Bulletin, featuring a detailed analysis of how monetary policy changes influence interest rates in the economy and how fluctuations in interest rates impact economic activity and inflation.

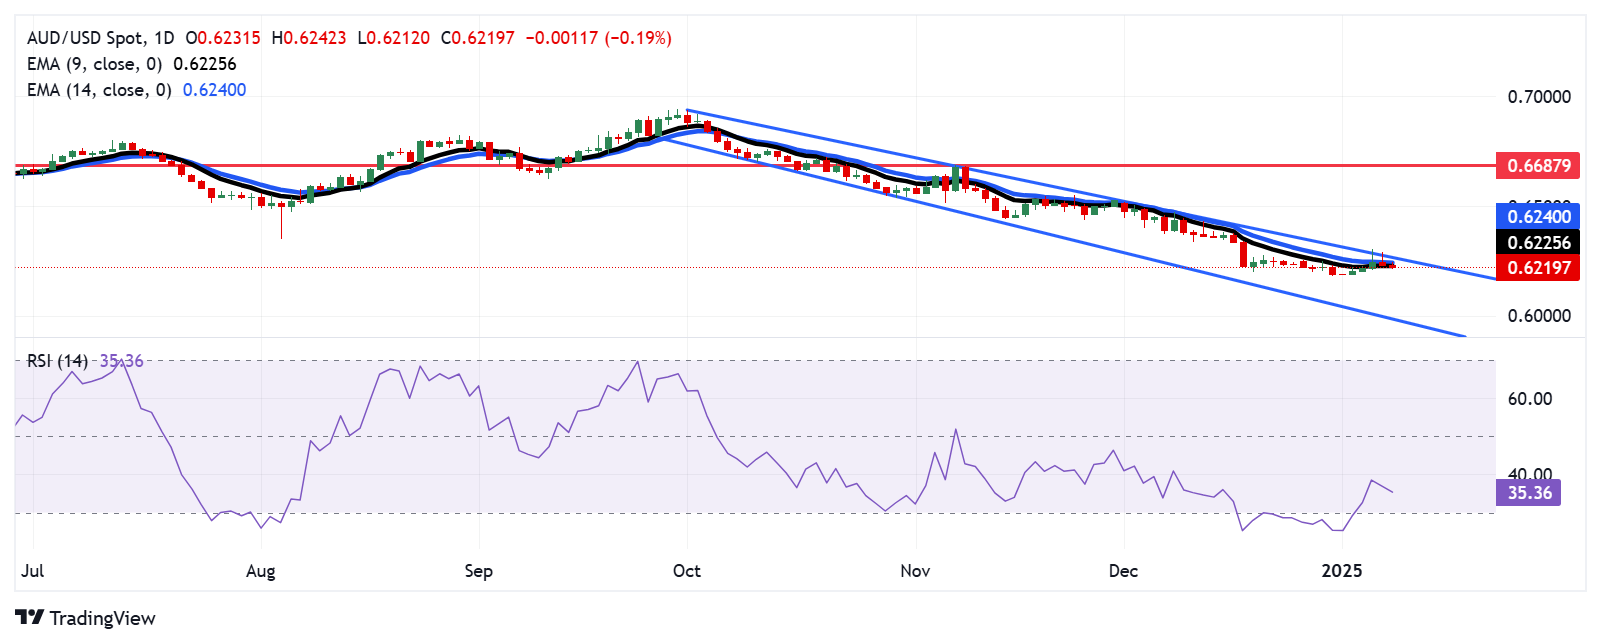
    Australian Dollar tests nine-day EMA barrier near descending channel’s upper boundary

    AUD/USD hovers around 0.6210 on Tuesday, trading within the descending channel pattern on the daily chart, signaling a bearish bias. However, the 14-day Relative Strength Index (RSI) has rebounded toward the 50 level, signaling weakening downside momentum. A breakout above the channel and a sustained move above the 50 mark on the RSI could indicate a shift toward a bullish bias.

    On the downside, the AUD/USD pair could test the descending channel’s lower boundary at the 0.6150 level. A break below the channel would guide the pair to navigate the region around 0.6087, the lowest since April 2020, recorded on February 3.

    The AUD/USD pair tests its initial barrier at the nine-day Exponential Moving Average (EMA) of 0.6225, aligned with the upper boundary of the descending channel.

    AUD/USD: Daily Chart

    Australian Dollar PRICE Today

    The table below shows the percentage change of Australian Dollar (AUD) against listed major currencies today. Australian Dollar was the strongest against the Japanese Yen.

      USD EUR GBP JPY CAD AUD NZD CHF
    USD   -0.26% -0.19% 0.31% -0.76% -0.44% -0.41% -0.09%
    EUR 0.26%   0.07% 0.58% -0.50% -0.18% -0.14% 0.17%
    GBP 0.19% -0.07%   0.48% -0.57% -0.26% -0.22% 0.10%
    JPY -0.31% -0.58% -0.48%   -1.04% -0.73% -0.71% -0.38%
    CAD 0.76% 0.50% 0.57% 1.04%   0.31% 0.35% 0.68%
    AUD 0.44% 0.18% 0.26% 0.73% -0.31%   0.04% 0.38%
    NZD 0.41% 0.14% 0.22% 0.71% -0.35% -0.04%   0.31%
    CHF 0.09% -0.17% -0.10% 0.38% -0.68% -0.38% -0.31%  

    The heat map shows percentage changes of major currencies against each other. The base currency is picked from the left column, while the quote currency is picked from the top row. For example, if you pick the Australian Dollar from the left column and move along the horizontal line to the US Dollar, the percentage change displayed in the box will represent AUD (base)/USD (quote).

    Tariffs FAQs

    Tariffs are customs duties levied on certain merchandise imports or a category of products. Tariffs are designed to help local producers and manufacturers be more competitive in the market by providing a price advantage over similar goods that can be imported. Tariffs are widely used as tools of protectionism, along with trade barriers and import quotas.

    Although tariffs and taxes both generate government revenue to fund public goods and services, they have several distinctions. Tariffs are prepaid at the port of entry, while taxes are paid at the time of purchase. Taxes are imposed on individual taxpayers and businesses, while tariffs are paid by importers.

    There are two schools of thought among economists regarding the usage of tariffs. While some argue that tariffs are necessary to protect domestic industries and address trade imbalances, others see them as a harmful tool that could potentially drive prices higher over the long term and lead to a damaging trade war by encouraging tit-for-tat tariffs.

    During the run-up to the presidential election in November 2024, Donald Trump made it clear that he intends to use tariffs to support the US economy and American producers. In 2024, Mexico, China and Canada accounted for 42% of total US imports. In this period, Mexico stood out as the top exporter with $466.6 billion, according to the US Census Bureau. Hence, Trump wants to focus on these three nations when imposing tariffs. He also plans to use the revenue generated through tariffs to lower personal income taxes.


    Source link

  • USD/INR holds steady as Trump threatens China with tariffs

    USD/INR holds steady as Trump threatens China with tariffs


    • The Indian Rupee trades flat in Wednesday’s Asian session.
    • Renewed USD demand and Trump’s tariff announcements might weigh on the INR. 
    • The routine RBI intervention and lower crude oil prices might cap the downside for local currency. 

    The Indian Rupee (INR) flat lines on Wednesday. The persistent US Dollar (USD) buying from foreign portfolio investors and local oil companies could weigh on the lNR. Additionally, US President Donald Trump’s plan to impose tariffs on China might exert some selling pressure on Asian peers, including the Indian Rupee. 

    Nonetheless, the downside for the INR might be limited as the Reserve Bank of India (RBI) could intervene in the foreign exchange market via USD sales to prevent the local currency from significant depreciation. A decline in crude oil prices might also help limit the INR’s losses as India is the world’s third-largest oil consumer. Investors will closely monitor the preliminary reading of HSBC India’s Purchasing Managers Index (PMI) and US S&P PMI data for January, which will be published later on Friday. 

    Indian Rupee looks fragile amid multiple headwinds

    • India’s GDP is estimated to grow at 6.5-6.8% in the current fiscal year, according to Deloitte India on Tuesday.
    • Moody’s lowered India’s economic growth forecast to 7.0% for the fiscal year ending March 2025, down from 8.2% recorded in the previous fiscal year.
    • Overseas investors have sold a net total of about $6.5 billion worth of local equities and bonds in January, the largest monthly outflow since October 2023.
    • Trump stated on Tuesday that his administration is discussing imposing a 10% tariff on goods imported from China on February 1 because fentanyl is being sent from China to Mexico and Canada, per Reuters. 

    USD/INR price action remains constructive in the longer term 

    The Indian Rupee trades on a flat note on the day. The path of least resistance is to the upside as the USD/INR pair has formed higher highs and higher lows while holding above the key 100-day Exponential Moving Average (EMA) on the daily chart. Additionally, the 14-day Relative Strength Index (RSI) is located above the midline near 67.00, indicating bullish momentum in the near term. 

    The all-time high of 86.69 appears to be a tough nut to crack for bulls. A sustained break above the mentioned level could open the door for a rally toward the 87.00 psychological level. 

    On the flip side, a move back below 86.18, the low of January 20, could clear the way for a dip to the next support level at 85.85, the low of January 10. The next downside target to watch is 85.65, the low of January 7. 

    Indian Rupee FAQs

    The Indian Rupee (INR) is one of the most sensitive currencies to external factors. The price of Crude Oil (the country is highly dependent on imported Oil), the value of the US Dollar – most trade is conducted in USD – and the level of foreign investment, are all influential. Direct intervention by the Reserve Bank of India (RBI) in FX markets to keep the exchange rate stable, as well as the level of interest rates set by the RBI, are further major influencing factors on the Rupee.

    The Reserve Bank of India (RBI) actively intervenes in forex markets to maintain a stable exchange rate, to help facilitate trade. In addition, the RBI tries to maintain the inflation rate at its 4% target by adjusting interest rates. Higher interest rates usually strengthen the Rupee. This is due to the role of the ‘carry trade’ in which investors borrow in countries with lower interest rates so as to place their money in countries’ offering relatively higher interest rates and profit from the difference.

    Macroeconomic factors that influence the value of the Rupee include inflation, interest rates, the economic growth rate (GDP), the balance of trade, and inflows from foreign investment. A higher growth rate can lead to more overseas investment, pushing up demand for the Rupee. A less negative balance of trade will eventually lead to a stronger Rupee. Higher interest rates, especially real rates (interest rates less inflation) are also positive for the Rupee. A risk-on environment can lead to greater inflows of Foreign Direct and Indirect Investment (FDI and FII), which also benefit the Rupee.

    Higher inflation, particularly, if it is comparatively higher than India’s peers, is generally negative for the currency as it reflects devaluation through oversupply. Inflation also increases the cost of exports, leading to more Rupees being sold to purchase foreign imports, which is Rupee-negative. At the same time, higher inflation usually leads to the Reserve Bank of India (RBI) raising interest rates and this can be positive for the Rupee, due to increased demand from international investors. The opposite effect is true of lower inflation.


    Source link

  • USD/CAD weakens to near 1.4300 as Trump delays tariffs policy

    USD/CAD weakens to near 1.4300 as Trump delays tariffs policy


    • USD/CAD softens to around 1.4300 in Tuesday’s early Asian session.
    • Trump did not impose tariffs on US trading partners on his first day in the White House.
    • BoC’s latest Business Outlook Survey suggested that the overall economic sentiment remains subdued.

    The USD/CAD pair remains on the defensive around 1.4300 during the early Asian session on Tuesday, pressured by the weakening of the US Dollar (USD). The Greenback trades in choppy trading as traders await further details on President-elect Donald Trump’s economic plans, including tariff policies. 

    Bloomberg reported on Monday that Trump will not announce tariffs immediately after his inauguration on Monday but will call federal agencies to study tariff policy and the United States’ trade ties with Canada, Mexico, and China. The USD faced some selling pressure following this report. 

    The US Federal Reserve (Fed) is anticipated to hold its benchmark overnight rate steady in the 4.25%-4.50% range at its January meeting. However, investors expect Trump’s policies could fuel inflation pressures, which may only allow the Fed to cut rates once more. This, in turn, might help limit the USD’s losses in the near term. 

    On the Loonie front, the Bank of Canada’s (BoC) Business Outlook Survey showed Canadian firms see improved demand and sales in the coming year, fuelled by rate cuts, but are concerned about the potential risks from promised US trade policies from Trump’s administration. Meanwhile, the decline in crude oil prices might drag the commodity-linked Canadian Dollar (CAD) lower. Canada is the largest oil exporter to the US, and lower crude oil prices tend to have a negative impact on the CAD value.

    Canadian Dollar FAQs

    The key factors driving the Canadian Dollar (CAD) are the level of interest rates set by the Bank of Canada (BoC), the price of Oil, Canada’s largest export, the health of its economy, inflation and the Trade Balance, which is the difference between the value of Canada’s exports versus its imports. Other factors include market sentiment – whether investors are taking on more risky assets (risk-on) or seeking safe-havens (risk-off) – with risk-on being CAD-positive. As its largest trading partner, the health of the US economy is also a key factor influencing the Canadian Dollar.

    The Bank of Canada (BoC) has a significant influence on the Canadian Dollar by setting the level of interest rates that banks can lend to one another. This influences the level of interest rates for everyone. The main goal of the BoC is to maintain inflation at 1-3% by adjusting interest rates up or down. Relatively higher interest rates tend to be positive for the CAD. The Bank of Canada can also use quantitative easing and tightening to influence credit conditions, with the former CAD-negative and the latter CAD-positive.

    The price of Oil is a key factor impacting the value of the Canadian Dollar. Petroleum is Canada’s biggest export, so Oil price tends to have an immediate impact on the CAD value. Generally, if Oil price rises CAD also goes up, as aggregate demand for the currency increases. The opposite is the case if the price of Oil falls. Higher Oil prices also tend to result in a greater likelihood of a positive Trade Balance, which is also supportive of the CAD.

    While inflation had always traditionally been thought of as a negative factor for a currency since it lowers the value of money, the opposite has actually been the case in modern times with the relaxation of cross-border capital controls. Higher inflation tends to lead central banks to put up interest rates which attracts more capital inflows from global investors seeking a lucrative place to keep their money. This increases demand for the local currency, which in Canada’s case is the Canadian Dollar.

    Macroeconomic data releases gauge the health of the economy and can have an impact on the Canadian Dollar. Indicators such as GDP, Manufacturing and Services PMIs, employment, and consumer sentiment surveys can all influence the direction of the CAD. A strong economy is good for the Canadian Dollar. Not only does it attract more foreign investment but it may encourage the Bank of Canada to put up interest rates, leading to a stronger currency. If economic data is weak, however, the CAD is likely to fall.


    Source link

  • Australian Dollar holds gains as China GDP rises in previous quarter

    Australian Dollar holds gains as China GDP rises in previous quarter


    • The Australian Dollar appreciates after the release of economic figures from China.
    • China’s GDP grew 5.4% YoY in Q4 of 2024 after reporting a 4.6% expansion in Q3.
    • US Retail Sales increased by 0.4% MoM in December, against the expected 0.6% growth.

    The Australian Dollar (AUD) edges higher against the US Dollar (USD) following the economic data from China released on Friday. China’s economy grew 5.4% over the year in the fourth quarter of 2024 after reporting a 4.6% expansion in the third quarter. Data beat the market consensus of 5% in the reported period, by a wide margin.

    Chinese Gross Domestic Product (GDP) rate rose 1.6% QoQ in Q4 2024, having increased 0.9% in the previous quarter. This figure matched the expectations of 1.6%. The annual December Retail Sales increased by 3.7% vs. the 3.5% expected and 3.0% prior, while Industrial Production arrived at 6.2% vs. the 5.4% forecast and November’s 5.4%.

    The National Bureau of Statistics (NBS) shared its outlook on the economy during a press conference on Friday. The NBS highlighted that economic operations continue to face significant difficulties and challenges. It noted that the impact of changes in the external environment is intensifying, while domestic demand remains insufficient.

    Australia’s seasonally adjusted Unemployment Rate rose to 4.0% in December, compared to 3.9% in November, aligning with market expectations. Employment increased by 56.3K in December, up from 28.2K in November (revised from 35.6K) and significantly exceeding the market forecast of 15.0K.

    Bjorn Jarvis, head of labor statistics at the ABS, highlighted key data points: “The employment-to-population ratio rose 0.1% percentage points to a new record of 64.5%. This was 0.5 percentage points higher than a year ago and 2.3 percentage points above pre-COVID-19 levels. The increase in both employment and unemployment led to a further rise in the participation rate, which reflects the proportion of the population either employed or actively seeking work.”

    Australian Dollar advances as US Dollar remains subdued amid weaker US Retail Sales data

    • The US Dollar Index (DXY), which measures the US Dollar’s performance against six major currencies, trades near 109.00. The Greenback edges lower after the weaker US Retail Sales data.
    • US Retail Sales rose by 0.4% MoM in December, reaching $729.2 billion. This reading was weaker than the market expectations of a 0.6% rise and lower than the previous reading of a 0.8% increase (revised from 0.7%).
    • Chicago Federal Reserve Bank President Austan Goolsbee stated on Thursday that he has grown increasingly confident over the past several months that the job market is stabilizing at a level resembling full employment, rather than deteriorating into something worse, according to Reuters.
    • The US Consumer Price Index increased by 2.9% year-over-year in December, up from 2.7% in November, aligning with market expectations. Monthly, CPI rose 0.4%, following a 0.3% increase in the previous month.
    • US Core CPI, which excludes volatile food and energy prices, rose 3.2% annually in December, slightly below November’s figure and analysts’ forecasts of 3.3%. Monthly, core CPI edged up 0.2% in December 2024.
    • US Producer Price Index for final demand rose 0.2% MoM in December after an unrevised 0.4% advance in November, softer than the 0.3% expected. The PPI climbed 3.3% YoY in December, the most since February 2023, after increasing 3.0% in November. This reading came in below the consensus of 3.4%.
    • On Wednesday, Scott Bessent, Donald Trump’s nominee for Treasury Secretary, emphasized the importance of maintaining the US Dollar as the world’s reserve currency for the nation’s economic stability and future prosperity. Bessent stated “Productive investment that grows the economy must be prioritized over wasteful spending that drives inflation,” per Bloomberg.
    • The Federal Reserve reported in its latest Beige Book survey, released on Wednesday, that economic activity saw slight to moderate growth across the twelve Federal Reserve Districts in late November and December. Consumer spending increased moderately, driven by strong holiday sales that surpassed expectations. However, manufacturing activity experienced a slight decline overall, as some manufacturers stockpiled inventories in anticipation of higher tariffs.

    Technical Analysis: Australian Dollar remains above 0.6200 support near 14-day EMA

    The AUD/USD pair trades near 0.6220 on Friday, attempting to break above the descending channel on the daily chart. A successful breakout would weaken the prevailing bearish bias. The 14-day Relative Strength Index (RSI) also trends upward toward the 50 level, signaling potential recovery momentum.

    The AUD/USD pair encounters immediate resistance at the upper boundary of the descending channel, approximately at 0.6220.

    On the downside, initial support is seen at the 14-day Exponential Moving Average (EMA) at 0.6213, followed by the nine-day EMA at 0.6206. A more substantial support level is located near the lower boundary of the descending channel, around the 0.5920 mark.

    AUD/USD: Daily Chart

    Australian Dollar PRICE Today

    The table below shows the percentage change of Australian Dollar (AUD) against listed major currencies today. Australian Dollar was the strongest against the Japanese Yen.

      USD EUR GBP JPY CAD AUD NZD CHF
    USD   -0.05% -0.05% 0.12% 0.01% -0.03% -0.07% -0.04%
    EUR 0.05%   -0.01% 0.19% 0.06% 0.01% -0.02% 0.00%
    GBP 0.05% 0.01%   0.17% 0.07% 0.03% -0.01% 0.01%
    JPY -0.12% -0.19% -0.17%   -0.10% -0.16% -0.21% -0.18%
    CAD -0.01% -0.06% -0.07% 0.10%   -0.05% -0.08% -0.06%
    AUD 0.03% -0.01% -0.03% 0.16% 0.05%   -0.04% -0.02%
    NZD 0.07% 0.02% 0.01% 0.21% 0.08% 0.04%   0.03%
    CHF 0.04% -0.00% -0.01% 0.18% 0.06% 0.02% -0.03%  

    The heat map shows percentage changes of major currencies against each other. The base currency is picked from the left column, while the quote currency is picked from the top row. For example, if you pick the Australian Dollar from the left column and move along the horizontal line to the US Dollar, the percentage change displayed in the box will represent AUD (base)/USD (quote).

    Economic Indicator

    Gross Domestic Product (YoY)

    The Gross Domestic Product (GDP), released by the National Bureau of Statistics of China on a monthly basis, is a measure of the total value of all goods and services produced in China during a given period. The GDP is considered as the main measure of China’s economic activity. The YoY reading compares economic activity in the reference quarter compared with the same quarter a year earlier. Generally speaking, a rise in this indicator is bullish for the Renminbi (CNY), while a low reading is seen as bearish.

    Read more.

    Last release: Fri Jan 17, 2025 02:00

    Frequency: Quarterly

    Actual: 5.4%

    Consensus: 5%

    Previous: 4.6%

    Source:


    Source link

  • XAU/USD loses ground below ,700 amid firmer US Dollar

    XAU/USD loses ground below $2,700 amid firmer US Dollar


    • Gold price loses ground to around $2,690 in Monday’s early Asian session.
    • The upbeat US job report and surging USD weigh on the Gold price. 
    • Trump’s policy uncertainty and geopolitical risks might cap the downside for the precious metal.

    Gold price (XAU/USD) trades with mild losses near $2,690 on the stronger US Dollar (USD) broadly during the early Asian session on Monday. However, the safe-haven demand due to uncertainty surrounding the President-elect Donald Trump administration’s policies might help limit the Gold’s losses. 

    The stronger-than-expected US employment data on Friday reinforced expectations that the US Federal Reserve (Fed) might not cut interest rates as aggressively this year. This, in turn, weighs on the non-yielding asset. Traders expect the Fed to cut interest rates by just 30 basis points (bps) over the course of this year, compared with cuts worth about 45 bps before the NFP report. 

    On the other hand, Trump’s policy risks boosting the Gold price, a traditional safe-haven asset. “Gold is still acting resilient in the face of a much stronger-than-expected jobs report … One of the factors that’s been supporting gold is this uncertainty that we’ve seen going into the (U.S. presidential) inauguration,” said David Meger, director of metals trading at High Ridge Futures.

    Additionally, the escalating geopolitical tensions in the Middle East and the ongoing Russia-Ukraine conflict might contribute to the precious metal downside. Israeli strikes continued throughout Gaza, including attacks near Gaza City, Nuseirat, and Bureij. Two attacks were also reported in the Houmin Valley in southern Lebanon, according to Lebanon’s National News Agency.

    Gold FAQs

    Gold has played a key role in human’s history as it has been widely used as a store of value and medium of exchange. Currently, apart from its shine and usage for jewelry, the precious metal is widely seen as a safe-haven asset, meaning that it is considered a good investment during turbulent times. Gold is also widely seen as a hedge against inflation and against depreciating currencies as it doesn’t rely on any specific issuer or government.

    Central banks are the biggest Gold holders. In their aim to support their currencies in turbulent times, central banks tend to diversify their reserves and buy Gold to improve the perceived strength of the economy and the currency. High Gold reserves can be a source of trust for a country’s solvency. Central banks added 1,136 tonnes of Gold worth around $70 billion to their reserves in 2022, according to data from the World Gold Council. This is the highest yearly purchase since records began. Central banks from emerging economies such as China, India and Turkey are quickly increasing their Gold reserves.

    Gold has an inverse correlation with the US Dollar and US Treasuries, which are both major reserve and safe-haven assets. When the Dollar depreciates, Gold tends to rise, enabling investors and central banks to diversify their assets in turbulent times. Gold is also inversely correlated with risk assets. A rally in the stock market tends to weaken Gold price, while sell-offs in riskier markets tend to favor the precious metal.

    The price can move due to a wide range of factors. Geopolitical instability or fears of a deep recession can quickly make Gold price escalate due to its safe-haven status. As a yield-less asset, Gold tends to rise with lower interest rates, while higher cost of money usually weighs down on the yellow metal. Still, most moves depend on how the US Dollar (USD) behaves as the asset is priced in dollars (XAU/USD). A strong Dollar tends to keep the price of Gold controlled, whereas a weaker Dollar is likely to push Gold prices up.


    Source link

  • Australian Dollar holds steady as US Dollar remains firm ahead of FOMC Minutes


    • The Australian Dollar depreciated as Australia’s trimmed mean fell to an annual 3.2% from 3.5%.
    • Australia’s monthly Consumer Price Index increased by 2.3% YoY in November, the highest level recorded since August.
    • The US Dollar appreciated as the 10-year yield on US Treasury bonds rose by over 1% on Tuesday.

    The Australian Dollar (AUD) faced challenges for the second consecutive session against the US Dollar (USD), with the AUD/USD pair holding losses despite stronger-than-expected monthly inflation data released on Wednesday. Traders are now focused on the upcoming FOMC Minutes, scheduled for release later in the day, as well as the US jobs data, including the Nonfarm Payroll (NFP) report on Friday, for additional insights into policy direction.

    However, the trimmed mean, a closely watched measure of core inflation, fell to an annual 3.2% from 3.5%, edging closer to the Reserve Bank of Australia’s (RBA) target band of 2% to 3%. Traders are currently pricing in a 55% probability that the RBA will lower its cash rate by 25 basis points to 4.35% in February, with a full quarter-point cut expected by April.

    Australia’s monthly Consumer Price Index (CPI) rose 2.3% year-over-year in November, surpassing the market forecast of 2.2% and marking an increase from the 2.1% rise seen in the previous two months. This is the highest reading since August. However, the figure remains within the RBA’s target range of 2–3% for the fourth consecutive month, aided by the ongoing impact of the Energy Bill Relief Fund rebate.

    The Australian Bureau of Statistics reported on Tuesday that permits for new construction projects in Australia dropped by 3.6% month-on-month to 14,998 units in November 2024, falling short of market expectations for a 1.0% decline. This downturn followed an upwardly revised 5.2% increase in October, marking the first decrease in three months.

    The People’s Bank of China (PBoC) is collaborating with the State Planner to bolster the country’s economy. PBoC official Peng Lifeng announced that the central bank will assist banks in expanding loans under the trade-in initiative.

    Australian Dollar declines due to hawkish shift in Fed’s rate trajectory

    • The US Dollar Index (DXY), which measures the US Dollar’s (USD) performance against six major currencies, holds its position above 108.50 at the time of writing.
    • The US Dollar strengthened as the 10-year yield on US Treasury bonds rose by over 1% in the previous session, currently standing at 4.67%. This spike is a stark reminder of the shifting investor sentiment regarding the Federal Reserve’s interest rate trajectory.
    • The US ISM Services PMI increased to 54.1 in November, up from 52.1, exceeding the market expectation of 53.3. The Prices Paid Index, which reflects inflation, rose significantly to 64.4 from 58.2, while the Employment Index dipped slightly to 51.4 from 51.5.
    • The US ISM Manufacturing PMI improved to 49.3 in December, from 48.4 in November. This reading came in better than the market expectation of 48.4.
    • According to Bloomberg, Federal Reserve Bank of Atlanta President Raphael Bostic stated on Tuesday that Fed officials should exercise caution with policy decisions due to uneven progress in reducing inflation. Bostic emphasized the need to lean toward keeping interest rates elevated to ensure the achievement of price stability goals.
    • Richmond Fed President Thomas Barkin highlighted on Friday that the benchmark policy rate should remain restrictive until there is greater confidence that inflation will return to the 2% target.
    • Fed Governor Adriana Kugler and San Francisco Fed President Mary Daly underscored the challenging balancing act facing US central bankers as they aim to slow the pace of monetary easing this year.
    • Traders are cautious regarding President-elect Trump’s economic policies, fearing that tariffs could increase the cost of living. These concerns were compounded by the Federal Open Market Committee’s (FOMC) recent projections, which indicated fewer rate cuts in 2025, reflecting caution amid persistent inflationary pressures.

    Technical Analysis: Australian Dollar moves below nine-day EMA toward 0.6200

    AUD/USD trades near 0.6210 on Wednesday, maintaining its bearish outlook as it remains confined within a descending channel on the daily chart. The 14-day Relative Strength Index (RSI) retreats toward the 30 level, signaling a potential intensification of bearish momentum.

    On the downside, the AUD/USD pair may navigate the region around the lower boundary of the descending channel, at the 0.5990 level.

    The AUD/USD pair may test the immediate resistance around the nine-day Exponential Moving Average (EMA) at 0.6224, followed by the 14-day EMA at 0.6239. A further barrier appears around the upper boundary of the descending channel, at 0.6270 level.

    AUD/USD: Daily Chart

    Australian Dollar PRICE Today

    The table below shows the percentage change of Australian Dollar (AUD) against listed major currencies today. Australian Dollar was the strongest against the Japanese Yen.

      USD EUR GBP JPY CAD AUD NZD CHF
    USD   -0.06% -0.02% 0.22% -0.06% 0.00% 0.03% -0.00%
    EUR 0.06%   0.04% 0.26% -0.01% 0.06% 0.09% 0.05%
    GBP 0.02% -0.04%   0.26% -0.05% 0.02% 0.05% 0.01%
    JPY -0.22% -0.26% -0.26%   -0.28% -0.21% -0.19% -0.22%
    CAD 0.06% 0.00% 0.05% 0.28%   0.07% 0.10% 0.06%
    AUD -0.01% -0.06% -0.02% 0.21% -0.07%   0.03% -0.01%
    NZD -0.03% -0.09% -0.05% 0.19% -0.10% -0.03%   -0.04%
    CHF 0.00% -0.05% -0.01% 0.22% -0.06% 0.00% 0.04%  

    The heat map shows percentage changes of major currencies against each other. The base currency is picked from the left column, while the quote currency is picked from the top row. For example, if you pick the Australian Dollar from the left column and move along the horizontal line to the US Dollar, the percentage change displayed in the box will represent AUD (base)/USD (quote).

    Economic Indicator

    FOMC Minutes

    FOMC stands for The Federal Open Market Committee that organizes 8 meetings in a year and reviews economic and financial conditions, determines the appropriate stance of monetary policy and assesses the risks to its long-run goals of price stability and sustainable economic growth. FOMC Minutes are released by the Board of Governors of the Federal Reserve and are a clear guide to the future US interest rate policy.

    Read more.

    Next release: Wed Jan 08, 2025 19:00

    Frequency: Irregular

    Consensus:

    Previous:

    Source: Federal Reserve


    Source link

  • WTI rises above $74.00 on larger drop in US crude oil inventories, hopes for China’s demand


    • WTI price gains traction to near $74.15 in Wednesday’s Asian session.
    • US crude oil inventories fell by 4.022 million barrels last week, according to the API. 
    • Oil traders brace for the FOMC Minutes on Wednesday ahead of the US December NFP report. 

    West Texas Intermediate (WTI), the US crude oil benchmark, is trading around $74.15 on Wednesday. The WTI price edges higher amid expected higher Chinese demand and a larger drop in US crude stocks. 

    A large drop in US crude inventories last week provides some support to the WTI. The API weekly report showed crude oil stockpiles in the United States for the week ending January 3 fell by 4.022 million barrels, compared to a decline of 1.442 million barrels in the previous week. The market consensus estimated that stocks would decrease by 250,000 barrels. Furthermore, the escalating geopolitical tensions in the Middle East and ongoing Russia-Ukraine conflicts could boost the WTI price in the near term. 

    On Tuesday, the National Development and Reform Commission (NDRC), China’s top economic planner, issued a guideline for building a unified national market, breaking down market barriers to boost domestic demand while enhancing openness. The positive development surrounding the Chinese stimulus measure could boost the black gold price as China is the world’s second-largest economy. 

    ”While the market is currently range-bound, it is recording gains on the back of improved demand expectations fuelled by holiday traffic and China’s economic pledges,” Hilal said in a morning note. “However, the primary trend remains bearish.”

    Looking ahead, Oil traders will keep an eye on the Minutes of the Federal Open Market Committee (FOMC), which is due later on Wednesday. On Friday, the US employment data for December will be in the spotlight. Economists expect 154,000 new jobs for December, while the unemployment rate is expected to remain at 4.2% during the same report period. In case of a stronger-than-expecetd outcome, this could lift the Greenback and weigh on the USD-denominated commodity price in the near term. 

    Gold FAQs

    Gold has played a key role in human’s history as it has been widely used as a store of value and medium of exchange. Currently, apart from its shine and usage for jewelry, the precious metal is widely seen as a safe-haven asset, meaning that it is considered a good investment during turbulent times. Gold is also widely seen as a hedge against inflation and against depreciating currencies as it doesn’t rely on any specific issuer or government.

    Central banks are the biggest Gold holders. In their aim to support their currencies in turbulent times, central banks tend to diversify their reserves and buy Gold to improve the perceived strength of the economy and the currency. High Gold reserves can be a source of trust for a country’s solvency. Central banks added 1,136 tonnes of Gold worth around $70 billion to their reserves in 2022, according to data from the World Gold Council. This is the highest yearly purchase since records began. Central banks from emerging economies such as China, India and Turkey are quickly increasing their Gold reserves.

    Gold has an inverse correlation with the US Dollar and US Treasuries, which are both major reserve and safe-haven assets. When the Dollar depreciates, Gold tends to rise, enabling investors and central banks to diversify their assets in turbulent times. Gold is also inversely correlated with risk assets. A rally in the stock market tends to weaken Gold price, while sell-offs in riskier markets tend to favor the precious metal.

    The price can move due to a wide range of factors. Geopolitical instability or fears of a deep recession can quickly make Gold price escalate due to its safe-haven status. As a yield-less asset, Gold tends to rise with lower interest rates, while higher cost of money usually weighs down on the yellow metal. Still, most moves depend on how the US Dollar (USD) behaves as the asset is priced in dollars (XAU/USD). A strong Dollar tends to keep the price of Gold controlled, whereas a weaker Dollar is likely to push Gold prices up.


    Source link

  • NZD/USD softens below 0.5650 on stronger US economic data


    • NZD/USD softens to around 0.5635 in Wednesday’s early Asian session. 
    • The stronger US data suggested the Fed is likely to slow the easing cycle. 
    • Investors will monitor how aggressive Trump’s tariff plans could be when he takes office.

    The NZD/USD pair trades with mild losses near 0.5635 during the early Asian session on Wednesday. The upbeat US Services Purchasing Managers Index (PMI) for December suggested that the Federal Reserve (Fed) will likely slow the pace of its easing cycle, supporting the US Dollar (USD). Later on Wednesday, the Minutes of the Federal Open Market Committee (FOMC) will be in the spotlight. 

    The services sector activity in the United States accelerated in December. Data released by the Institute for Supply Management (ISM) showed that Services PMI increased to 54.1 in December from 52.1 in November. This reading came in stronger than the estimation of 53.3. 

    Meanwhile, US job openings unexpectedly increased in November, although hiring slowed during the month. US JOLTS Job Openings rose to 8.09 million in November versus 7.83 million prior and came in above the market consensus of 7.7 million.

    The reports indicated a generally stable jobs market and a still robust services sector, which might convince the Fed to slow the pace of rate cuts, lifting the Greenback. According to the CME FedWatch tool, the US rate futures market has priced in a 93.5% chance of a pause in rate cuts this month. 

    Investors will monitor how aggressive President-elect Donald Trump’s tariff policies could be when he takes office. Analysts believe that if US tariffs are broadly lower than Trump promised on the campaign trail and aimed only at “critical” sectors, then the outlook for global growth should improve and the USD should weaken. Additionally, the supportive measures from China could boost the Kiwi as China is a major trading partner for New Zealand. 

    New Zealand Dollar FAQs

    The New Zealand Dollar (NZD), also known as the Kiwi, is a well-known traded currency among investors. Its value is broadly determined by the health of the New Zealand economy and the country’s central bank policy. Still, there are some unique particularities that also can make NZD move. The performance of the Chinese economy tends to move the Kiwi because China is New Zealand’s biggest trading partner. Bad news for the Chinese economy likely means less New Zealand exports to the country, hitting the economy and thus its currency. Another factor moving NZD is dairy prices as the dairy industry is New Zealand’s main export. High dairy prices boost export income, contributing positively to the economy and thus to the NZD.

    The Reserve Bank of New Zealand (RBNZ) aims to achieve and maintain an inflation rate between 1% and 3% over the medium term, with a focus to keep it near the 2% mid-point. To this end, the bank sets an appropriate level of interest rates. When inflation is too high, the RBNZ will increase interest rates to cool the economy, but the move will also make bond yields higher, increasing investors’ appeal to invest in the country and thus boosting NZD. On the contrary, lower interest rates tend to weaken NZD. The so-called rate differential, or how rates in New Zealand are or are expected to be compared to the ones set by the US Federal Reserve, can also play a key role in moving the NZD/USD pair.

    Macroeconomic data releases in New Zealand are key to assess the state of the economy and can impact the New Zealand Dollar’s (NZD) valuation. A strong economy, based on high economic growth, low unemployment and high confidence is good for NZD. High economic growth attracts foreign investment and may encourage the Reserve Bank of New Zealand to increase interest rates, if this economic strength comes together with elevated inflation. Conversely, if economic data is weak, NZD is likely to depreciate.

    The New Zealand Dollar (NZD) tends to strengthen during risk-on periods, or when investors perceive that broader market risks are low and are optimistic about growth. This tends to lead to a more favorable outlook for commodities and so-called ‘commodity currencies’ such as the Kiwi. Conversely, NZD tends to weaken at times of market turbulence or economic uncertainty as investors tend to sell higher-risk assets and flee to the more-stable safe havens.


    Source link