Asia-Pacific equities slumped today after Israel launched a military strike on Iran, targeting nuclear facilities and escalating geopolitical tensions in the region. The strike, which came without US support, was followed by a sharp vow of retaliation from Tehran. The immediate reaction saw oil prices spike nearly 9%, as traders rushed to price in potential supply disruptions across the Middle East. The risk-off mood gripped markets across asset classes, dragging equities lower and boosting safe havens.
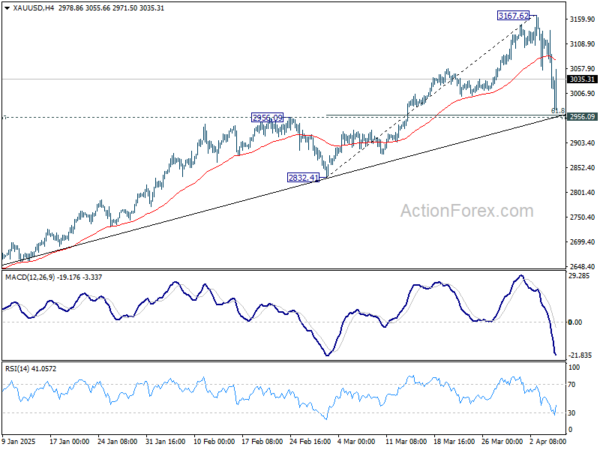
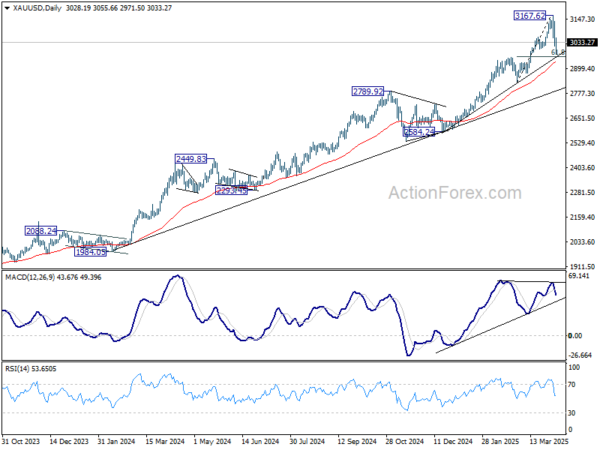
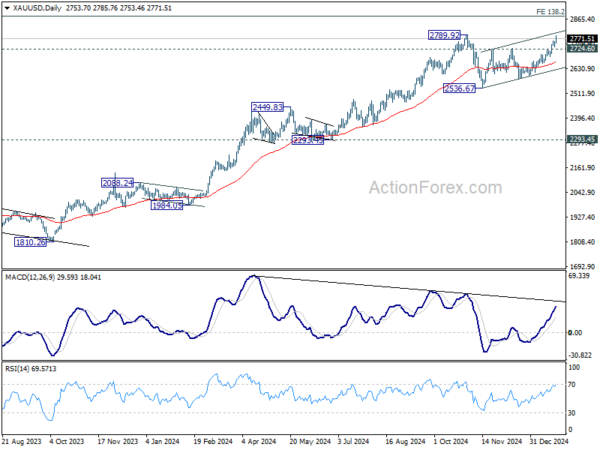
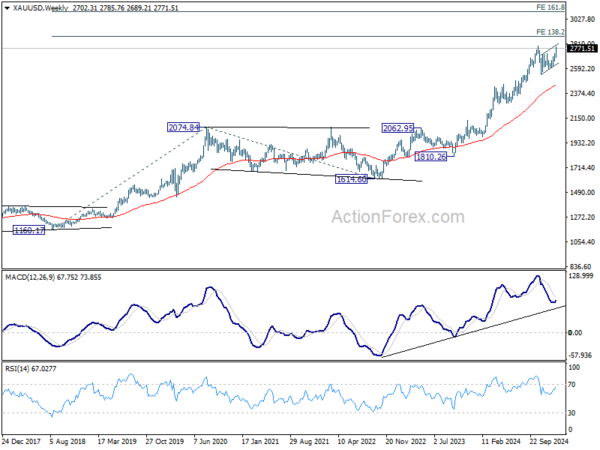
Gold, Swiss Franc, and Yen all climbed as investors sought shelter from the rising uncertainty. Meanwhile, Dollar also found some renewed strength as it recovered, after broader weakness earlier in the week triggered by softer-than-expected inflation data and rising odds of a September Fed rate cut.
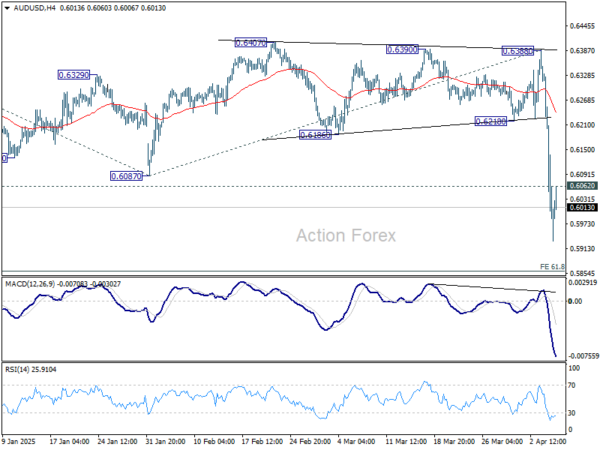
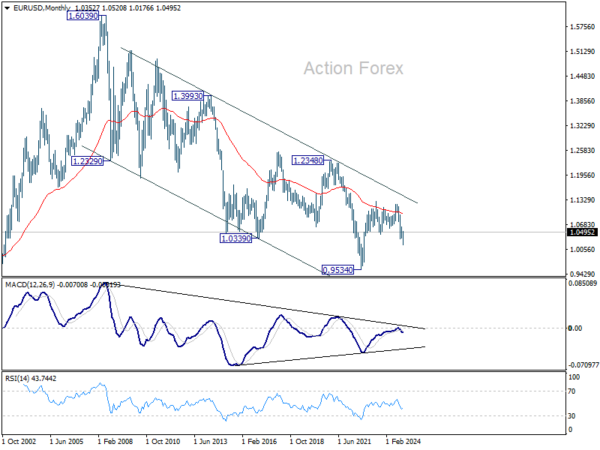
On the other hand, Kiwi led the declines, pressured by both heightened risk aversion and a sharp contraction in local manufacturing activity. Kiwi was followed closely by Aussie and Sterling. Loonie managed to hold mid-pack, underpinned partially by the surge in oil prices. Euro also traded with relative calm, despite the Middle East tensions, as ECB’s message this week has helped anchor expectations that easing cycle may be drawing to a close.
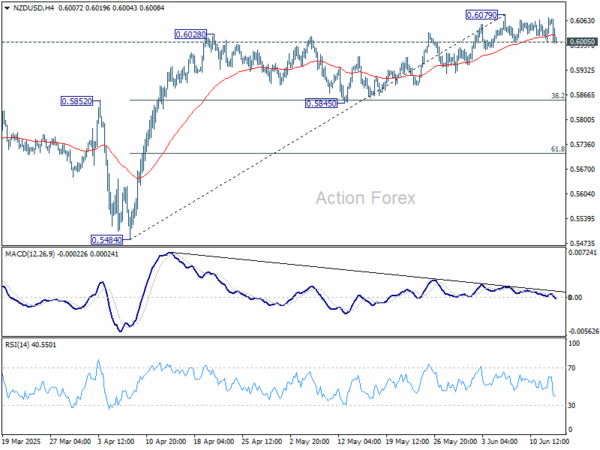
Technically, NZD/USD’s upside momentum has been rather week with the choppy rise from 0.5845. Firm break of 0.6005 support should confirm short term topping. It would be a bit early to conclude the that rally from 0.5484 has completed. But even as correction, fall from 0.6079 would extend to 0.5845 cluster support (38.2% retracement of 0.5484 to 0.6079 at 0.5852).
In Asia, at the time of writing, Nikkei is down -1.15%. Hong Kong HSI is down -0.98%. China Shanghai SSE is down -0.83%. Singapore Strait Times is down -0.45%. Japan 10-year JGB yield is down -0.05 at 1.41. Overnight, DOW rose 0.24%. S&P 500 rose 0.38%. NASDAQ rose 0.24%. 10-year yield fell -0.055 to 4.357.
Looking ahead, Eurozone industrial production and trade balance are the main features in European session. Later in the day, Canada will release manufacturing sales and wholesale sales. US will publish U of Michigan consumer sentiment.
NZ BNZ manufacturing fall to 47.5, slumps back into contraction
New Zealand’s manufacturing sector slipped sharply back into contraction in May, with the BusinessNZ Performance of Manufacturing Index plunging from 53.3 to 47.5. The reading not only marks a decisive reversal from April’s expansion but also sits well below the historical average of 52.5.
Key components of the index showed broad-based weakness: production dropped from 53.0 to 48.7, employment tumbled from 54.6 to 45.7, and new orders fell sharply from 50.8 to 45.3—all signaling deteriorating activity across the sector.
The sharp decline was echoed in business sentiment, with 64.5% of survey respondents offering negative comments—up from 58% in April. The commentary reflects a growing sense of pessimism as manufacturers grapple with falling demand, weak forward orders, and subdued consumer spending. Rising input costs, ongoing economic uncertainty, and stalled investment plans are compounding pressures.
BNZ’s Senior Economist Doug Steel said that “the New Zealand economy can claw its way forward over the course of 2025, but the PMI is yet another indicator that suggests an increased risk that the bounce in GDP reported for Q4, 2024 and Q1, 2025 could come to a grinding halt”.
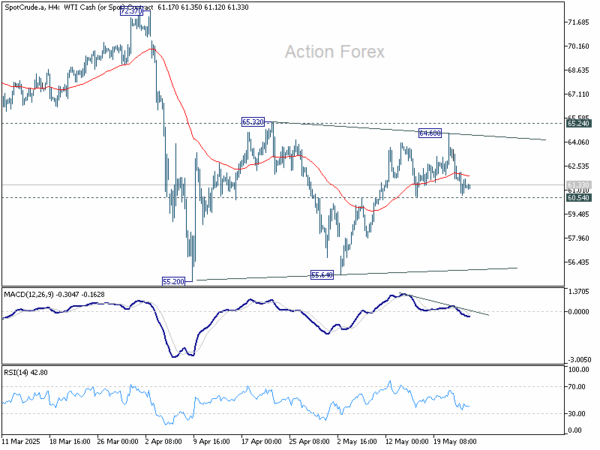
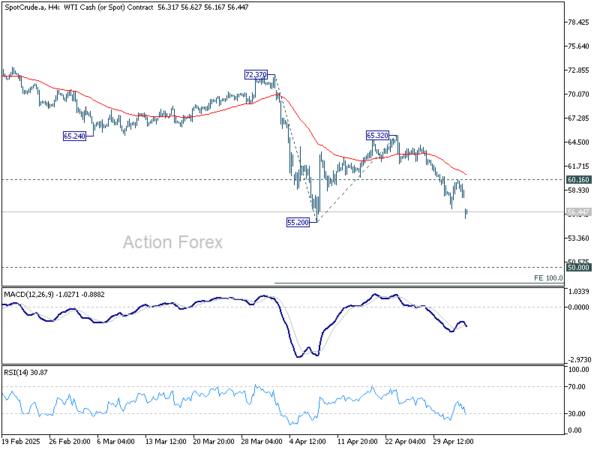
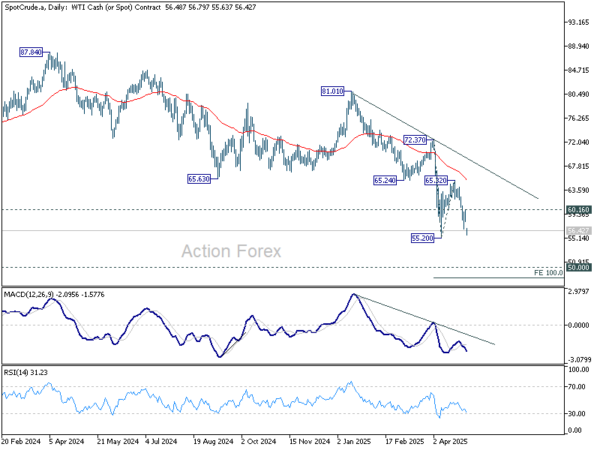
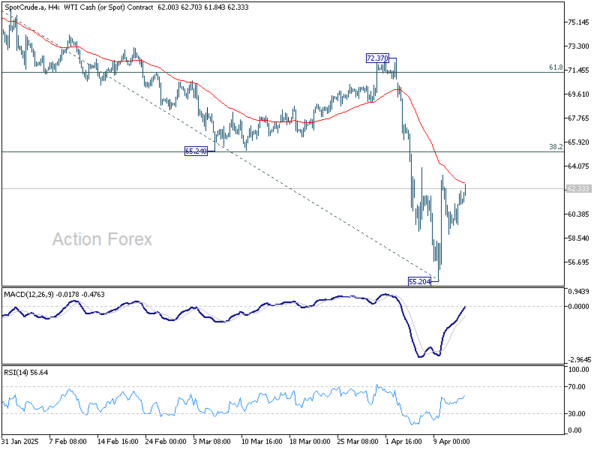
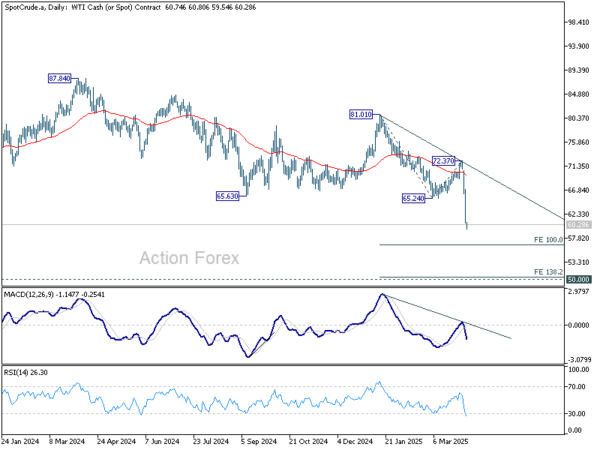
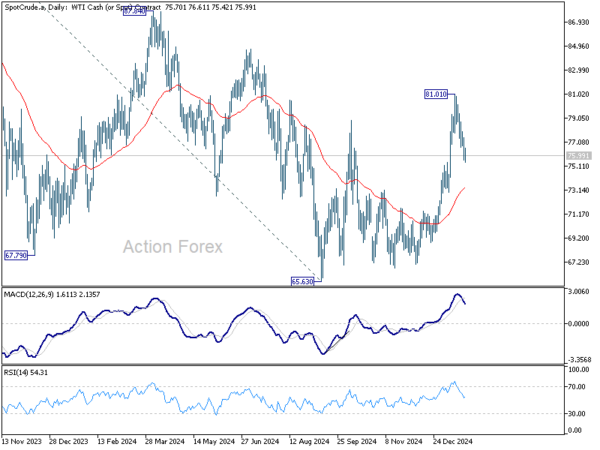
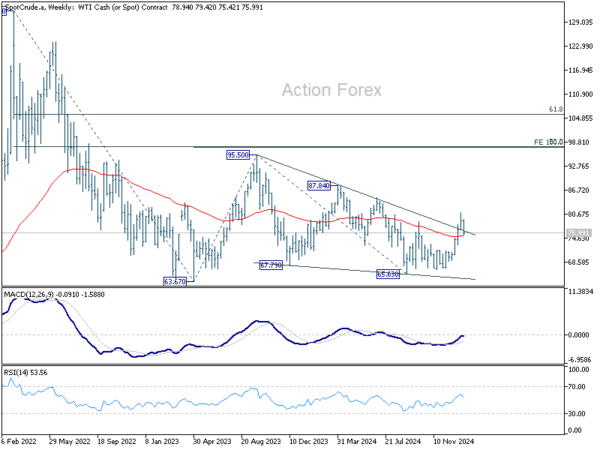
WTI oil soars on Israel-Iran escalation, but resistance looms near 78
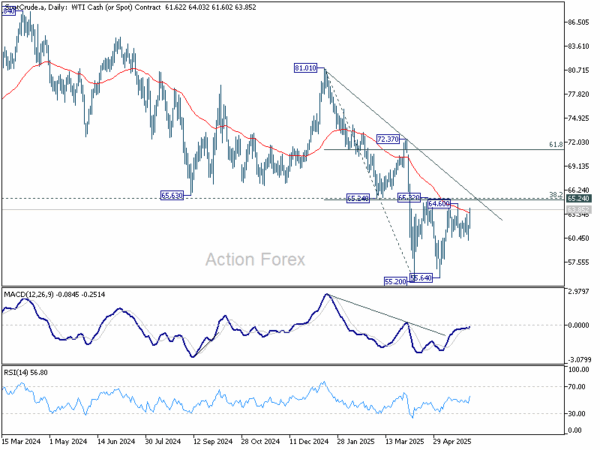
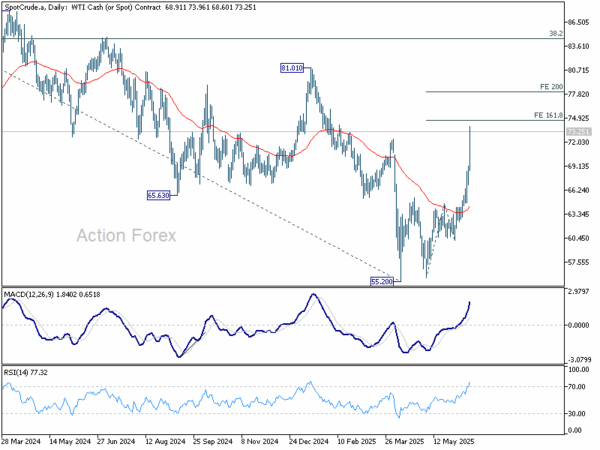
Crude oil prices surged sharply following news that Israel had launched direct airstrikes against Iran, targeting its nuclear and ballistic missile infrastructure. WTI crude is now trading more than 30% above its April low of 55.20, as geopolitical tensions in the Middle East reignite supply risk concerns.
Israeli Prime Minister Benjamin Netanyahu confirmed that the military had struck Iran’s Natanz enrichment site, leading nuclear scientists, and the core of its missile program, vowing to continue operations “for as many days as it takes to remove this threat.”
The military action was carried out without coordination with Washington. US Secretary of State Marco Rubio emphasized that Israel acted unilaterally and that the US was not involved in the strikes.
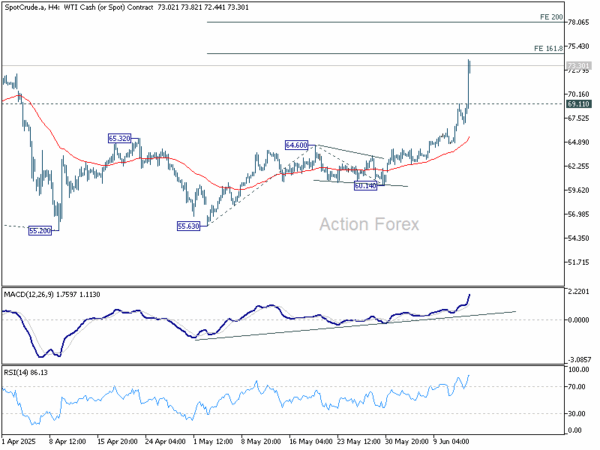
Technically, despite the sharp rally in WTI oil, strong resistance is expected between 74.65 and 78.08 to limit upside 161.8% projection of 55.63 to 64.60 from 60.14. at 74.65 and 200% projection at 78.08), on overbought condition. Break of 69.11 resistance turned support would indicate that the current buying wave has likely peaked.
Still, the path forward depends heavily on how geopolitical events unfold. Should the conflict escalate further or draw in regional actors, a break above the resistance zone could open the door to a test of 81.01, a level that marks the potential start of a broader bullish reversal in the longer-term oil trend.
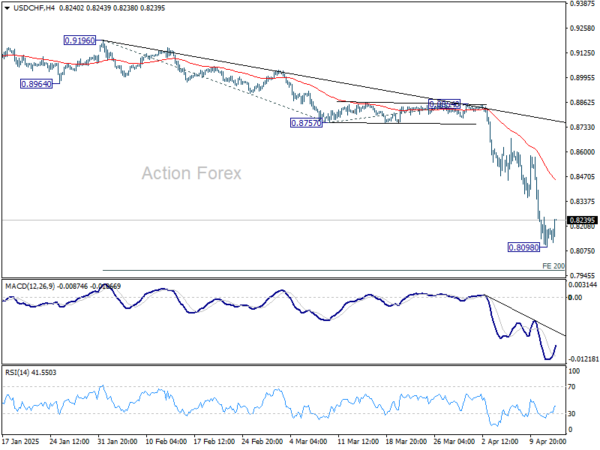
USD/CHF Daily Outlook
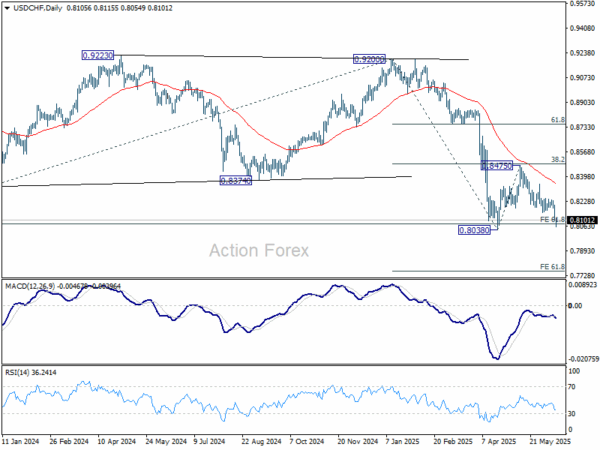
Daily Pivots: (S1) 0.8067; (P) 0.8138; (R1) 0.8174; More….
Intraday bias in USD/CHF remains on the downside, with immediate focus now on 0.8038 low. Strong support could be seen there to bring rebound, and above 0.816 support turned resistance will turn intraday bias neutral first. However, firm break of 0.8038 will resume larger down trend. Next target will be 61.8% projection of 0.9200 to 0.8038 from 0.8475 at 0.7757.
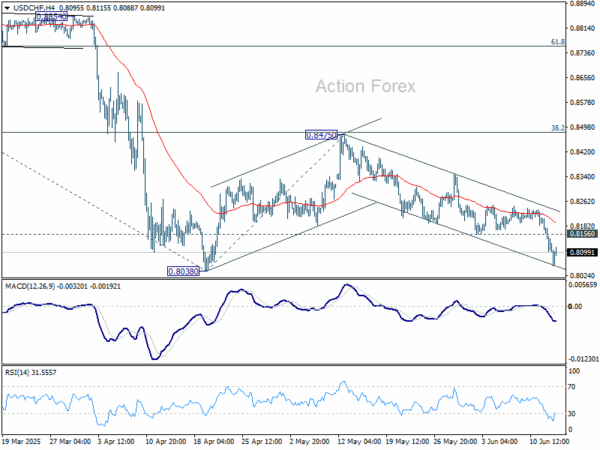
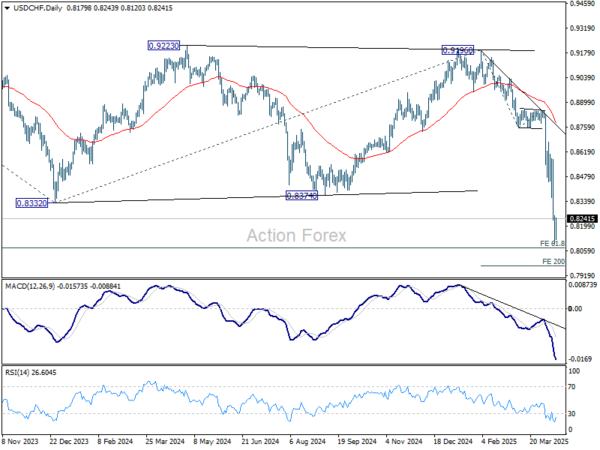
In the bigger picture, long term down trend from 1.0342 (2017 high) is still in progress and met 61.8% projection of 1.0146 (2022 high) to 0.8332 from 0.9200 at 0.8079 already. In any case, outlook will stay bearish as long as 55 W EMA (now at 0.8696) holds. Sustained break of 0.8079 will target 100% projection at 0.7382.