Tag: SEO

  • Gold surges past ,400 on Israel-Iran war risk, soft US inflation boosts safe-haven demand

    Gold surges past $3,400 on Israel-Iran war risk, soft US inflation boosts safe-haven demand


    • Bullion rallies to five-week high amid geopolitical tension and dovish Fed outlook
    • Israel strikes Iran, fueling fears of broader war and driving flight to safety into Gold.
    • XAU/USD hits $3,446 before easing on profit-taking; eyes next week’s Fed decision and US data slate.

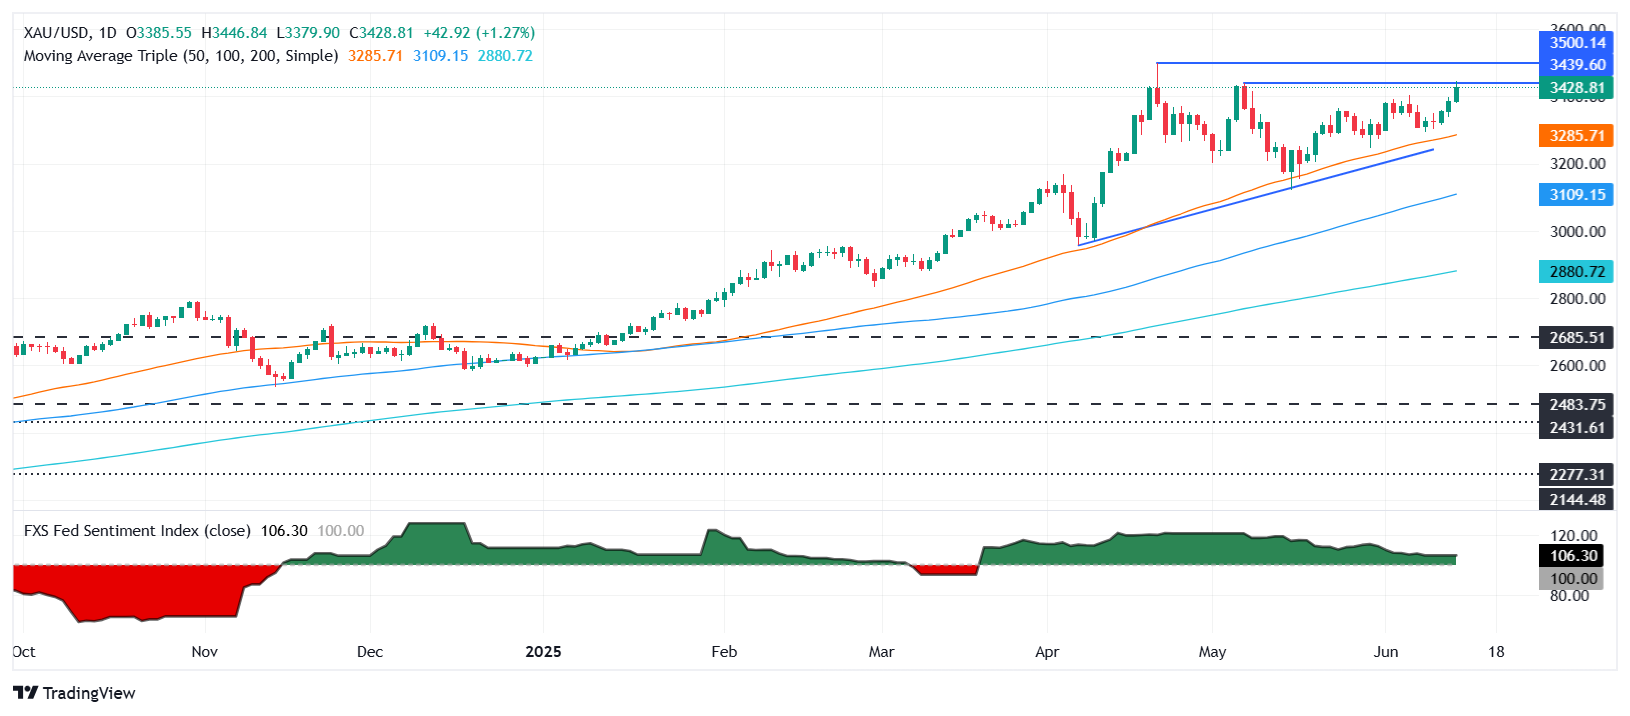
    Gold price rallied for the third consecutive day after the Israel-Iran conflict erupted on Friday, triggering a risk-off mood in financial markets as fears that it could escalate loom. At the time of writing, XAU/USD trades at $3,422, up more than 1%.

    Several factors underpin bullion. On Friday, Israel’s attack on Iran’s military installations, nuclear facilities and senior officials augmented tension in the area. After the attack,  XAU/USD reached a five-week high of $3,446 before retreating somewhat to its current levels as traders booked profits ahead of the weekend.

    Softer US CPI and PPI strengthen bets on Fed rate cuts despite improving consumer sentiment

    Another factor was that inflation in the United States (US) continued to ease following the release of the Consumer Price Index (CPI) and the Producer Price Index (PPI) figures for May. Recently, a University of Michigan (UoM) Consumer Sentiment survey revealed that households are becoming more optimistic about the economy, yet they remain worried about higher prices.

    US President Donald Trump hinted that Iran brought the attack on itself, as Washington warned Iran to restrict its nuclear program.

    Next week, traders will be watching the release of the Federal Reserve’s (Fed) monetary policy meeting, where officials will update their economic projections. Besides this, Retail Sales, Industrial Production, housing and jobs data could help dictate Gold’s direction.

    Daily digest market movers: Gold price surges on risk aversion

    • Recently, US President Trump said to Axios that Israel’s attack could help him reach an agreement with Iran. He urged Iran to make a deal, adding, “There has already been great death and destruction, but there is still time to make this slaughter, with the next already planned attacks being even more brutal, come to an end.”
    • The University of Michigan (UoM) Consumer Sentiment report in June showed that households are becoming more optimistic about the economy. The Sentiment Index rose from 52.2 to 60.5, while inflation expectations decreased for both one-year and five-year periods, from 6.6% to 5.1% and from 4.2% to 4.1%, respectively.
    • Although the data is positive and clears the path for the Federal Reserve to ease policy, the escalation of the Middle East conflict pushed Oil prices up by more than 6%. This suggests that Gasoline prices could increase, and that a reacceleration of inflation looms.
    • US Treasury yields are recovering, with the US 10-year Treasury yield climbing over seven basis points (bps) to 4.436%. US real yields followed suit, rising seven basis points to 2.186%, capping Bullion’s advance.
    • The Greenback rises after hitting three-year lows, according to the US Dollar Index (DXY). The DXY, which tracks the value of the Dollar against a basket of peers, is up 0.30% at 98.15 after hitting a multi-year low of 97.60.
    • Goldman Sachs reiterated that the price of Bullion would rise to $3,700 by the end of 2025 and $4,000 by mid-2026. Bank of America (BofA) sees Gold at $4,000 over the next 12 months.
    • Money markets suggest that traders are pricing in 47 basis points of easing toward the end of the year, according to Prime Market Terminal data.

    Source: Prime Market Terminal

    XAU/USD technical outlook: Gold price consolidates near $3,400

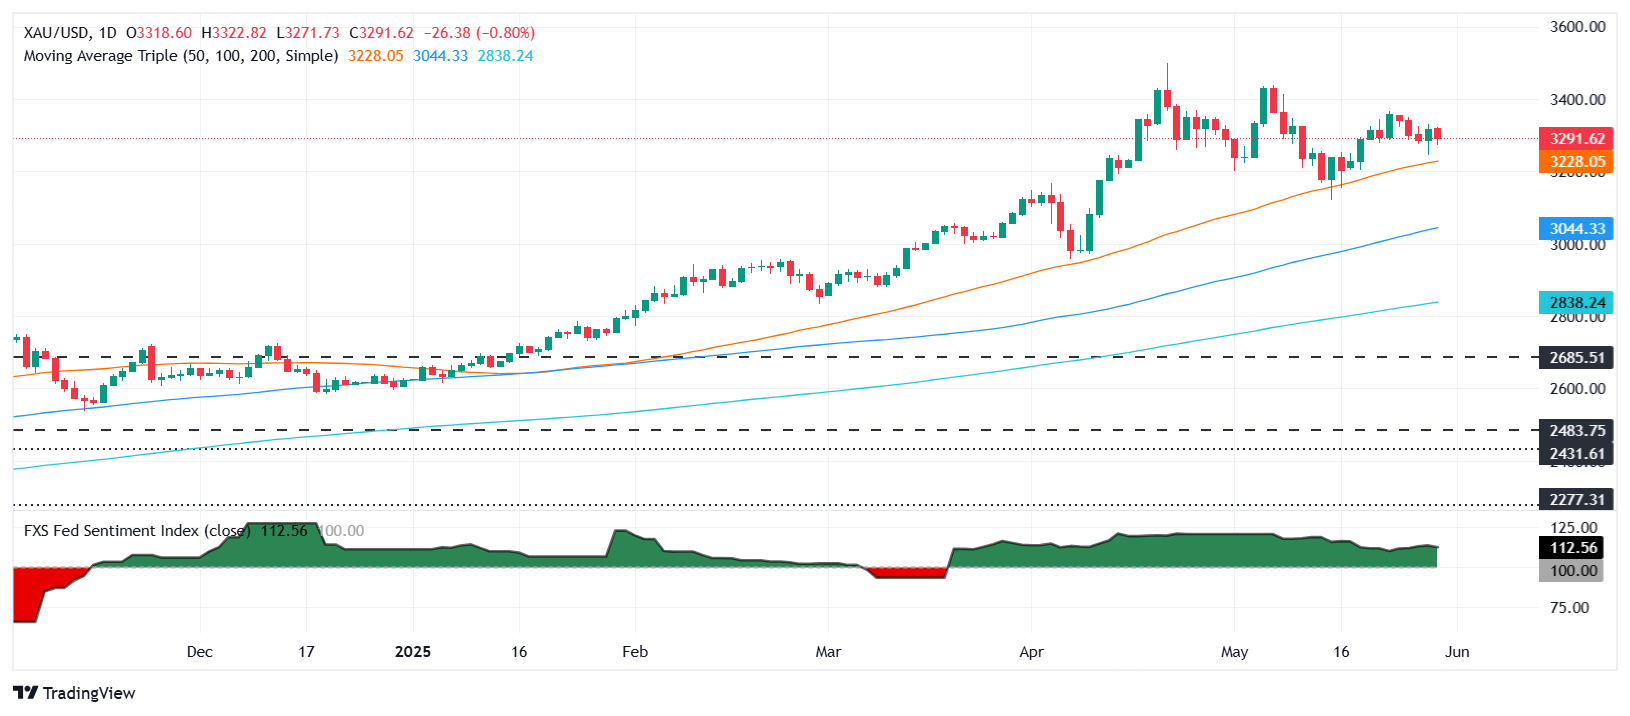
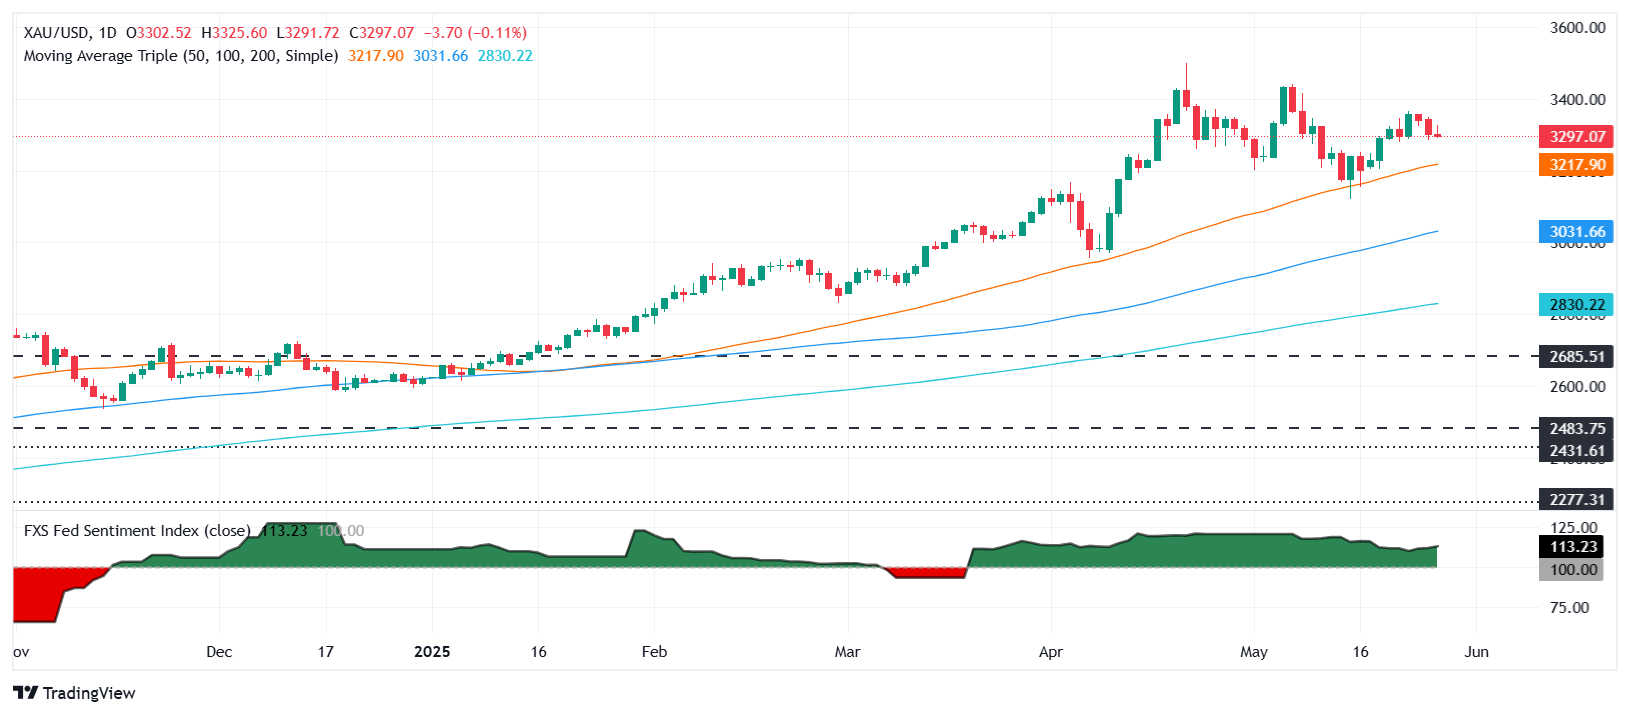
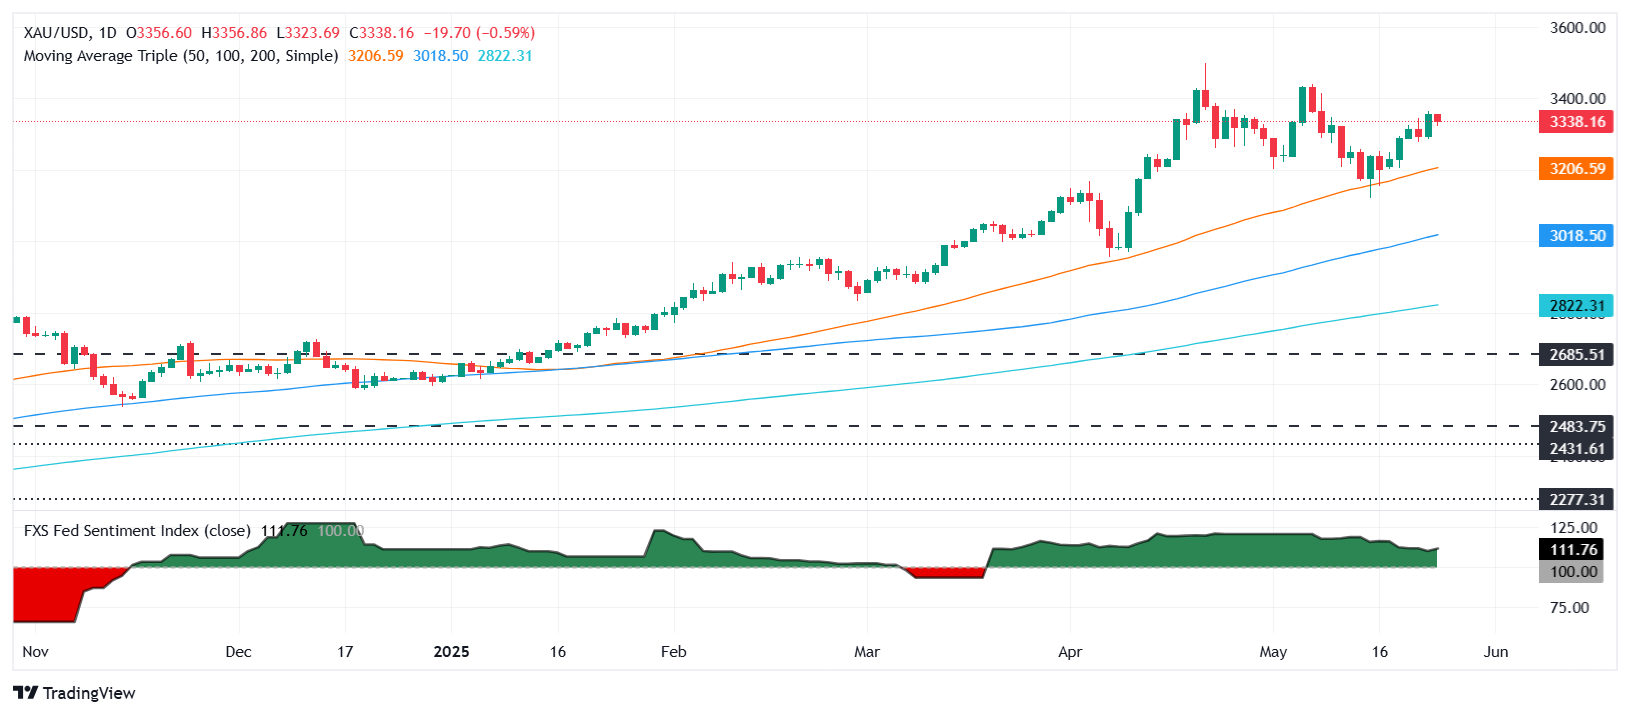
    Gold price is set to extend its gains past the $3,450 figure, clearing the path to challenge the record high of $3,500 in the near term. The Relative Strength Index (RSI) shows that momentum remains bullishly biased, and with that in mind, the path of least resistance is tilted to the upside.

    Conversely, if XAU/USD tumbles below $3,450, the first support would be the $3,400 mark. If it surpasses, the next stop would be the 50-day Simple Moving Average (SMA) at $3,281, ahead of the April 3 high-turned-support at $3,167.
    Gold FAQs

    Gold has played a key role in human’s history as it has been widely used as a store of value and medium of exchange. Currently, apart from its shine and usage for jewelry, the precious metal is widely seen as a safe-haven asset, meaning that it is considered a good investment during turbulent times. Gold is also widely seen as a hedge against inflation and against depreciating currencies as it doesn’t rely on any specific issuer or government.

    Central banks are the biggest Gold holders. In their aim to support their currencies in turbulent times, central banks tend to diversify their reserves and buy Gold to improve the perceived strength of the economy and the currency. High Gold reserves can be a source of trust for a country’s solvency. Central banks added 1,136 tonnes of Gold worth around $70 billion to their reserves in 2022, according to data from the World Gold Council. This is the highest yearly purchase since records began. Central banks from emerging economies such as China, India and Turkey are quickly increasing their Gold reserves.

    Gold has an inverse correlation with the US Dollar and US Treasuries, which are both major reserve and safe-haven assets. When the Dollar depreciates, Gold tends to rise, enabling investors and central banks to diversify their assets in turbulent times. Gold is also inversely correlated with risk assets. A rally in the stock market tends to weaken Gold price, while sell-offs in riskier markets tend to favor the precious metal.

    The price can move due to a wide range of factors. Geopolitical instability or fears of a deep recession can quickly make Gold price escalate due to its safe-haven status. As a yield-less asset, Gold tends to rise with lower interest rates, while higher cost of money usually weighs down on the yellow metal. Still, most moves depend on how the US Dollar (USD) behaves as the asset is priced in dollars (XAU/USD). A strong Dollar tends to keep the price of Gold controlled, whereas a weaker Dollar is likely to push Gold prices up.


    Source link

  • Australian Dollar falls due to risk-off sentiment amid escalating Israel-Iran tensions

    Australian Dollar falls due to risk-off sentiment amid escalating Israel-Iran tensions


    • The Australian Dollar declines due to dampened risk sentiment amid rising tensions in the Middle East.
    • Israeli military officials said that Israel attacked dozens of nuclear sites across Iran.
    • The US Producer Price Index rose 0.1% MoM in May, against the expectation of a 0.2% rise.

    The Australian Dollar (AUD) declines against the US Dollar (USD) on Friday, with over 1% losses. The AUD/USD pair depreciates due to escalating tensions in the Middle East.

    Israeli Minister of Defense Israel Katz warned his country to face a missile and drone attack following Israel’s preemptive attack on Iran. Katz declared a special state of emergency in the country, per Axios. Israeli military officials said that Israel attacked dozens of sites across Iran, as the Iranian nuclear program is an existential threat to Israel.

    Reuters reported that US President Donald Trump expanded steel tariffs starting June 23 on imported “steel derivative products,” including household appliances, such as dishwashers, washing machines, refrigerators, etc. The tariffs were initially imposed at 25% in March and later doubled to 50% for most countries. This is the second time the scope of affected products has been expanded.

    Australian Dollar depreciates as US Dollar advances due to improved safe-haven demand

    • The US Dollar Index (DXY), which measures the value of the US Dollar against six major currencies, is recovering losses and trading higher at around 98.10 at the time of writing. The US Michigan Consumer Sentiment will be eyed later on Friday.
    • The US Producer Price Index (PPI) climbed 0.1% month-over-month in May, compared to a decline of 0.2% (revised from -0.5%). This reading came in softer than the expected 0.2% rise. Meanwhile, the core PPI, excluding food and energy, increased 0.1% MoM in May versus -0.2% prior (revised from -0.4%), below the consensus of 0.3%.
    • President Trump posted on Truth Social on Wednesday that the trade deal with China is done and added that it is subject to his and Chinese President Xi Jinping’s final approval. “We are getting a total of 55% tariffs, China is getting 10%. Relationship is excellent! Thank you for your attention to this matter.”
    • China will grant only six-month rare-earth export licenses for US automakers and manufacturers, which suggests that China wants to have control over critical minerals as leverage in future talks, per the Wall Street Journal (gated).
    • The US Consumer Price Index (CPI) rose 2.4% YoY in May, slightly above 2.3% prior but below the market expectations of a 2.5% increase. The core CPI, which excludes volatile food and energy prices, climbed 2.8% YoY in May, compared to the consensus of 2.9%.
    • On Wednesday, President Trump stated that he would like to extend the trade talks deadline, but doesn’t think it will be necessary. Trump further stated that he will set unilateral tariff rates within two weeks.
    • The US Court of Appeals for the Federal Circuit extended an earlier, temporary respite on Tuesday for the government as it presses a challenge to a lower court ruling last month that blocked the tariffs. The federal appeals court has ruled that President Trump’s broad tariffs can remain in effect while legal appeals continue, per Bloomberg.
    • China’s Trade Balance (CNY) arrived at CNY743.56 billion in May, expanding from the previous surplus of CNY689.99 billion. Meanwhile, Exports rose 6.3% YoY against 9.3% in April. The country’s imports fell 2.1% YoY in the same period, from a 0.8% rise recorded previously.
    • Australia’s Trade Balance posted a 5,413M surplus month-over-month in April, below the 6,100M expected and 6,892M (revised from 6,900M) in the previous reading. Exports declined by 2.4% MoM in April, against a 7.2% rise prior (revised from 7.6%). Meanwhile, Imports rose by 1.1%, compared to a decline of 2.4% (revised from -2.2%) seen in March. China’s Caixin Services PMI rose to 51.1 in May as expected, from 50.7 in April.

    Australian Dollar falls toward 0.6450 near 50-day EMA

    AUD/USD pair trading around 0.6460 on Friday. The daily chart’s technical analysis indicates a weakening of the bullish bias as the pair has breached below the lower boundary of the ascending channel. Additionally, the pair moving below the nine-day Exponential Moving Average (EMA) suggests that short-term price momentum is weakening. However, the 14-day Relative Strength Index (RSI) is still positioned slightly above the 50 mark, indicating a bullish bias is in play.

    On the downside, the AUD/USD pair may further test the 50-day EMA at 0.6423. A break below this level may weaken the medium-term price momentum and put downward pressure on the pair to navigate the region around 0.5914, the lowest since March 2020.

    The immediate barrier appears at the nine-day EMA of 0.6495, followed by the seven-month high of 0.6538, which was reached on June 5. Further advances could prompt the pair to explore the region around the eight-month high at 0.6687, followed by the upper boundary of the ascending channel around 0.6730.

    AUD/USD: Daily Chart

    Australian Dollar PRICE Today

    The table below shows the percentage change of Australian Dollar (AUD) against listed major currencies today. Australian Dollar was the weakest against the Swiss Franc.

    USD EUR GBP JPY CAD AUD NZD CHF
    USD 0.45% 0.45% 0.17% 0.22% 0.76% 0.77% -0.15%
    EUR -0.45% 0.04% -0.23% -0.16% 0.40% 0.29% -0.59%
    GBP -0.45% -0.04% -0.33% -0.28% 0.27% 0.23% -0.62%
    JPY -0.17% 0.23% 0.33% 0.09% 0.61% 0.59% -0.30%
    CAD -0.22% 0.16% 0.28% -0.09% 0.52% 0.55% -0.34%
    AUD -0.76% -0.40% -0.27% -0.61% -0.52% -0.02% -0.89%
    NZD -0.77% -0.29% -0.23% -0.59% -0.55% 0.02% -0.86%
    CHF 0.15% 0.59% 0.62% 0.30% 0.34% 0.89% 0.86%

    The heat map shows percentage changes of major currencies against each other. The base currency is picked from the left column, while the quote currency is picked from the top row. For example, if you pick the Australian Dollar from the left column and move along the horizontal line to the US Dollar, the percentage change displayed in the box will represent AUD (base)/USD (quote).

    Tariffs FAQs

    Tariffs are customs duties levied on certain merchandise imports or a category of products. Tariffs are designed to help local producers and manufacturers be more competitive in the market by providing a price advantage over similar goods that can be imported. Tariffs are widely used as tools of protectionism, along with trade barriers and import quotas.

    Although tariffs and taxes both generate government revenue to fund public goods and services, they have several distinctions. Tariffs are prepaid at the port of entry, while taxes are paid at the time of purchase. Taxes are imposed on individual taxpayers and businesses, while tariffs are paid by importers.

    There are two schools of thought among economists regarding the usage of tariffs. While some argue that tariffs are necessary to protect domestic industries and address trade imbalances, others see them as a harmful tool that could potentially drive prices higher over the long term and lead to a damaging trade war by encouraging tit-for-tat tariffs.

    During the run-up to the presidential election in November 2024, Donald Trump made it clear that he intends to use tariffs to support the US economy and American producers. In 2024, Mexico, China and Canada accounted for 42% of total US imports. In this period, Mexico stood out as the top exporter with $466.6 billion, according to the US Census Bureau. Hence, Trump wants to focus on these three nations when imposing tariffs. He also plans to use the revenue generated through tariffs to lower personal income taxes.


    Source link

  • EUR/USD extends gains on dovish US CPI, flirts with 1.15

    EUR/USD extends gains on dovish US CPI, flirts with 1.15


    • EUR/USD advances as lower US inflation sparks calls for aggressive Fed rate cuts.
    • Trump urges full percentage point cut in Fed funds rate post-CPI.
    • ECB policymakers cautious, but inflation outlook hints at further fine-tuning.

    The EUR/USD surged during the North American session but remains shy of clearing the 1.1500 figure, following the release of a softer-than-expected inflation report in the United States (US), which could prompt the Federal Reserve (Fed) to reduce borrowing costs in the near term. At the time of writing, the pair trades at 1.1482, up by over 0.50%.

    US data revealed that the Consumer Price Index (CPI) in May fell short of estimates as prices continued to trend lower. Following the data release, US President Donald Trump posted on his social network that the Fed should lower the fed funds rate by one whole percentage point.

    Although inflation edged lower, some analysts project that households in the upcoming month will feel the impact of tariffs. Meanwhile, positive trade news regarding negotiations between the US and China emerged, as the Wall Street Journal (WSJ) revealed that China is putting a six-month limit on rare-earth export licenses for US automakers and manufacturers.

    Meanwhile, in the Eurozone (EU), European Central Bank (ECB) policymakers made headlines, although they failed to move the EUR/USD pair. The ECB’s Vujcic said that he is looking for more clarity on trade, while Kazaks noted that it is “quite likely that 2% inflation will require some further cuts for fine-tuning,” said via Econostream on X.

    The ECB Chief Economist, Philip Lane, added that last week’s rate cut helped clarify the bank’s policy stance to bring inflation toward its target.

    Ahead in the week, the EUR/USD is expected to be greatly influenced by the release of the US Producer Price Index (PPI) numbers, along with the Initial Jobless Claims report. Across the pond, the EU’s schedule is scarce on economic data, but ECB officials led by Vice-President Luis de Guindos will cross the wires.

    Euro PRICE This week

    The table below shows the percentage change of Euro (EUR) against listed major currencies this week. Euro was the strongest against the US Dollar.

    USD EUR GBP JPY CAD AUD NZD CHF
    USD -0.85% -0.19% -0.32% -0.19% -0.12% -0.23% -0.28%
    EUR 0.85% 0.65% 0.51% 0.65% 0.76% 0.62% 0.56%
    GBP 0.19% -0.65% -0.04% 0.00% 0.12% -0.03% -0.08%
    JPY 0.32% -0.51% 0.04% 0.12% 0.15% 0.03% -0.08%
    CAD 0.19% -0.65% -0.01% -0.12% 0.06% -0.04% -0.09%
    AUD 0.12% -0.76% -0.12% -0.15% -0.06% -0.14% -0.19%
    NZD 0.23% -0.62% 0.03% -0.03% 0.04% 0.14% -0.05%
    CHF 0.28% -0.56% 0.08% 0.08% 0.09% 0.19% 0.05%

    The heat map shows percentage changes of major currencies against each other. The base currency is picked from the left column, while the quote currency is picked from the top row. For example, if you pick the Euro from the left column and move along the horizontal line to the US Dollar, the percentage change displayed in the box will represent EUR (base)/USD (quote).

    Daily digest market movers: EUR/USD soars past 1.1480 as traders shift toward US PPI data

    • EUR/USD appears poised to test the 1.1500 mark in the near term as positive news about US-China talks could increase appetite for riskier assets and weigh on the US Dollar.
    • US Treasury Secretary Scott Bessent commented that trade fairness with China could be achieved through reduced exports to the US or by rebalancing the world’s largest economies. He added that the Trump administration is committed to maintaining the US Dollar’s reserve currency status.
    • US inflation came in softer than expected in May. Headline CPI rose 2.4% YoY, slightly above April’s 2.3% but below the 2.5% forecast. Core CPI held steady at 2.8% YoY, suggesting underlying inflation remains stable but persistent.
    • The PPI for May is projected to increase from 2.4% to 2.6% YoY. Underlying PPI figures are expected to remain at 3.1% higher, unchanged compared to April’s print.
    • Financial market players do not expect that the ECB would reduce its Deposit Facility Rate by 25 basis points (bps) at the July monetary policy meeting.

    Euro technical outlook: EUR/USD bulls eyes 1.15 and the YTD high

    From a technical perspective, the uptrend is expected to continue as buyers target a clear break above the 1.1500 figure. This will expose the year-to-date (YTD) high of 1.1572, ahead of 1.1600. The Relative Strength Index (RSI) is bullish, indicating an upward direction, which suggests that buyers are gaining momentum.

    The less likely scenario on the downside is that the EUR/USD needs to clear the 1.1450 area. This would set the pair for a pullback toward the 20-day Simple Moving Average (SMA) at 1.1346 before testing 1.1300.

    ECB FAQs

    The European Central Bank (ECB) in Frankfurt, Germany, is the reserve bank for the Eurozone. The ECB sets interest rates and manages monetary policy for the region.
    The ECB primary mandate is to maintain price stability, which means keeping inflation at around 2%. Its primary tool for achieving this is by raising or lowering interest rates. Relatively high interest rates will usually result in a stronger Euro and vice versa.
    The ECB Governing Council makes monetary policy decisions at meetings held eight times a year. Decisions are made by heads of the Eurozone national banks and six permanent members, including the President of the ECB, Christine Lagarde.

    In extreme situations, the European Central Bank can enact a policy tool called Quantitative Easing. QE is the process by which the ECB prints Euros and uses them to buy assets – usually government or corporate bonds – from banks and other financial institutions. QE usually results in a weaker Euro.
    QE is a last resort when simply lowering interest rates is unlikely to achieve the objective of price stability. The ECB used it during the Great Financial Crisis in 2009-11, in 2015 when inflation remained stubbornly low, as well as during the covid pandemic.

    Quantitative tightening (QT) is the reverse of QE. It is undertaken after QE when an economic recovery is underway and inflation starts rising. Whilst in QE the European Central Bank (ECB) purchases government and corporate bonds from financial institutions to provide them with liquidity, in QT the ECB stops buying more bonds, and stops reinvesting the principal maturing on the bonds it already holds. It is usually positive (or bullish) for the Euro.


    Source link

  • Gold prices head higher as USD gains remain limited

    Gold prices head higher as USD gains remain limited


    • Gold prices extend their gains, heading toward the $3,350 psychological level.
    • The United States and China continue trade talks in London, but USD appreciation is limited.
    • USD and Gold price action are expected to be influenced by US-China talks ahead of Wednesday’s US inflation data.

    Gold prices are trading firm against the US Dollar (USD) on Tuesday, with the precious metal trading near the $3,350 resistance level at the time of writing.

    Ongoing trade talks between the United States and China continue to influence global risk sentiment, helping to stabilize the US Dollar (USD). 

    As US Treasury Secretary Scott Bessent, US Trade Representative Jamieson Greer, and US Commerce Secretary Howard Lutnick continue discussions with China’s Vice Premier He Lifeng for the second day in London, markets remain focused on trade-related developments. 

    Ahead of Tuesday’s meeting, Commerce Secretary Lutnick told reporters that trade talks with China are progressing well and added that he expects the talks to continue throughout the day, according to Reuters.

    These negotiations are expected to continue influencing the direction of the Gold and US Dollar on Tuesday, as investors weigh the potential for eased tensions and improved economic cooperation between the world’s two largest economies.

    Gold daily digest: US-China trade talks in London remain the primary focus for markets

    • On Monday, Kevin Hassett, Director of the US National Economic Council (NEC), added to market optimism in an interview with CNBC, stating, “I expect this to be a short meeting with a firm handshake!”.
    • In a Wall Street Journal comment, Hassett noted that the US anticipates “any export control from the US will be eased and the rare earths will be released in volumes.” Once the more significant issues have been addressed, the US and China are expected to discuss less-urgent matters.
    • Additionally, positive remarks on Monday from US President Donald Trump, affirming that he is getting “good reports” from the meeting, are contributing to keeping market sentiment buoyed.
    • Data released by China’s General Administration of Customs (GAC) on Monday showed that China’s exports to the US decreased by 35% YoY in May. This was the steepest decline since February 2020, when trade was severely disrupted by pandemic-related shutdowns.
    • The expectation that China will release rare earths in volume signals potential relief for the US supply chain. These minerals are crucial for sectors such as technology, defense, and green energy, where they are essential for products like semiconductors, electric vehicles (EVs), and military hardware.
    • These developments are significant not only for geopolitical stability but also for global economic growth forecasts.
    • The next fundamental catalyst on the US economic calendar will be on Wednesday, with the release of US Consumer Price Index (CPI) data for May. Expectations are for headline US CPI to rise by 0.2% on a monthly basis. Inflation is expected to increase to 2.5% YoY, from 2.3% in April.
    • The core CPI, which excludes food and energy prices, is expected to show a 0.3% MoM increase in May compared to 0.2% in April. The YoY figure is also estimated to reflect a 0.1% increase, rising to 2.9% compared to 2.8% in April.
    • The inflation data is an important contributor to interest rate expectations, which drive the direction of the USD and the Gold price. Friday’s Nonfarm Payroll report (NFP), which showed the US economy added more jobs than anticipated in May (139,000 vs. an estimated 130,000), helped ease USD weakness, placing less pressure on the Federal Reserve (Fed) to cut interest rates in the near term. 
    • With stronger employment data increasing the likelihood that the Fed will cut interest rates by 25 basis points in September, the prospect of higher-for-longer interest rates weighs on the non-yielding Gold price, which is inversely correlated with the Greenback.
    • According to the CME FedWatch Tool, market participants expect the Fed to leave interest rates unchanged within the current 4.25% to 4.50% range at the June and July meeting, with a 54.7% probability of a rate cut priced in for September.

    Gold technical analysis: XAU/USD heads toward $3,350

    Gold prices are moving toward the $3,350 level on Tuesday, which is providing immediate resistance for the short-term move. A break above this barrier could open the door for a move toward Friday’s high near $3,375. Further up, the $3,392 resistance level limited the bullish potential last week, followed by the $3,400 psychological level. If buyers clear this zone and bullish momentum gains traction, a move toward the April all-time high at $3,500 may be possible.

    However, the Relative Strength Index (RSI) indicator flattens near the neutral zone of 50 in the daily chart, signalling a lack of momentum and indecision among traders.

    In the event of a downside move, the immediate support for the Gold price is at the 20-day Simple Moving Average (SMA) at $3,303, just above the next psychological support zone of $3,300, and ahead of the 23.6% Fibonacci retracement level of the January-April rise at $3,291.

    The 50-day SMA could then provide an additional layer of support around $3,270, while the tip of a symmetrical triangle chart pattern could provide another important barrier for downside price action at $3,240.

    Gold (XAU/USD) daily chart

    US Dollar PRICE Today

    The table below shows the percentage change of US Dollar (USD) against listed major currencies today. US Dollar was the strongest against the British Pound.

    USD EUR GBP JPY CAD AUD NZD CHF
    USD -0.14% 0.20% -0.01% -0.10% -0.17% -0.12% -0.07%
    EUR 0.14% 0.36% 0.12% 0.07% 0.00% 0.03% 0.10%
    GBP -0.20% -0.36% -0.31% -0.28% -0.35% -0.33% -0.25%
    JPY 0.01% -0.12% 0.31% -0.06% -0.19% -0.19% -0.14%
    CAD 0.10% -0.07% 0.28% 0.06% -0.09% -0.05% 0.03%
    AUD 0.17% -0.01% 0.35% 0.19% 0.09% 0.04% 0.10%
    NZD 0.12% -0.03% 0.33% 0.19% 0.05% -0.04% 0.08%
    CHF 0.07% -0.10% 0.25% 0.14% -0.03% -0.10% -0.08%

    The heat map shows percentage changes of major currencies against each other. The base currency is picked from the left column, while the quote currency is picked from the top row. For example, if you pick the US Dollar from the left column and move along the horizontal line to the Japanese Yen, the percentage change displayed in the box will represent USD (base)/JPY (quote).


    Source link

  • Japanese Yen sticks to disappointing domestic data-inspired losses against a recovering USD

    Japanese Yen sticks to disappointing domestic data-inspired losses against a recovering USD


    • The Japanese Yen attracts sellers for the second straight day in reaction to disappointing domestic data.
    • The optimism over the resumption of US-China trade talks further undermines demand for the safe-haven JPY.
    • The divergent BoJ-Fed expectations should limit JPY losses and cap USD/JPY ahead of the US NFP report.

    The Japanese Yen (JPY) sticks to modest intraday losses led by the disappointing release of Japan’s Household Spending data released earlier this Friday. Adding to this, the optimism over the resumption of US-China trade talks and a positive risk tone turn out to be other factors undermining demand for the safe-haven JPY. This, along with a modest US Dollar (USD) uptick, lifts the USD/JPY pair back closer to the 144.00 mark during the Asian session.

    Any meaningful JPY depreciation, however, still seems elusive in the wake of the growing acceptance that the Bank of Japan (BoJ) will continue raising interest rates. This marks a big divergence in comparison to bets that the Federal Reserve (Fed) will lower borrowing costs further this year, which should cap the USD and support the lower-yielding JPY. This warrants caution for the USD/JPY bulls ahead of the US Nonfarm Payrolls (NFP) report.

    Japanese Yen bulls remain on the sidelines in the wake of weaker data, trade optimism

    • Government data released earlier this Friday showed that Japan’s Household Spending unexpectedly fell by 0.1% from a year earlier in April as compared to the 2.1% increase recorded in the previous month. On a monthly basis, spending declined more than anticipated, by 1.8% during the reported month.
    • The monthly wage data released on Thursday showed that real wages in Japan fell for a fourth consecutive month in April as rising prices continued to outpace pay hikes. This could further undermine private consumption, which contributes to over 50% of Japan’s GDP, and trigger an economic recession.
    • The US Treasury Department, in its exchange-rate report to Congress, said on Thursday that the Bank of Japan should continue to proceed with monetary tightening. The report argued that doing so would support a healthier exchange rate and facilitate needed structural adjustments in trade flows.
    • Japan reportedly is softening its stance on the 25% US auto tariff and instead is proposing a flexible framework to reduce the rate based on how much countries contribute to the US auto industry. Japan’s chief tariff negotiator, Ryosei Akazawa, is in Washington for the fifth round of talks with US officials.
    • Meanwhile, US President Donald Trump and Chinese President Xi Jinping spoke on Thursday and agreed that officials from both sides will meet soon for more talks to resolve the ongoing trade war. Trump said that the call was focused almost entirely on trade and resulted in a very positive conclusion.
    • The US Dollar remains close to its lowest level since April 22 touched the previous day amid increasing odds of an interest rate cut by the Federal Reserve in September. Traders, however, seem reluctant to place aggressive bets around the USD/JPY pair ahead of the US Nonfarm Payrolls (NFP) report later today.

    USD/JPY needs to surpass the 100-SMA on H4 to back the case for further appreciation

    From a technical perspective, the USD/JPY pair has been oscillating in a familiar range since the beginning of this week, forming a rectangle on the daily chart. Against the backdrop of the downfall from the May monthly swing low, this might still be categorized as a bearish consolidation phase. Moreover, slightly negative oscillators on the daily chart suggest that the path of least resistance for spot prices is to the downside. Hence, any further move up is more likely to attract fresh sellers near the 144.00 round figure.

    This is followed by the weekly high, around the 144.40 region. The latter coincides with the 100-period Simple Moving Average (SMA) on the 4-hour chart, which if cleared might shift the bias in favor of bullish traders and allow the USD/JPY pair to reclaim the 145.00 psychological mark.

    On the flip side, weakness below the 143.50-143.45 area could be seen as a buying opportunity near the 143.00 round figure. Some follow-through selling, leading to a subsequent slide below the 142.75-142.70 region, could make the USD/JPY pair vulnerable to accelerate the downfall to the 142.10 region, or last week’s swing low. A convincing break below the latter could make spot prices vulnerable to the recent downward trajectory and slide further to the next relevant support near the 141.60 area en route to sub-141.00 levels.

    Japanese Yen FAQs

    The Japanese Yen (JPY) is one of the world’s most traded currencies. Its value is broadly determined by the performance of the Japanese economy, but more specifically by the Bank of Japan’s policy, the differential between Japanese and US bond yields, or risk sentiment among traders, among other factors.

    One of the Bank of Japan’s mandates is currency control, so its moves are key for the Yen. The BoJ has directly intervened in currency markets sometimes, generally to lower the value of the Yen, although it refrains from doing it often due to political concerns of its main trading partners. The BoJ ultra-loose monetary policy between 2013 and 2024 caused the Yen to depreciate against its main currency peers due to an increasing policy divergence between the Bank of Japan and other main central banks. More recently, the gradually unwinding of this ultra-loose policy has given some support to the Yen.

    Over the last decade, the BoJ’s stance of sticking to ultra-loose monetary policy has led to a widening policy divergence with other central banks, particularly with the US Federal Reserve. This supported a widening of the differential between the 10-year US and Japanese bonds, which favored the US Dollar against the Japanese Yen. The BoJ decision in 2024 to gradually abandon the ultra-loose policy, coupled with interest-rate cuts in other major central banks, is narrowing this differential.

    The Japanese Yen is often seen as a safe-haven investment. This means that in times of market stress, investors are more likely to put their money in the Japanese currency due to its supposed reliability and stability. Turbulent times are likely to strengthen the Yen’s value against other currencies seen as more risky to invest in.


    Source link

  • Australian Dollar falls due to risk-off sentiment amid escalating Israel-Iran tensions

    Australian Dollar falls, downside seems limited amid market caution ahead US NFP


    • The Australian Dollar may consolidate as traders adopt caution ahead of the US NFP release.
    • President Trump described the call as productive, and negotiations on tariffs are set to continue.
    • US Nonfarm Payrolls could have added 130,000 jobs in May, meanwhile, the Unemployment Rate is expected to hold steady at 4.2%.

    The Australian Dollar (AUD) declines against the US Dollar (USD) on Friday. The AUD/USD pair may remain stable amid market caution, as traders await the upcoming US Nonfarm Payrolls (NFP) report, due later in the day, seeking fresh insights into the United States (US) economy.

    Market sentiment improved following a productive phone call between US President Donald Trump and Chinese President Xi Jinping. Trump expressed that the call was productive and prepared to continue tariff negotiations. However, Trump and his team struggled to stay composed with Chinese trade officials. It is essential to note that any changes in the Chinese economy could impact the AUD, as China and Australia are close trade partners.

    Reserve Bank of Australia (RBA) Minutes of its May meeting suggested that the policymakers viewed the case for a 25 basis point cut as stronger, preferring a policy to be cautious and predictable. RBA Assistant Governor Sarah Hunter expressed caution on Tuesday that “higher US tariffs will put a drag on the global economy,” and warned that higher uncertainty could dampen investment, output, and employment in Australia.

    Australian Dollar struggles as US Dollar recovers losses ahead of NFP data

    • The US Dollar Index (DXY), which measures the value of the US Dollar against six major currencies, is trading higher at around 98.80 at the time of writing. The upcoming US Nonfarm Payrolls is expected to have added 130,000 jobs in May, below the 177,000 increase in April. The Unemployment Rate is also expected to hold steady at 4.2%.
    • Weekly Initial Jobless Claims rose to 247,000, above the expected 235,000, as data released by the US Department of Labor. Thursday’s US ADP private sector employment rose 37,000 in May, against a 60,000 increase (revised from 62,000) recorded in April, far below the market expectation of 115,000.
    • Institute for Supply Management’s (ISM) Services Purchasing Managers Index (PMI) declined to 49.9 in May, from 51.6 in April. This reading surprisingly came in weaker than the expected 52.0. Meanwhile,
    • US President Donald Trump called upon, in a post published on Truth Social on Wednesday, Federal Reserve (Fed) Chairman Jerome Powell to lower the policy rate. “ADP NUMBER OUT!!! “Too Late” Powell must now LOWER THE RATE. He is unbelievable!!! Europe has lowered NINE TIMES,” Trump said.
    • On Wednesday, Minneapolis Fed President Neel Kashkari noted that the labor market is showing some signs of slowing down. However, persistent uncertainty prevails over the economy, and the Fed must stay in wait-and-see mode to assess how the economy responds to the uncertainty.
    • House Republicans passed Trump’s “Big Beautiful Bill,” a multitrillion-dollar tax and spending package, which could increase the US fiscal deficit, along with the risk of bond yields staying higher for longer. This scenario raises concerns over the US economy and prompts traders to sell American assets under the “Sell America” trend. Policy experts anticipate Senate changes as GOP lawmakers aim to finalize the “big bill” by July 4.
    • The former biggest Donald Trump backer, Elon Musk, has been attacking Trump’s ‘big beautiful budget bill’ this week via social media. Musk has been openly mocking the Trump budget, which he had played a key role in creating. He criticized that the Trump budget codifies functionally none of the federal spending cuts that he swiftly executed at the start of Trump’s second term without Congressional oversight.
    • Last week, Trump accused China of breaching a truce on tariffs reached earlier this month. Washington and Beijing agreed to temporarily lower reciprocal tariffs in a meeting in Geneva. Trump said that China had “totally violated its agreement with us.” US Trade Representative Jamieson Greer also said that China had failed to remove non-tariff barriers as agreed. In response, a spokesperson from China’s Ministry of Commerce said on Monday that China had complied with the agreement by cancelling or suspending relevant tariff and non-tariff measures aimed at US “reciprocal tariffs.”
    • China’s Caixin Manufacturing Purchasing Managers’ Index (PMI) unexpectedly fell to 48.3 in May from 50.4 in April, falling short of the market expectations of a 50.6 expansion. However, the weekend data showed that the National Bureau of Statistics (NBS) Manufacturing PMI rose to 49.5 in May, from April’s 49.0 reading. Meanwhile, the Non-Manufacturing PMI declined to 50.3 from the previous 50.4 figure, falling short of the expected reading of 50.6. The Aussie Dollar could be impacted by Chinese economic data as both countries are close trading partners.
    • Australia’s Trade Balance posted a 5,413M surplus month-over-month in April, below the 6,100M expected and 6,892M (revised from 6,900M) in the previous reading. Exports declined by 2.4% MoM in April, against a 7.2% rise prior (revised from 7.6%). Meanwhile, Imports rose by 1.1%, compared to a decline of 2.4% (revised from -2.2%) seen in March. China’s Caixin Services PMI rose to 51.1 in May as expected, from 50.7 in April.
    • The Australian Bureau of Statistics (ABS) showed that Gross Domestic Product (GDP) grew by 0.2% quarter-over-quarter in Q1, declining from the previous 0.6% growth. Australia’s economy fell short of the expected 0.4% rise. Meanwhile, the annual GDP growth rate remained consistent at 1.3%, below the expected 1.5%.

    Australian Dollar stays above 0.6500, could target seven-month highs

    The AUD/USD pair is trading around 0.6510 on Friday. The daily chart’s technical analysis suggests the prevailing bullish bias as the pair remains within the ascending channel pattern. Additionally, the short-term price momentum remains stronger as the pair stays above the nine-day Exponential Moving Average (EMA). The 14-day Relative Strength Index (RSI) is also positioned above the 50 mark, suggesting a bullish outlook.

    On the upside, the AUD/USD pair may target a seven-month high of 0.6538, which was recorded on June 5. The pair can also explore the region around the upper boundary of the ascending channel around 0.6680, aligned with the eight-month high at 0.6687.

    The primary support appears at the nine-day EMA of 0.6478, aligned with the ascending channel’s lower boundary around 0.6470. Further decline could weaken the bullish bias and lead the AUD/USD pair to test the 50-day EMA at 0.6405.

    AUD/USD: Daily Chart

    Australian Dollar PRICE Today

    The table below shows the percentage change of Australian Dollar (AUD) against listed major currencies today. Australian Dollar was the weakest against the Canadian Dollar.

    USD EUR GBP JPY CAD AUD NZD CHF
    USD 0.05% -0.00% 0.17% -0.08% 0.17% -0.04% 0.06%
    EUR -0.05% -0.04% 0.10% -0.12% 0.07% -0.08% 0.02%
    GBP 0.00% 0.04% 0.14% -0.07% 0.11% -0.03% 0.06%
    JPY -0.17% -0.10% -0.14% -0.18% 0.13% -0.07% -0.16%
    CAD 0.08% 0.12% 0.07% 0.18% 0.24% 0.05% 0.13%
    AUD -0.17% -0.07% -0.11% -0.13% -0.24% -0.14% -0.03%
    NZD 0.04% 0.08% 0.03% 0.07% -0.05% 0.14% 0.09%
    CHF -0.06% -0.02% -0.06% 0.16% -0.13% 0.03% -0.09%

    The heat map shows percentage changes of major currencies against each other. The base currency is picked from the left column, while the quote currency is picked from the top row. For example, if you pick the Australian Dollar from the left column and move along the horizontal line to the US Dollar, the percentage change displayed in the box will represent AUD (base)/USD (quote).

    Risk sentiment FAQs

    In the world of financial jargon the two widely used terms “risk-on” and “risk off” refer to the level of risk that investors are willing to stomach during the period referenced. In a “risk-on” market, investors are optimistic about the future and more willing to buy risky assets. In a “risk-off” market investors start to ‘play it safe’ because they are worried about the future, and therefore buy less risky assets that are more certain of bringing a return, even if it is relatively modest.

    Typically, during periods of “risk-on”, stock markets will rise, most commodities – except Gold – will also gain in value, since they benefit from a positive growth outlook. The currencies of nations that are heavy commodity exporters strengthen because of increased demand, and Cryptocurrencies rise. In a “risk-off” market, Bonds go up – especially major government Bonds – Gold shines, and safe-haven currencies such as the Japanese Yen, Swiss Franc and US Dollar all benefit.

    The Australian Dollar (AUD), the Canadian Dollar (CAD), the New Zealand Dollar (NZD) and minor FX like the Ruble (RUB) and the South African Rand (ZAR), all tend to rise in markets that are “risk-on”. This is because the economies of these currencies are heavily reliant on commodity exports for growth, and commodities tend to rise in price during risk-on periods. This is because investors foresee greater demand for raw materials in the future due to heightened economic activity.

    The major currencies that tend to rise during periods of “risk-off” are the US Dollar (USD), the Japanese Yen (JPY) and the Swiss Franc (CHF). The US Dollar, because it is the world’s reserve currency, and because in times of crisis investors buy US government debt, which is seen as safe because the largest economy in the world is unlikely to default. The Yen, from increased demand for Japanese government bonds, because a high proportion are held by domestic investors who are unlikely to dump them – even in a crisis. The Swiss Franc, because strict Swiss banking laws offer investors enhanced capital protection.


    Source link

  • Dow Jones loses some ground as Trump and Musk clash

    Dow Jones loses some ground as Trump and Musk clash


    • The Dow Jones is holding steady as markets await Friday’s NFP report.
    • Despite an overall upbeat tone to equities, market sentiment remains hobbled.
    • The US is heading into trade talks with China, which Trump staffers historically lack the patience for.

    The Dow Jones Industrial Average (DJIA) held steady on Thursday, chugging quietly near the previous day’s closing bids. Investors are braced for this week’s Nonfarm Payrolls (NFP) jobs report, slated to release on Friday, and the Trump administration is hard at work barreling into trade talks with China and exchanging barbs over budget bills with billionaires. However, steep losses

    Jobs are the headline datapoint for investors this week. ADP job postings sank in May, causing investors to moderate their expectations for this week’s NFP official follow-up. May’s NFP jobs data report is expected to show a net gain of 130K employment positions over the reference period, down from the previous month’s 177K.

    Also in markets: Fed officials still concerned about tariff impacts on inflation

    President Trump’s former right-hand hatchet man, Elon Musk, has been lobbing potshots at Trump’s ‘big beautiful budget bill’ this week via social media. Posting to the social media platform that he owns, Musk has been openly deriding the Trump budget that he had a hand in creating.

    Musk is ostensibly incensed that the Trump budget codifies functionally none of the federal spending cuts that he swiftly executed without Congressional oversight at the beginning of Trump’s second term. The relationship between two of the most prominent people in the country is souring quickly as the two exchange barbs over social media platforms or through statements to media personnel.

    Shares of Tesla (TSLA) were down 17% at their lowest on Thursday, slipping below $305 per share after Elon Musk openly claimed that Donald Trump would have lost the federal election without his “involvement”. Earlier this week, Elon Musk also threatened to primary Congressional lawmakers who support the Trump administration’s deficit-heavy spending bill.

    The Trump team is racing toward trade talks with China following a call between President Trump and Chinese President Xi Jinping. According to statements by Donald Trump on Thursday, the two had a productive phone call, and tariff negotiations are expected to continue. However, Donald Trump himself and most of his retinue have a poor track record of maintaining their composure when dealing with Chinese trade officials. Trump and Xi exchanged barbs as recently as this week over trade, with both sides accusing each other of violating pre-deal trade terms agreed upon in Geneva, Switzerland, in early May.

    Read more stock news: Circle Internet Group stock spikes 235% on IPO debut

    Dow Jones price forecast

    The Dow Jones Industrial Average remains trapped in a consolidation zone. Investors are awaiting a fundamental shift in either direction, and a routine of nerve-fraying headlines on trade and tariffs has significantly widened the scope of intraday technical signals.

    The Dow Jones is pinned to the 42,500 region, with bullish price action firmly capped below the 43,000 handle. However, downside pressure remains firmly subdued, with bids strung along the north side of the 200-day Exponential Moving Average (EMA) near 41,600.

    Dow Jones daily chart

    Dow Jones FAQs

    The Dow Jones Industrial Average, one of the oldest stock market indices in the world, is compiled of the 30 most traded stocks in the US. The index is price-weighted rather than weighted by capitalization. It is calculated by summing the prices of the constituent stocks and dividing them by a factor, currently 0.152. The index was founded by Charles Dow, who also founded the Wall Street Journal. In later years it has been criticized for not being broadly representative enough because it only tracks 30 conglomerates, unlike broader indices such as the S&P 500.

    Many different factors drive the Dow Jones Industrial Average (DJIA). The aggregate performance of the component companies revealed in quarterly company earnings reports is the main one. US and global macroeconomic data also contributes as it impacts on investor sentiment. The level of interest rates, set by the Federal Reserve (Fed), also influences the DJIA as it affects the cost of credit, on which many corporations are heavily reliant. Therefore, inflation can be a major driver as well as other metrics which impact the Fed decisions.

    Dow Theory is a method for identifying the primary trend of the stock market developed by Charles Dow. A key step is to compare the direction of the Dow Jones Industrial Average (DJIA) and the Dow Jones Transportation Average (DJTA) and only follow trends where both are moving in the same direction. Volume is a confirmatory criteria. The theory uses elements of peak and trough analysis. Dow’s theory posits three trend phases: accumulation, when smart money starts buying or selling; public participation, when the wider public joins in; and distribution, when the smart money exits.

    There are a number of ways to trade the DJIA. One is to use ETFs which allow investors to trade the DJIA as a single security, rather than having to buy shares in all 30 constituent companies. A leading example is the SPDR Dow Jones Industrial Average ETF (DIA). DJIA futures contracts enable traders to speculate on the future value of the index and Options provide the right, but not the obligation, to buy or sell the index at a predetermined price in the future. Mutual funds enable investors to buy a share of a diversified portfolio of DJIA stocks thus providing exposure to the overall index.


    Source link

  • Mexican Peso reaches new YTD highs as US Dollar weakens

    Mexican Peso reaches new YTD highs as US Dollar weakens


    • USD/MXN trades below 19.20 after testing a new YTD low at 19.16.
    • US ADP Employment and ISM Services PMI data missed forecasts.
    • Mexico responds to increased tariffs on steel and aluminum imports to the US.

    The Mexican Peso (MXN) is trading near a fresh year-to-date high against the US Dollar (USD) on Wednesday, which is providing support for the USD/MXN pair above 19.16. 

    As economic data released from the United States (US) highlighted signs of economic fragility, trade tensions between the US and its global trading partners continue to rise.

    With tariffs on aluminium and steel imports to the US rising to 50% on Wednesday, Mexico’s Economy Minister, Marcelo Ebrard, announced that Mexico will be requesting an exemption from the tariffs on Friday.

    In a morning conference, Mexican President Claudia Sheinbaum announced that the increase was an “unfair measure”. The President also stated that Mexico will announce countermeasures against the US if no deal is reached by next week.

    “It is not a matter of revenge, or retaliation as they call it in English,” she said. “It is a matter of protecting our jobs and our businesses,” added Sheinbaum.

    Meanwhile, other nations, such as Japan and Canada, are expressing similar concerns and frustrations in response to Trump’s tariff policies, which have been driving demand away from the US Dollar and into alternative assets.

    On Thursday, Mexico will release Consumer Confidence data for May. With April’s reading of 45.5 serving as the benchmark, any upside or downside surprises could further influence the direction of the Mexican Peso.

    For the US, Weekly Jobless claims data will be released at 12:30 GMT, shedding light on the employment situation in the US before Friday’s release of the May Nonfarm Payrolls (NFP) report.

    Mexican Peso daily digest: US employment data remains in focus

    • On Wednesday, US ADP Employment data indicated that the US private sector added 37,000 jobs in May, missing analyst forecasts of a 115,000 increase.
    • The Institute of Supply Management released the latest report for May, which reflected a weakening in business conditions in the US service sector. 
    • With analysts expecting the ISM Services figures to rise to 52, a reading of 49.9 is reflective of a potential weakening in the perceived business conditions of the service sector, which is the largest contributor of Gross Domestic Product (GDP) in the US.
    • On Thursday, Initial Jobless Claims are forecast at 235,000, down from last week’s 240,000 print.
    • Focus remains on Friday’s NFP figures, which are expected to show that 130,000 new jobs were added to the US economy in May, down from 177,000 in April.
    • Meanwhile, the unemployment rate is expected to remain at 4.2%, reflecting a resilient US labour market.
    • According to the CME FedWatch Tool, market participants are currently pricing in a 56% chance of a 25 bps rate cut in September. For June and July meetings, the expectation is that the Fed will maintain its benchmark rate at the current range of 4.25%-4.50%.
    • On Thursday, Mexico’s Consumer Confidence data for May will provide insight into how individuals and consumers in Mexico perceive the economy’s resilience in the face of current economic risks, as well as their expectations for near-term growth prospects. 

    Mexican Peso technical analysis: USD/MXN bears regain control

    USD/MXN is trading below the 19.20 psychological level, providing near-term resistance for the pair. With the 10-day Simple Moving Average (SMA) firming at 19.29, a move above could see a retest of the 19.30 psychological level.

    USD/MXN daily chart

    The 20-day SMA stands at 19.36, a break of which may enable bulls to continue driving prices toward the next major level of technical resistance, the April low at 19.47.

    On the downside, a break below the May low of 19.18 could reassert bearish momentum, potentially pushing prices down toward Wednesday’s low near 19.16. Below that is the October low of 19.11, providing the potential for the 19.00 psychological level.

    Mexican Peso FAQs

    The Mexican Peso (MXN) is the most traded currency among its Latin American peers. Its value is broadly determined by the performance of the Mexican economy, the country’s central bank’s policy, the amount of foreign investment in the country and even the levels of remittances sent by Mexicans who live abroad, particularly in the United States. Geopolitical trends can also move MXN: for example, the process of nearshoring – or the decision by some firms to relocate manufacturing capacity and supply chains closer to their home countries – is also seen as a catalyst for the Mexican currency as the country is considered a key manufacturing hub in the American continent. Another catalyst for MXN is Oil prices as Mexico is a key exporter of the commodity.

    The main objective of Mexico’s central bank, also known as Banxico, is to maintain inflation at low and stable levels (at or close to its target of 3%, the midpoint in a tolerance band of between 2% and 4%). To this end, the bank sets an appropriate level of interest rates. When inflation is too high, Banxico will attempt to tame it by raising interest rates, making it more expensive for households and businesses to borrow money, thus cooling demand and the overall economy. Higher interest rates are generally positive for the Mexican Peso (MXN) as they lead to higher yields, making the country a more attractive place for investors. On the contrary, lower interest rates tend to weaken MXN.

    Macroeconomic data releases are key to assess the state of the economy and can have an impact on the Mexican Peso (MXN) valuation. A strong Mexican economy, based on high economic growth, low unemployment and high confidence is good for MXN. Not only does it attract more foreign investment but it may encourage the Bank of Mexico (Banxico) to increase interest rates, particularly if this strength comes together with elevated inflation. However, if economic data is weak, MXN is likely to depreciate.

    As an emerging-market currency, the Mexican Peso (MXN) tends to strive during risk-on periods, or when investors perceive that broader market risks are low and thus are eager to engage with investments that carry a higher risk. Conversely, MXN tends to weaken at times of market turbulence or economic uncertainty as investors tend to sell higher-risk assets and flee to the more-stable safe havens.


    Source link

  • The BoC keeps its policy rate unchanged

    The BoC keeps its policy rate unchanged


    On Wednesday, the Bank of Canada (BoC) held its policy rate steady at 2.75%, aligning with the expectations of market analysts.

    BoC policy statement key highlights

    Uncertainty over US tariffs remains high; we will seek more information on US trade policy and its impacts.

    The BoC also cites unexpected firmness in recent inflation data and the fact the Canadian economy is softer, but not sharply weaker.

    We will support economic growth while ensuring inflation remains well-controlled.

    The Governing Council is proceeding carefully with particular attention to the risks and uncertainties facing the Canadian economy.

    We are focused on ensuring Canadians continue to have confidence in price stability.

    Says watching the extent to which US tariffs cut demand for exports, how quickly cost increases are passed on to consumer prices, and how inflation expectations evolve.

    The Canadian economy is expected to be considerably weaker in Q2 than in Q1, with strength in exports and inventories reversing.

    April’s annual inflation rate excluding taxes was 2.3%, slightly stronger than expected.

    The bank says it will continue to assess timing and strength of downward and upward pressures on inflation.

    Market reaction

    The Canadian Dollar (CAD) maintains its constructive stance on Wednesday, motivating USD/CAD to trade with modest losses around the 1.3700 neighbourhood following the BoC’s decision to leave rates unchanged.

    Canadian Dollar PRICE Today

    The table below shows the percentage change of Canadian Dollar (CAD) against listed major currencies today. Canadian Dollar was the strongest against the US Dollar.

    USD EUR GBP JPY CAD AUD NZD CHF
    USD -0.30% -0.18% -0.19% -0.15% -0.49% -0.40% -0.27%
    EUR 0.30% 0.08% 0.08% 0.12% -0.20% -0.12% -0.00%
    GBP 0.18% -0.08% -0.04% 0.04% -0.28% -0.20% -0.10%
    JPY 0.19% -0.08% 0.04% 0.05% -0.35% -0.15% -0.08%
    CAD 0.15% -0.12% -0.04% -0.05% -0.33% -0.25% -0.13%
    AUD 0.49% 0.20% 0.28% 0.35% 0.33% 0.08% 0.20%
    NZD 0.40% 0.12% 0.20% 0.15% 0.25% -0.08% 0.10%
    CHF 0.27% 0.00% 0.10% 0.08% 0.13% -0.20% -0.10%

    The heat map shows percentage changes of major currencies against each other. The base currency is picked from the left column, while the quote currency is picked from the top row. For example, if you pick the Canadian Dollar from the left column and move along the horizontal line to the US Dollar, the percentage change displayed in the box will represent CAD (base)/USD (quote).


    This section below was published as a preview of the Bank of Canada’s (BoC) monetary policy announcements at 09:00 GMT.

    • The Bank of Canada (BoC) is seen keeping rates unchanged.
    • The Canadian Dollar navigates the area of yearly highs vs. the US Dollar.
    • Headline CPI in Canada drifted below the central bank’s target.
    • Trade policies should prevail at Governor Macklem’s press conference.

    Market analysts generally predict that the Bank of Canada (BoC) will keep its interest rate at 2.75% on Wednesday, adding to the pauses recorded at the March and April monetary policy meetings.

    In the meantime, the Canadian Dollar (CAD) has been steadily appreciating since it fell to yearly lows in the 1.4400 zone against the US Dollar (USD). The Loonie is currently navigating the area of YTD highs in the proximity of the 1.3700 region.

    Meanwhile, the focus has been on US President Donald Trump’s trade policies, particularly those pertaining to tariffs, since he took office again in January. It is anticipated that this particular topic will take centre stage during the BoC event, influencing both Governor Tiff Macklem’s remarks and media enquiries.

    As growing global uncertainties, mostly caused by the White House’s inconsistent stance on tariffs, compel a reexamination of trade policy, the Bank of Canada is planning to keep interest rates paused once again for June. Given this uncertainty, it is probable that the BoC’s announcement and Governor Macklem’s subsequent news conference this week will be cautious in tone.

    Following the bank’s decision to keep rates unchanged on April 16, Governor Tiff Macklem underlined again the bank’s symmetric approach to its inflation objective, expressing worry when inflation veers either over or below the 2% level. He stressed that the phrase “decisively”, used in earlier exchanges, shouldn’t be taken as a policy cue.

    Regarding the general state of the economy, Macklem underlined the need for adaptation in view of continuous uncertainty, especially with regard to taxes. Once trade circumstances stabilise, the Bank may go back to a more defined base case projection.

    Carolyn Rogers, senior deputy governor, dismissed recent market swings, saying it is too early to draw fundamental conclusions. She underlined that institutions are properly funded with some ability to withstand volatility and that Canadian financial markets remain orderly.

    Regarding monetary policy, Macklem said that the Governing Council debated between maintaining rates constant or cutting 25 basis points. Rogers also mentioned several Council members who were really hopeful and not anticipating further inflationary pressure.

    Previewing the BoC’s interest rate decision, analysts Taylor Schleich and Ethan Currie at the National Bank of Canada noted, “We expect the Bank of Canada to leave its policy rate unchanged at 2.75%… The labour market—which carries a lot of weight—is consistent with further rate relief, but the inflation picture right now isn’t giving the green light. There are also still key unknowns on trade impacts, inflation expectations and fiscal policy which further obscure the picture.”

    When will the BoC release its monetary policy decision, and how could it affect USD/CAD?

    The Bank of Canada will announce its policy decision on Wednesday at 13:45 GMT, with Governor Tiff Macklem holding a press conference at 14:30 GMT thereafter.

    Market observers do not expect significant surprises; however, they anticipate that the central bank will maintain its emphasis on the effects of US tariffs on the Canadian economy. This perspective may also have repercussions for CAD fluctuations.

    Senior Analyst Pablo Piovano from FXStreet highlighted that “USD/CAD has recently broken below its key 200-day Simple Moving Average (SMA) at 1.4020, subsequently opening the taps for extra weakness in the next few weeks.”

    “USD/CAD has hit a fresh 2025 bottom at 1.3673 on June 2, exclusively following dynamics around the US Dollar. Once this level is cleared, extra losses could extend to the September 2024 low at 1.3418 reached on September 25,” Piovano added.

    Piovano notes that “on the upside, the pair should encounter initial resistance at its May top of 1.4015 recorded on May 12 and May 13. This region of monthly peaks appears reinforced by the vicinity of the key 200-day SMA. If the pair manages to surpass the latter, it could embark on a potential visit to the next upside targets at the April high at 1.4414 set on April 1, ahead of the March top at 1.4542 recorded on March 4, and ultimately the 2025 peak at 1.4792 reached on February 3.”

    “Currently, the Relative Strength Index (RSI) has dropped below the 40 level, suggesting further weakness remains in the pipeline. In addition, the ongoing bearish trend looks solid, as indicated by the Average Directional Index (ADX) around the 27 zone,” Piovano concludes.

    Canadian Dollar FAQs

    The key factors driving the Canadian Dollar (CAD) are the level of interest rates set by the Bank of Canada (BoC), the price of Oil, Canada’s largest export, the health of its economy, inflation and the Trade Balance, which is the difference between the value of Canada’s exports versus its imports. Other factors include market sentiment – whether investors are taking on more risky assets (risk-on) or seeking safe-havens (risk-off) – with risk-on being CAD-positive. As its largest trading partner, the health of the US economy is also a key factor influencing the Canadian Dollar.

    The Bank of Canada (BoC) has a significant influence on the Canadian Dollar by setting the level of interest rates that banks can lend to one another. This influences the level of interest rates for everyone. The main goal of the BoC is to maintain inflation at 1-3% by adjusting interest rates up or down. Relatively higher interest rates tend to be positive for the CAD. The Bank of Canada can also use quantitative easing and tightening to influence credit conditions, with the former CAD-negative and the latter CAD-positive.

    The price of Oil is a key factor impacting the value of the Canadian Dollar. Petroleum is Canada’s biggest export, so Oil price tends to have an immediate impact on the CAD value. Generally, if Oil price rises CAD also goes up, as aggregate demand for the currency increases. The opposite is the case if the price of Oil falls. Higher Oil prices also tend to result in a greater likelihood of a positive Trade Balance, which is also supportive of the CAD.

    While inflation had always traditionally been thought of as a negative factor for a currency since it lowers the value of money, the opposite has actually been the case in modern times with the relaxation of cross-border capital controls. Higher inflation tends to lead central banks to put up interest rates which attracts more capital inflows from global investors seeking a lucrative place to keep their money. This increases demand for the local currency, which in Canada’s case is the Canadian Dollar.

    Macroeconomic data releases gauge the health of the economy and can have an impact on the Canadian Dollar. Indicators such as GDP, Manufacturing and Services PMIs, employment, and consumer sentiment surveys can all influence the direction of the CAD. A strong economy is good for the Canadian Dollar. Not only does it attract more foreign investment but it may encourage the Bank of Canada to put up interest rates, leading to a stronger currency. If economic data is weak, however, the CAD is likely to fall.


    Source link

  • Australian Dollar edges lower as US Dollar recovers recent losses

    Australian Dollar edges lower as US Dollar recovers recent losses


    • The Australian Dollar offered its daily gains as the Greenback edged higher.
    • Australia’s Gross Domestic Product expanded 0.2% QoQ in Q1, against the previous 0.6% growth.
    • The US Dollar faced challenges as tariff uncertainty may hurt growth in the US economy.

    The Australian Dollar (AUD) loses ground against the US Dollar (USD) on Wednesday after offering its daily gains. However, the AUD/USD pair remained in positive territory following the release of mixed economic data from Australia.

    Australian Bureau of Statistics (ABS) showed that Gross Domestic Product (GDP) grew by 0.2% quarter-over-quarter in Q1, declining from the previous 0.6% growth. Australia’s economy fell short of the expected 0.4% rise. Meanwhile, the annual GDP growth rate remained consistent at 1.3%, below the expected 1.5%.

    Moreover, the S&P Global Australia Composite Purchasing Managers’ Index (PMI) fell to 50.5 in May from April’s 51.0 reading, expanding for the eighth successive month. However, the pace indicates marginal growth in business activity, albeit the slowest so far in 2025.

    The S&P Global Australia Services PMI came at 50.6 in May, marking a 16th straight month of expansion but at the slowest pace in six months. The Ai Group Manufacturing PMI posted a -23.5 reading, improved slightly from the previous -26.5. Manufacturers experience delays in major projects and rising market hesitation due to global and domestic uncertainty.

    Reserve Bank of Australia (RBA) Assistant Governor Sarah Hunter expressed caution on Tuesday that “higher US tariffs will put a drag on the global economy.” Hunter noted that higher uncertainty could dampen investment, output, and employment in Australia. However, she also added that Australia’s exporters are relatively well-placed to weather the storm and assumes that Chinese authorities will support their economy through fiscal stimulus.

    Australian Dollar declines as US Dollar edges higher on technical correction

    • The US Dollar Index (DXY), which measures the value of the US Dollar against six major currencies, is trading lower at around 99.10 at the time of writing. The Greenback struggles as traders adopt caution amid rising tariff uncertainty and its potential to hurt growth in the US economy.
    • Job Openings and Labor Turnover Survey (JOLTS) showed the number of job openings on the last business day of April stood at 7.39 million, increasing from March’s 7.2 million openings. This figure surprisingly came in above the market expectation of 7.1 million.
    • Institute for Supply Management (ISM) Manufacturing Purchasing Managers’ Index eased to 48.5 in May from 48.7 in April. This figure came in weaker than the expectation of 49.5.
    • US President Donald Trump said at a rally in Pennsylvania on Friday that he planned to double import tariffs on steel and aluminum to build up pressure on global steel producers and intensify the trade war. “We are going to be imposing a 25% increase. We’re going to bring it from 25% to 50% – the tariffs on steel into the United States of America, which will even further secure the steel industry in the United States,” he said, per Reuters.
    • The US Court of Appeals for the Federal Circuit in Washington, on Thursday, temporarily put a hold on a federal court ruling and allowed President Trump’s tariffs to take effect. On Wednesday, a three-judge panel at the Court of International Trade in Manhattan halted Trump from imposing “Liberation Day” tariffs from taking effect. The federal court found that Trump exceeded his authority in imposing broad import tariffs and declared the executive orders issued on April 2 unlawful.
    • House Republicans passed Trump’s “Big Beautiful Bill,” a multitrillion-dollar tax and spending package, which could increase the US fiscal deficit, along with the risk of bond yields staying higher for longer. This scenario raises concerns over the US economy and prompts traders to sell American assets under the “Sell America” trend. Policy experts anticipate Senate changes as GOP lawmakers aim to finalize the “big bill” by July 4.
    • On Friday, Trump accused China of breaching a truce on tariffs reached earlier this month. Washington and Beijing agreed to temporarily lower reciprocal tariffs in a meeting in Geneva. Trump said that China had “totally violated its agreement with us.” US Trade Representative Jamieson Greer also said that China had failed to remove non-tariff barriers as agreed.
    • In response, a spokesperson from China’s Ministry of Commerce said on Monday that China had complied with the agreement by cancelling or suspending relevant tariff and non-tariff measures aimed at US “reciprocal tariffs.”
    • China’s Caixin Manufacturing Purchasing Managers’ Index (PMI) unexpectedly fell to 48.3 in May from 50.4 in April, falling short of the market expectations of a 50.6 expansion. However, the weekend data showed that the National Bureau of Statistics (NBS) Manufacturing PMI rose to 49.5 in May, from April’s 49.0 reading. Meanwhile, the Non-Manufacturing PMI declined to 50.3 from the previous 50.4 figure, falling short of the expected reading of 50.6. The Aussie Dollar could be impacted by Chinese economic data as both countries are close trading partners.
    • RBA Minutes of its May monetary policy meeting suggested that the board viewed the case for a 25 basis point cut as stronger, preferring a policy to be cautious and predictable. The policymakers highlighted that US trade policy posed a significant and adverse impact on the global outlook, but had not yet affected the Australian economy, however, they did not persuade that a 50 bps was needed.
    • The Reserve Bank of Australia (RBA) is expected to deliver more rate cuts in the upcoming policy meetings. The central bank acknowledged progress in curbing inflation and warned that US-China trade barriers pose downside risks to economic growth. Governor Michele Bullock stated that the RBA is prepared to take additional action if the economic outlook deteriorates sharply, raising the prospect of future rate cuts.

    Australian Dollar finds immediate support at nine-day EMA near 0.6450

    AUD/USD is trading around 0.6470 on Wednesday, indicating a prevailing bullish bias. The daily chart’s technical analysis suggests that the pair remains within the ascending channel pattern. The short-term price momentum remains stronger as the pair stays above the nine-day Exponential Moving Average (EMA). Additionally, the 14-day Relative Strength Index (RSI) is positioned above the 50 mark, indicating a persistent bullish outlook.

    On the upside, the AUD/USD pair could approach 0.6537, a seven-month high recorded on May 26. A break above this initial barrier could support the pair to explore the region around the upper boundary of the ascending channel around 0.6670.

    The immediate support appears at the nine-day EMA of 0.6456, aligned with the ascending channel’s lower boundary around 0.6450. A successful breach below this crucial support zone could dampen the bullish bias and lead the AUD/USD pair to test the 50-day EMA at 0.6395.

    AUD/USD: Daily Chart

    Australian Dollar PRICE Today

    The table below shows the percentage change of Australian Dollar (AUD) against listed major currencies today. Australian Dollar was the weakest against the US Dollar.

    USD EUR GBP JPY CAD AUD NZD CHF
    USD 0.04% 0.05% 0.26% 0.02% 0.09% 0.02% 0.05%
    EUR -0.04% -0.01% 0.20% -0.03% 0.04% -0.03% 0.00%
    GBP -0.05% 0.01% 0.18% -0.02% 0.06% -0.02% 0.02%
    JPY -0.26% -0.20% -0.18% -0.21% -0.22% -0.18% -0.17%
    CAD -0.02% 0.03% 0.02% 0.21% 0.06% -0.01% 0.02%
    AUD -0.09% -0.04% -0.06% 0.22% -0.06% -0.08% -0.04%
    NZD -0.02% 0.03% 0.02% 0.18% 0.01% 0.08% 0.03%
    CHF -0.05% -0.01% -0.02% 0.17% -0.02% 0.04% -0.03%

    The heat map shows percentage changes of major currencies against each other. The base currency is picked from the left column, while the quote currency is picked from the top row. For example, if you pick the Australian Dollar from the left column and move along the horizontal line to the US Dollar, the percentage change displayed in the box will represent AUD (base)/USD (quote).

    RBA FAQs

    The Reserve Bank of Australia (RBA) sets interest rates and manages monetary policy for Australia. Decisions are made by a board of governors at 11 meetings a year and ad hoc emergency meetings as required. The RBA’s primary mandate is to maintain price stability, which means an inflation rate of 2-3%, but also “..to contribute to the stability of the currency, full employment, and the economic prosperity and welfare of the Australian people.” Its main tool for achieving this is by raising or lowering interest rates. Relatively high interest rates will strengthen the Australian Dollar (AUD) and vice versa. Other RBA tools include quantitative easing and tightening.

    While inflation had always traditionally been thought of as a negative factor for currencies since it lowers the value of money in general, the opposite has actually been the case in modern times with the relaxation of cross-border capital controls. Moderately higher inflation now tends to lead central banks to put up their interest rates, which in turn has the effect of attracting more capital inflows from global investors seeking a lucrative place to keep their money. This increases demand for the local currency, which in the case of Australia is the Aussie Dollar.

    Macroeconomic data gauges the health of an economy and can have an impact on the value of its currency. Investors prefer to invest their capital in economies that are safe and growing rather than precarious and shrinking. Greater capital inflows increase the aggregate demand and value of the domestic currency. Classic indicators, such as GDP, Manufacturing and Services PMIs, employment, and consumer sentiment surveys can influence AUD. A strong economy may encourage the Reserve Bank of Australia to put up interest rates, also supporting AUD.

    Quantitative Easing (QE) is a tool used in extreme situations when lowering interest rates is not enough to restore the flow of credit in the economy. QE is the process by which the Reserve Bank of Australia (RBA) prints Australian Dollars (AUD) for the purpose of buying assets – usually government or corporate bonds – from financial institutions, thereby providing them with much-needed liquidity. QE usually results in a weaker AUD.

    Quantitative tightening (QT) is the reverse of QE. It is undertaken after QE when an economic recovery is underway and inflation starts rising. Whilst in QE the Reserve Bank of Australia (RBA) purchases government and corporate bonds from financial institutions to provide them with liquidity, in QT the RBA stops buying more assets, and stops reinvesting the principal maturing on the bonds it already holds. It would be positive (or bullish) for the Australian Dollar.


    Source link

  • Japanese Yen sticks to intraday losses; downside seems limited amid hawkish BoJ expectations

    Japanese Yen sticks to intraday losses; downside seems limited amid hawkish BoJ expectations


    • The Japanese Yen attracts some intraday sellers amid a combination of negative factors.
    • Calls for the BoJ to slow tapering beyond 2026 and a positive risk tone undermine the JPY.
    • The divergent BoJ-Fed policy expectations should cap any meaningful upside for USD/JPY.

    The Japanese Yen (JPY) is looking to extend its retracement slide from a one-week low touched against a broadly recovering US Dollar (USD) during the Asian session on Tuesday. Calls for the Bank of Japan (BoJ) to either maintain or ease the pace of its bond purchase tapering beyond fiscal 2026 underscore challenges that the central bank faces in removing its massive monetary stimulus. This, along with a generally positive tone around the equity markets, undermines the safe-haven JPY, which, along with a modest USD bounce from a multi-week low, lifts the USD/JPY pair to the 143.25 area, or a fresh daily high in the last hour.

    Meanwhile, BoJ Governor Kazuo Ueda reiterated in the Japanese parliament earlier today that the central bank will continue raising interest rates if the economy and prices move in line with forecasts. This marks a big divergence in comparison to bets that the Federal Reserve (Fed) will lower borrowing costs further this year, which should cap the USD and benefit the lower-yielding JPY. Moreover, persistent geopolitical risks and trade-related uncertainties should keep a lid on the market optimism, which further backs the case for the emergence of some dip-buying around the JPY. This, in turn, warrants some caution for the USD/JPY bulls.

    Japanese Yen bulls have the upper hand amid BoJ rate hike bets

    • A former Bank of Japan board member Makoto Sakurai said this Tuesday that the central bank is expected to halt its quarterly reductions in government bond purchases starting next fiscal year. Sakurai noted that authorities are concerned that continued reductions could push yields higher, making it harder to manage the economy and government debt.
    • Minutes of a meeting between the BoJ and financial institutions held in May revealed that the central bank received a sizable number of requests to maintain or slightly slow the pace of tapering in its bond purchases from fiscal year 2026. The BoJ will conduct a review of its current taper plan at its next monetary policy meeting scheduled on June 16-17.
    • BoJ Governor Kazuo Ueda reiterated earlier today that the central bank will continue to raise interest rates if the economy and prices move in line with forecasts. Ueda, however, cautioned that it is important to make a judgment without any preset ideas as uncertainties over overseas trade policies and economic situations remain extremely high.
    • Meanwhile, the current market pricing indicates around a 70% chance that the Federal Reserve will deliver at least two 25 basis points interest rate cuts by the end of this year. Moreover, Chicago Fed President Austan Goolsbee said on Monday that the US central bank would lower short-term rates once the uncertainty surrounding tariff policies is resolved.
    • On the economic data front, the Institute for Supply Management (ISM) survey published on Monday showed that economic activity in the US manufacturing sector contracted for a third straight month in May. The ISM Manufacturing PMI receded to 48.5 from 48.7 in April and came in below analysts’ estimates of 49.5, which should cap the US Dollar.
    • Russia and Ukraine held a second round of negotiations on Monday to find a way to end the three-year war amid escalating conflict. In fact, Ukraine launched a surprise attack on Russian airbases, while Russia deployed a record-breaking 472 one-way attack drones as well as several ballistic and cruise missiles against Ukraine just before the peace talks.
    • Russia, meanwhile, rejected an unconditional ceasefire and said that it would only agree to end the war if Ukraine gave up big new chunks of territory and accepted limits on the size of its army. This keeps geopolitical risks in play, which, in turn, should further contribute to limiting any meaningful depreciation move for the safe-haven JPY.
    • Traders now look forward to the release of the US JOLTS Job Openings data, which, along with speeches by influential FOMC members, will drive the USD demand and provide some impetus to the USD/JPY pair. The focus, however, will remain glued to the US monthly employment details, popularly known as the Nonfarm Payrolls (NFP) report on Friday.

    USD/JPY remains vulnerable while below 200-hour SMA, near 147.70

    From a technical perspective, the overnight breakdown below the 143.65-143.60 horizontal support, which coincided with the 200-hour Simple Moving Average (SMA), was seen as a key trigger for the USD/JPY bears. The said area should now keep a lid on any further intraday move-up. A sustained strength beyond, however, might trigger a short-covering rally and lift spot prices to the 144.00 mark. The momentum could extend further, though it runs the risk of fizzling out near the 144.40-144.45 supply zone.

    On the flip side, weakness back below the 143.00 mark could find some support near the Asian session low, around the 142.40-142.35 region. This is followed by the 142.10 area, or last week’s swing low, below which the USD/JPY pair could resume its recent downfall from the May monthly swing high. Spot prices might then weaken to the next relevant support near the 141.60 area before eventually dropping to sub-141.00 levels.

    Bank of Japan FAQs

    The Bank of Japan (BoJ) is the Japanese central bank, which sets monetary policy in the country. Its mandate is to issue banknotes and carry out currency and monetary control to ensure price stability, which means an inflation target of around 2%.

    The Bank of Japan embarked in an ultra-loose monetary policy in 2013 in order to stimulate the economy and fuel inflation amid a low-inflationary environment. The bank’s policy is based on Quantitative and Qualitative Easing (QQE), or printing notes to buy assets such as government or corporate bonds to provide liquidity. In 2016, the bank doubled down on its strategy and further loosened policy by first introducing negative interest rates and then directly controlling the yield of its 10-year government bonds. In March 2024, the BoJ lifted interest rates, effectively retreating from the ultra-loose monetary policy stance.

    The Bank’s massive stimulus caused the Yen to depreciate against its main currency peers. This process exacerbated in 2022 and 2023 due to an increasing policy divergence between the Bank of Japan and other main central banks, which opted to increase interest rates sharply to fight decades-high levels of inflation. The BoJ’s policy led to a widening differential with other currencies, dragging down the value of the Yen. This trend partly reversed in 2024, when the BoJ decided to abandon its ultra-loose policy stance.

    A weaker Yen and the spike in global energy prices led to an increase in Japanese inflation, which exceeded the BoJ’s 2% target. The prospect of rising salaries in the country – a key element fuelling inflation – also contributed to the move.


    Source link

  • Gold price falls below ,300 on strong US Dollar as Trump reignites China tensions

    Gold price falls below $3,300 on strong US Dollar as Trump reignites China tensions


    • XAU/USD drops as strong US Dollar pressures Bullion; tariff uncertainty rattles markets.
    • US core PCE dips in April, but strong data lifts yields, dampening Gold’s appeal.
    • Trump accuses China of violating trade deal, reviving geopolitical and tariff concerns.

    Gold price slumped on Friday as the US Dollar recovered some ground despite witnessing a drop in US Treasury bond yields following a strong inflation report, which keeps traders hopeful that the US Federal Reserve (Fed) will ease policy in 2025. XAU/USD trades at $3,289, down 0.83%.

    Sentiment shifted sour as US President Donald Trump complained that China is not fulfilling the agreement negotiated between both parties in Switzerland. He wrote, “China, perhaps not surprisingly to some, HAS TOTALLY VIOLATED ITS AGREEMENT WITH US. So much for being Mr. NICE GUY!”

    Consequently, US equities fell, while the American Dollar recovered from near daily lows, according to the US Dollar Index (DXY).

    Turning to trade-related news, a US Federal Appeals Court reinstated most of Trump’s tariffs imposed on April 2, “Liberation Day,” following a decision by a US Court of International Trade, which blocked most of the duties as they were considered illegal.

    The US Core Personal Consumption Expenditures (PCE) Price Index dipped in April compared to March’s meeting. Other data showed that the University of Michigan’s (UoM) Consumer Sentiment in May’s final reading improved compared to estimates, while inflation expectations declined.

    Gold daily market movers: Tumbles despite soft US inflation data amid US Dollar strength

    • Gold price is pressured due to a strong US Dollar.The DXY, which tracks the US Dollar’s value against a basket of six currencies, edges up 0.11% to 99.44.
    • US Treasury bond yields are falling. The US 10-year Treasury note yield falls two basis points to 4.40%, while US real yields are also edging down by the same amount 2.086%, slightly below the May 29 close.
    • The US core PCE in April showed the evolution of the disinflation process, which was driven by the Fed’s restrictive interest rates. The reading came in at 2.5% YoY, down from 2.6%. Headline inflation came in at 2.1% YoY, below March’s 2.3% rise.
    • Despite witnessing a lower inflation environment, Bullion prices failed to gain traction as US Dollar short positions in the futures market were trimmed in the last week, according to Commitments of Traders (COT) data.
    • The UoM Consumer Sentiment in May improved from 50.8 to 52.2, exceeding estimates on its final reading. It is worth noting that inflation expectations fell. For the 12 months ahead, expectations fell from 7.3% to 6.6%, and for the next five years, they dropped from 4.6% to 4.2%.
    • After the data release, the Atlanta Fed’s GDPNow preliminary reading of economic growth for Q2 2025 rose sharply from 2.2% to 3.8%.
    • Federal Reserve officials crossed the wires on Thursday, emphasizing that the monetary policy is in a good place and that it would take some time to see a shift in the balance of risks for the Fed’s dual mandate.
    • San Francisco’s Fed President Mary Daly said the labor market is in solid shape and revealed that it would not reach the 2% inflation goal in 2025. Despite this, she said that if jobs are solid and the disinflation process continues, it would make sense to cut rates twice as markets expect.
    • Money markets suggest that traders are pricing in 52 basis points of easing toward the end of the year, following the release of US data, according to Prime Market Terminal data.

    Source: Prime Market Terminal

    XAU/USD technical outlook: Tumbles and poised to test $3,250

    Gold price uptrend is intact, though XAU/USD spot prices achieving a daily/weekly close below $3,300 could sponsor some sideways trading action within the $3,250-$3,300 range amid the lack of fresh catalysts ahead of the weekend.

    For a bearish resumption, sellers must drive Gold prices below $3,250, ahead of the 50-day Simple Moving Average (SMA) at $3,221. A breach of the latter will expose the April 3 high turned support at $3,167.

    Conversely, if bulls push XAU/USD past $3,300, the next key resistance levels will be $3,350, $3,400, the May 7 swing high of $3,438 and the record high $3,500.

    Gold FAQs

    Gold has played a key role in human’s history as it has been widely used as a store of value and medium of exchange. Currently, apart from its shine and usage for jewelry, the precious metal is widely seen as a safe-haven asset, meaning that it is considered a good investment during turbulent times. Gold is also widely seen as a hedge against inflation and against depreciating currencies as it doesn’t rely on any specific issuer or government.

    Central banks are the biggest Gold holders. In their aim to support their currencies in turbulent times, central banks tend to diversify their reserves and buy Gold to improve the perceived strength of the economy and the currency. High Gold reserves can be a source of trust for a country’s solvency. Central banks added 1,136 tonnes of Gold worth around $70 billion to their reserves in 2022, according to data from the World Gold Council. This is the highest yearly purchase since records began. Central banks from emerging economies such as China, India and Turkey are quickly increasing their Gold reserves.

    Gold has an inverse correlation with the US Dollar and US Treasuries, which are both major reserve and safe-haven assets. When the Dollar depreciates, Gold tends to rise, enabling investors and central banks to diversify their assets in turbulent times. Gold is also inversely correlated with risk assets. A rally in the stock market tends to weaken Gold price, while sell-offs in riskier markets tend to favor the precious metal.

    The price can move due to a wide range of factors. Geopolitical instability or fears of a deep recession can quickly make Gold price escalate due to its safe-haven status. As a yield-less asset, Gold tends to rise with lower interest rates, while higher cost of money usually weighs down on the yellow metal. Still, most moves depend on how the US Dollar (USD) behaves as the asset is priced in dollars (XAU/USD). A strong Dollar tends to keep the price of Gold controlled, whereas a weaker Dollar is likely to push Gold prices up.


    Source link

  • The BoC keeps its policy rate unchanged

    Core PCE inflation softens to 2.5% in April as forecast


    Annual inflation in the United States (US), as measured by the change in the Personal Consumption Expenditures (PCE) Price Index, declined to 2.1% in April from 2.3% in March, the US Bureau of Economic Analysis reported on Friday. This reading came in below the market expectation of 2.2%.

    The core PCE Price Index, which excludes volatile food and energy prices, rose 2.5% in the same period, down from the 2.7% increase reported in March and in line with analysts’ estimates. The PCE Price Index and the core PCE Price Index both rose 0.1% on a monthly basis.

    Other details of the report showed that Personal Income and Personal Spending grew 0.8% and 0.2%, respectively, on a monthly basis in April.

    Market reaction to US PCE inflation data

    The US Dollar Index showed no immediate reaction to these figures and was last seen rising 0.1% on the day at 99.44.

    US Dollar PRICE Today

    The table below shows the percentage change of US Dollar (USD) against listed major currencies today. US Dollar was the strongest against the Australian Dollar.

    USD EUR GBP JPY CAD AUD NZD CHF
    USD 0.23% 0.04% -0.32% -0.06% 0.37% 0.01% -0.05%
    EUR -0.23% -0.17% -0.59% -0.28% 0.19% 0.11% -0.27%
    GBP -0.04% 0.17% -0.39% -0.10% 0.37% 0.11% -0.09%
    JPY 0.32% 0.59% 0.39% 0.27% 0.79% 0.49% 0.34%
    CAD 0.06% 0.28% 0.10% -0.27% 0.52% 0.20% 0.01%
    AUD -0.37% -0.19% -0.37% -0.79% -0.52% -0.06% -0.46%
    NZD -0.01% -0.11% -0.11% -0.49% -0.20% 0.06% -0.38%
    CHF 0.05% 0.27% 0.09% -0.34% -0.01% 0.46% 0.38%

    The heat map shows percentage changes of major currencies against each other. The base currency is picked from the left column, while the quote currency is picked from the top row. For example, if you pick the US Dollar from the left column and move along the horizontal line to the Japanese Yen, the percentage change displayed in the box will represent USD (base)/JPY (quote).


    This section below was published as a preview of the US Personal Consumption Expenditures (PCE) Price Index data for April at 06:00 GMT.

    • The core Personal Consumption Expenditures Price Index is expected to rise 0.1% MoM and 2.5% YoY in April.
    • Markets expect the Federal Reserve to hold the policy setting unchanged in June.
    • Annual PCE inflation is forecast to edge lower to 2.2%.

    The United States (US) Bureau of Economic Analysis (BEA) is set to release the Personal Consumption Expenditures (PCE) Price Index data for April on Friday at 12:30 GMT. This index is the Federal Reserve’s (Fed) preferred measure of inflation.

    The core PCE Price Index, which excludes volatile food and energy prices, is projected to rise 0.1% on a monthly basis in April, after remaining unchanged in March. Over the last twelve months, the core PCE inflation is forecast to edge lower to 2.5% from 2.6%. Meanwhile, the headline annual PCE inflation is seen retreating to 2.2% from 2.3% in this period. 

    Anticipating the PCE: Insights into the Fed’s key inflation metric

    PCE inflation data is usually seen as a big market mover because it is taken into account by Fed officials when deciding on the next policy move. During the press conference following the May meeting, Fed Chairman Jerome Powell noted that inflation remains above their target and added that they expect upward pressure to persist. Citing “a great deal of uncertainty about tariffs,” Powell argued that the right thing for them to do is to await further clarity before taking the next policy step. 

    Previewing the PCE inflation report, TD Securities said: “We look for core PCE prices to remain subdued in April, rising 0.1% m/m after printing flat in March—though last month’s data will be revised higher. Headline PCE inflation should also come in soft at 0.06%. On a y/y basis, we look for core PCE inflation to rise 2.6%. We also expect personal spending to mean-revert after front-loading led to a 0.7% m/m surge in March.”

    New York Fed President John Williams said earlier in the week that he wants to avoid inflation becoming highly persistent because that could become permanent. Meanwhile, Minneapolis Fed President Neel Kashkari noted that he supports maintaining interest rates until there is some more clarity on the impact of higher tariffs on inflation.

    How will the Personal Consumption Expenditures Price Index affect EUR/USD?

    Market participants are likely to react to an unexpected reading in the monthly core PCE Price Index, which is not distorted by base effects. A print of 0.3% or higher MoM could support the US Dollar (USD) with an immediate reaction. On the other hand, a reading of 0% or a negative print could have the opposite effect on the USD’s performance against its major rivals.

    According to the CME FedWatch Tool, markets currently see virtually no chance of a Fed rate cut in June, while pricing in about a 25% probability of a cut in July. Hence, the market positioning suggests that the USD has some room left on the upside if the monthly core PCE reading surprises to the upside. Conversely, investors could reassess the probability of a rate reduction in July if a soft PCE figure eases concerns that inflation remains sticky. 

    Eren Sengezer, European Session Lead Analyst at FXStreet, shares a brief technical outlook for EUR/USD:

    “The Relative Strength Index (RSI) indicator on the daily chart holds slightly above 50, and EUR/USD fluctuates above the 20-day Simple Moving Average (SMA), reflecting a lack of seller interest. On the downside, 1.1200 (Fibonacci 23.6% retracement of the January-April uptrend, lower limit of the ascending regression channel) aligns as first support before 1.1015-1.1000 (Fibonacci 38.2% retracement, round level).”

    “Looking north, resistance levels could be spotted at 1.1400 (static level), 1.1500 (static level, round level) and 1.1575 (April 21 high).”

    Inflation FAQs

    Inflation measures the rise in the price of a representative basket of goods and services. Headline inflation is usually expressed as a percentage change on a month-on-month (MoM) and year-on-year (YoY) basis. Core inflation excludes more volatile elements such as food and fuel which can fluctuate because of geopolitical and seasonal factors. Core inflation is the figure economists focus on and is the level targeted by central banks, which are mandated to keep inflation at a manageable level, usually around 2%.

    The Consumer Price Index (CPI) measures the change in prices of a basket of goods and services over a period of time. It is usually expressed as a percentage change on a month-on-month (MoM) and year-on-year (YoY) basis. Core CPI is the figure targeted by central banks as it excludes volatile food and fuel inputs. When Core CPI rises above 2% it usually results in higher interest rates and vice versa when it falls below 2%. Since higher interest rates are positive for a currency, higher inflation usually results in a stronger currency. The opposite is true when inflation falls.

    Although it may seem counter-intuitive, high inflation in a country pushes up the value of its currency and vice versa for lower inflation. This is because the central bank will normally raise interest rates to combat the higher inflation, which attract more global capital inflows from investors looking for a lucrative place to park their money.

    Formerly, Gold was the asset investors turned to in times of high inflation because it preserved its value, and whilst investors will often still buy Gold for its safe-haven properties in times of extreme market turmoil, this is not the case most of the time. This is because when inflation is high, central banks will put up interest rates to combat it.
    Higher interest rates are negative for Gold because they increase the opportunity-cost of holding Gold vis-a-vis an interest-bearing asset or placing the money in a cash deposit account. On the flipside, lower inflation tends to be positive for Gold as it brings interest rates down, making the bright metal a more viable investment alternative.


    Source link

  • Gold price falls below ,300 on strong US Dollar as Trump reignites China tensions

    Gold price slumps beneath $3,300 as Fed Minutes signal stagflation risks and patience


    • Gold drops 0.27% after Fed cites tariff-driven inflation concerns; yields rebound, stalling bullion’s rally.
    • Fed minutes highlight risks of persistent inflation and weakening job growth, prompting cautious rate stance.
    • US bond yields rebound, lifting the Dollar and pressuring Gold below $3,300.
    • Goldman Sachs urges increased Gold exposure amid rising geopolitical risks and central bank demand.

    Gold price extended its losses during the North American session on Wednesday after hitting a daily high of $3,325 earlier in the day, as market participants digested the latest Federal Reserve (Fed) policy minutes. At the time of writing, XAU/USD trades below $3,300, resulting in a solid 0.27% decline.

    On May 6-7, the Fed decided to keep rates unchanged, citing uncertainty about the impact of tariffs on the economy. Officials adopted a patience approach due to increased risks of high inflation and unemployment, fueled by the potential impact of tariffs.

    Policymakers acknowledged some stagflation risks as they noted the “Committee might face difficult tradeoffs if inflation proves to be more persistent while the outlooks for growth and employment weaken.”

    Therefore, the Fed has taken a cautious approach regarding monetary policy, waiting for the “net economic effects of the array of changes to government policies to become clearer.” It is worth noting that the Fed meeting took place before Trump reduced tariffs on China from 145% to 30%.

    Bullion’s rally appears to have stalled during the week, as US Treasury bond yields recovered some of the previous week’s fall, underpinning the US Dollar. However, a surprise dovish tilt in the minutes, the less likely scenario, could drive XAU/USD prices higher.

    On Tuesday, Fox Business News Gasparino, in a post on X, revealed that a framework between the US and India is close to being announced. It should be noted that the US has taken a more flexible approach to trade talks.

    Despite this, the Gold upside remains due to increasing geopolitical tensions between Russia and Ukraine, as well as the Middle East conflict involving Israel and Hamas.

    Goldman Sachs analysts recommended a higher-than-usual allocation to Gold in long-term portfolios, revealed Reuters. They cite elevated risks to US institutional credibility, pressure on the Fed, and sustained central bank demand.

    Ahead in the week, the docket will feature the second estimate for Gross Domestic Product (GDP) in Q1 2025, and the Fed’s preferred inflation gauge, the Core Personal Consumption Expenditures (PCE) Price Index.

    Gold daily market movers: Bullion retreats on strong US Dollar and high US yields

    • US Treasury bond yields are rising as the 10-year Treasury note yield increases by four and a half basis points (bps) to 4.493%. Meanwhile, US real yields also advance four bps at 2.171%.
    • The US Dollar Index (DXY), which tracks the buck’s value against a basket of six currencies, rises over 0.33% to 99.89, fueled by an improvement in Consumer Confidence data, which grew the most in four years, revealed the Conference Board .
    • New York Fed President John Williams said that inflation expectations are well-anchored and added that he wants to avoid inflation becoming highly persistent, as that could become permanent.
    • Data revealed that Gold imports to Switzerland from the US rose to its highest level since at least 2012 in April.
    • Besides this, Reuters revealed that “China’s net gold imports via Hong Kong more than doubled in April from March, and were the highest since March 2024, data showed.”
    • Money markets suggest that traders are pricing in 45 basis points of easing toward the end of the year, according to Prime Market Terminal data.

    Source: Prime Market Terminal

    XAU/USD technical outlook: Gold price pullback to challenge $3,250

    Gold prices have consolidated within the $3,280-$3,330 range over the last four trading sessions, as bullish momentum appears to be fading due to technical reasons. Momentum, as measured by the Relative Strength Index (RSI), is aiming toward its 50-neutral line, which if broken, could sponsor a leg-lower in XAU/USD prices.

    For a continuation of the uptrend, bulls must clear $3,300, $3,400 and the May 7 swing high of $3,438. If achieved, Gold’s next goal would be $3,500.

    On the downside, Gold tumbling below $3,250 could expose a move to the 50-day Simple Moving Average (SMA) at $3,211, followed by the May 20 daily low of $3,204.

    Fed FAQs

    Monetary policy in the US is shaped by the Federal Reserve (Fed). The Fed has two mandates: to achieve price stability and foster full employment. Its primary tool to achieve these goals is by adjusting interest rates.
    When prices are rising too quickly and inflation is above the Fed’s 2% target, it raises interest rates, increasing borrowing costs throughout the economy. This results in a stronger US Dollar (USD) as it makes the US a more attractive place for international investors to park their money.
    When inflation falls below 2% or the Unemployment Rate is too high, the Fed may lower interest rates to encourage borrowing, which weighs on the Greenback.

    The Federal Reserve (Fed) holds eight policy meetings a year, where the Federal Open Market Committee (FOMC) assesses economic conditions and makes monetary policy decisions.
    The FOMC is attended by twelve Fed officials – the seven members of the Board of Governors, the president of the Federal Reserve Bank of New York, and four of the remaining eleven regional Reserve Bank presidents, who serve one-year terms on a rotating basis.

    In extreme situations, the Federal Reserve may resort to a policy named Quantitative Easing (QE). QE is the process by which the Fed substantially increases the flow of credit in a stuck financial system.
    It is a non-standard policy measure used during crises or when inflation is extremely low. It was the Fed’s weapon of choice during the Great Financial Crisis in 2008. It involves the Fed printing more Dollars and using them to buy high grade bonds from financial institutions. QE usually weakens the US Dollar.

    Quantitative tightening (QT) is the reverse process of QE, whereby the Federal Reserve stops buying bonds from financial institutions and does not reinvest the principal from the bonds it holds maturing, to purchase new bonds. It is usually positive for the value of the US Dollar.


    Source link

  • USD/INR trades flat amid a softer US Dollar

    USD/INR trades flat amid a softer US Dollar


    • The Indian Rupee steadies in Tuesday’s Asian session. 
    • A weaker US Dollar and stronger Chinese Yuan could support the INR, but RBI rate cut bets might cap its upside. 
    • The US Conference Board’s Consumer Confidence report is due later on Tuesday. 

    The Indian Rupee (INR) flat lines on Tuesday after hitting a two-week high in the previous session. A broader gain in the Asian currencies on account of a weak US Dollar (USD) could provide some support to the Indian currency. Additionally, a decline in crude oil prices might contribute to the INR’s upside. It’s worth noting that India is the world’s third-largest oil consumer, and lower crude oil prices tend to have a positive impact on the INR value.

    Nonetheless, expectations of lower interest rates by the Reserve Bank of India (RBI) might weigh on the local currency. Traders brace for the US Conference Board’s Consumer Confidence report, which is due later on Tuesday. Also, Durable Goods Orders and the Dallas Fed Manufacturing Index will be released. The Minutes of the Federal Open Market Committee (FOMC) will be the highlight later on Wednesday. 

    Indian Rupee holds steady amid weakening of the US Dollar

    • “It’s a very EM positive environment, and I don’t see any reason why that will stop in the near term,” said Brad Bechtel, global head of foreign exchange at Jefferies. Bechtel emphasized that the US Dollar (USD) could face steeper losses if China allows the Yuan to start moving substantially higher.
    • The Monetary Policy Committee (MPC) of the RBI is likely to cut the repo rate by 25 basis points (bps) at the June meeting, according to  Moneycontrol’s poll of economists and bank treasury heads.
    • NITI Aayog Chief Executive Officer (CEO) BVR Subrahmanyam said that India has surpassed Japan to become the world’s fourth-largest economy, citing data from the International Monetary Fund (IMF). 
    • According to the CME FedWatch tool, the chances of an interest rate cut by the Federal Reserve (Fed) in June’s meeting are only at a low of 5.6%.  

    USD/INR retains the negative bias in the longer term

    The Indian Rupee trades on a flat note on the day. The bearish outlook of the USD/INR pair remains in place as the price is below the key 100-day Exponential Moving Average (EMA) on the daily chart. Furthermore, downward momentum is reinforced by the 14-day Relative Strength Index (RSI), which stands below the midline near 45.00.  This suggests that further downside looks favorable in the near term. 

    The first support level for USD/INR is located at 84.78, the low of May 26. Any follow-through selling below this level could set off a drop to 84.61, the low of May 12. The additional downside filter to watch is 84.05, the lower limit of the trend channel.

    In the bullish case, the 100-day EMA at 85.55 acts as an immediate resistance level for the pair. Sustained trading above the mentioned level possibly lifts USD/INR up to 85.75, the upper boundary of the trend channel. Further north, the next hurdle is seen at 85.10, the high of May 22. 

    Indian Rupee FAQs

    The Indian Rupee (INR) is one of the most sensitive currencies to external factors. The price of Crude Oil (the country is highly dependent on imported Oil), the value of the US Dollar – most trade is conducted in USD – and the level of foreign investment, are all influential. Direct intervention by the Reserve Bank of India (RBI) in FX markets to keep the exchange rate stable, as well as the level of interest rates set by the RBI, are further major influencing factors on the Rupee.

    The Reserve Bank of India (RBI) actively intervenes in forex markets to maintain a stable exchange rate, to help facilitate trade. In addition, the RBI tries to maintain the inflation rate at its 4% target by adjusting interest rates. Higher interest rates usually strengthen the Rupee. This is due to the role of the ‘carry trade’ in which investors borrow in countries with lower interest rates so as to place their money in countries’ offering relatively higher interest rates and profit from the difference.

    Macroeconomic factors that influence the value of the Rupee include inflation, interest rates, the economic growth rate (GDP), the balance of trade, and inflows from foreign investment. A higher growth rate can lead to more overseas investment, pushing up demand for the Rupee. A less negative balance of trade will eventually lead to a stronger Rupee. Higher interest rates, especially real rates (interest rates less inflation) are also positive for the Rupee. A risk-on environment can lead to greater inflows of Foreign Direct and Indirect Investment (FDI and FII), which also benefit the Rupee.

    Higher inflation, particularly, if it is comparatively higher than India’s peers, is generally negative for the currency as it reflects devaluation through oversupply. Inflation also increases the cost of exports, leading to more Rupees being sold to purchase foreign imports, which is Rupee-negative. At the same time, higher inflation usually leads to the Reserve Bank of India (RBI) raising interest rates and this can be positive for the Rupee, due to increased demand from international investors. The opposite effect is true of lower inflation.


    Source link

  • Gold slips as Trump’s hits pause on EU duties amid thin trading volume

    Gold slips as Trump’s hits pause on EU duties amid thin trading volume


    • Gold price dips over 0.50% as improved sentiment trims haven flows after last week’s 4.86% surge.
    • Trump postpones 50% EU tariffs to July 9, easing short-term trade war fears.
    • Strong Chinese Gold imports and Russia-Ukraine tensions keep the bullish outlook intact.

    Gold price drops more than 0.50% on Monday amid the lack of demand for haven assets after United States (US) President Donald Trump delayed tariffs on the European Union (EU). In the meantime, trading remains thin due to the closure of the United Kingdom (UK) and US financial markets for holidays. At the time of writing, XAU/USD trades at $3,336.

    Market mood improved on Trump’s statement on Sunday, pushing back the enactment of duties on EU products until July 9. Therefore, Bullion is pressured following last week’s gains of over 4.86%, the most significant increase since the week starting on April 7.

    On Friday, XAU/USD extended its bullish move as Trump continued to pressure Apple (AAPL) to make iPhones in the US. If not, 25% of duties would be imposed. At the same time, he escalated the rhetoric against the EU, threatening to impose 50% tariffs on its goods. This drove the golden metal from $3,287 to last week’s highest high of $3,365.

    Despite retreating, Gold prices are set to continue rallying, as Reuters revealed that “China’s net gold imports via Hong Kong more than doubled in April from March, and were the highest since March 2024, data showed.”

    Additionally, geopolitical risks remain high after Russia attacked Ukraine for the third straight night, spurring an angry reaction on Trump.

    This week, the US economic docket will feature April Durable Goods Orders, the Federal Open Market Committee (FOMC) meeting minutes, the second estimate for Q1 2025 Gross Domestic Product (GDP) and the release of the Core Personal Consumption Expenditures (PCE) Price Index, the Fed’s favorite inflation gauge.

    Gold daily market movers: Improvement in risk appetite weighs on Gold prices

    • US Treasury bond yields remain steady. The 10-year Treasury note yield fell two basis points (bps) on Friday to 4.509%. Meanwhile, US real yields were down as well, one 4 bps to 2.179%.
    • Gold price outlook is optimistic, given the fragile market mood toward US assets sparked by the growing fiscal deficit in the United States, which ignited Moody’s downgrade of US government debt from AAA to AA1.
    • The fiscal package approved by the US lower house is projected to raise the debt ceiling by $4 trillion.
    • The US Dollar Index (DXY), which tracks the buck’s value against a basket of six currencies, edged down 0.10% at 99.00, a tailwind for the Dollar-denominated precious metal.
    • Money markets suggest that traders are pricing in 47.5 basis points of easing toward the end of the year, according to Prime Market Terminal data.

    Source: Prime Market Terminal

    XAU/USD technical outlook: Gold’s uptrend to extend to $3,400

    Gold prices retreated slightly, and it seems traders are booking profits amid thin liquidity and low volatility in the US in observance of the holiday. Trump’s inconsistency regarding trade policies could keep prices swinging violently once trading resumes on Tuesday.

    From a technical perspective, Gold’s bull trend remains intact. If buyers achieve a daily close above $3,300, they could test last week’s high of $3,365. If surpassed, the next stop would be the $3,400 figure, followed by the May 7 high at $3,438 and the all-time high (ATH) at $3,500.

    On the bearish side, if Gold drops below $3,300, expect a move to the May 20 daily low of $3,204, ahead of the 50-day Simple Moving Average (SMA) at $3,199.

    Fed FAQs

    Monetary policy in the US is shaped by the Federal Reserve (Fed). The Fed has two mandates: to achieve price stability and foster full employment. Its primary tool to achieve these goals is by adjusting interest rates.
    When prices are rising too quickly and inflation is above the Fed’s 2% target, it raises interest rates, increasing borrowing costs throughout the economy. This results in a stronger US Dollar (USD) as it makes the US a more attractive place for international investors to park their money.
    When inflation falls below 2% or the Unemployment Rate is too high, the Fed may lower interest rates to encourage borrowing, which weighs on the Greenback.

    The Federal Reserve (Fed) holds eight policy meetings a year, where the Federal Open Market Committee (FOMC) assesses economic conditions and makes monetary policy decisions.
    The FOMC is attended by twelve Fed officials – the seven members of the Board of Governors, the president of the Federal Reserve Bank of New York, and four of the remaining eleven regional Reserve Bank presidents, who serve one-year terms on a rotating basis.

    In extreme situations, the Federal Reserve may resort to a policy named Quantitative Easing (QE). QE is the process by which the Fed substantially increases the flow of credit in a stuck financial system.
    It is a non-standard policy measure used during crises or when inflation is extremely low. It was the Fed’s weapon of choice during the Great Financial Crisis in 2008. It involves the Fed printing more Dollars and using them to buy high grade bonds from financial institutions. QE usually weakens the US Dollar.

    Quantitative tightening (QT) is the reverse process of QE, whereby the Federal Reserve stops buying bonds from financial institutions and does not reinvest the principal from the bonds it holds maturing, to purchase new bonds. It is usually positive for the value of the US Dollar.


    Source link

  • Gold surges past ,400 on Israel-Iran war risk, soft US inflation boosts safe-haven demand

    Gold softer after small victory for EU on US tariffs


    • Gold price resides below $3,340 on Monday, and takes back some of Friday’s gains. 
    • Markets rejoice and head into risk-on tone after Trump announced a delay on EU tariffs until July 9. 
    • US debt concerns are in the background but remain lingering, capping the downside for the precious metal. 

    Gold (XAU/USD) price slips on Monday towards $3,330 at the time of writing, while US markets will remain closed due to Memorial Day’s public holiday. The small correction comes after United States (US) President Donald Trump issues a statement on Truth Social that he would extend to July 9 the deadline for the European Union (EU) to face 50% tariffs. The decision came after a call between Trump and European Commission President Ursula Von Der Leyen on Sunday,  and should help the EU broker a trade deal with the Trump administration.

    Although this risk-on euphoria looks tempting to join, this does not mean the rally in the precious metal is over. A softer stance on trade weakens the safe-haven demand for Gold, but the metal’s safety appeal is still strong amid growing concerns about the fiscal position of the US government. Investors remain concerned that Trump’s tax bill, which last week passed the House and will be debated in the Senate, will further increase both the US deficit and debt.

    Daily digest market movers: It is nothing fundamentally changing for the EU

    • US President Trump on Sunday announced that his plans to hit the EU with 50% tariffs would be delayed until July 9 to allow for time for both sides to negotiate a deal. The US leader on Friday had threatened higher-than-expected 50% levies against the bloc, while also warning Apple Inc. that it would be subject to 25% tariffs if it does not manufacture its iPhones in the US, Bloomberg reports. 
    • Josh Gilbert, market analyst at eToro, warned that these delays aren’t bringing any structural changes to Trump’s tariff policy. “Pauses are all well and good for now, but during this time, we need to see more agreements in place to confirm Trump’s more negotiable approach,” he said, Bloomberg reports. 
    • Vietnam’s Prime Minister Pham Minh Chinh has asked the country’s central bank, finance ministry and relevant agencies to study the establishment of a regulated Gold exchange to enable transparent public trading and prevent smuggling and manipulation, according to a statement on the government’s website, Bloomberg reports. 
    • The US Dollar also falls on Monday, extending Friday’s losses, as enthusiasm appears to have faded for the world’s reserve currency this year amid mounting fiscal concerns in the US. Speculative traders remained bearish on the dollar but trimmed their positioning to $12.4 billion in the week ending May 20 from $16.5 billion in the week prior, according to CFTC data reported Friday, Reuters reports. 

    Gold Price Technical Analysis: Nothing going on actually

    Gold takes a step back as investors flee to risk assets following the agreement between Trump and von der Leyen to continue to negotiate about trade. Still, the delay is only a minor one, by just a month, and brokering a trade agreement between the two blocs is nearly impossible to do in such a short time span.. Therefore,  these headlines need to be seen as brief injections of reliefs within an overall narrative that is still supportive for Gold due to heightened uncertainty. 

    On the upside, the R1 resistance at $3,386 is the first level to look out for as resistance. The R2 resistance at $3,415 follows not far behind and could open the door for a return to the $3,440 round level and potentially further course to new all-time highs at $3,500. 

    On the other side, some thick-layered support emerges in case the Gold price declines. On the downside, the daily S1 support comes in at $3,307, safeguarding the $3,300 big figure. Some intermediary support could come from the S2 support at $3,258. Further below, there is a technical pivotal level at $3,245, roughly converging with the S2 support at $3,240. 

    XAU/USD: Daily Chart

    Tariffs FAQs

    Tariffs are customs duties levied on certain merchandise imports or a category of products. Tariffs are designed to help local producers and manufacturers be more competitive in the market by providing a price advantage over similar goods that can be imported. Tariffs are widely used as tools of protectionism, along with trade barriers and import quotas.

    Although tariffs and taxes both generate government revenue to fund public goods and services, they have several distinctions. Tariffs are prepaid at the port of entry, while taxes are paid at the time of purchase. Taxes are imposed on individual taxpayers and businesses, while tariffs are paid by importers.

    There are two schools of thought among economists regarding the usage of tariffs. While some argue that tariffs are necessary to protect domestic industries and address trade imbalances, others see them as a harmful tool that could potentially drive prices higher over the long term and lead to a damaging trade war by encouraging tit-for-tat tariffs.

    During the run-up to the presidential election in November 2024, Donald Trump made it clear that he intends to use tariffs to support the US economy and American producers. In 2024, Mexico, China and Canada accounted for 42% of total US imports. In this period, Mexico stood out as the top exporter with $466.6 billion, according to the US Census Bureau. Hence, Trump wants to focus on these three nations when imposing tariffs. He also plans to use the revenue generated through tariffs to lower personal income taxes.


    Source link