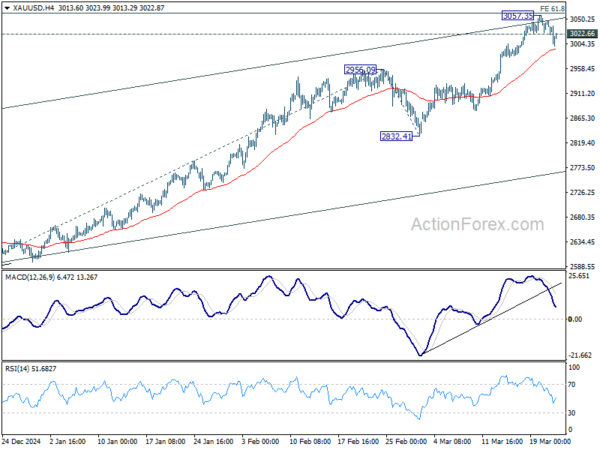
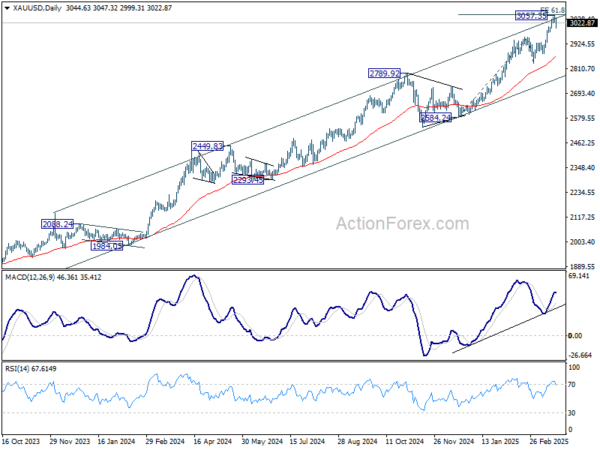
While US investors managed to stay relatively composed through most of last week, the calm cracked heading into the weekend. Stocks saw extended selloffs, Treasury yields dropped, and Gold surged to yet another record high — all classic signs of a decisive flight to safety. With risk appetite now clearly under pressure, traders are no longer waiting to see what happens next. They’ve begun positioning defensively ahead of April 2, dubbed “Liberation Day,” when the US is expected to announce sweeping reciprocal tariffs.
That looming event, along with inevitable retaliatory measures from trading partners, has injected a fresh wave of uncertainty into the outlook. Risk-off sentiment is likely to dominate US markets in the near term, at least until the full scale of the tariff fallout becomes clear — including possible re-retaliations.
A big question is whether European markets, which showed notable resilience through March, can continue to defy the global jitters. Stocks in Germany and the UK have largely outperformed US peers, and Euro has led major currencies higher for the month. But the divergence might be tested soon, especially if the trade conflict spills into sectors crucial to the Eurozone’s export-heavy economy.
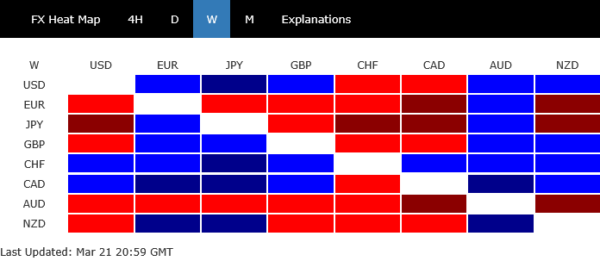
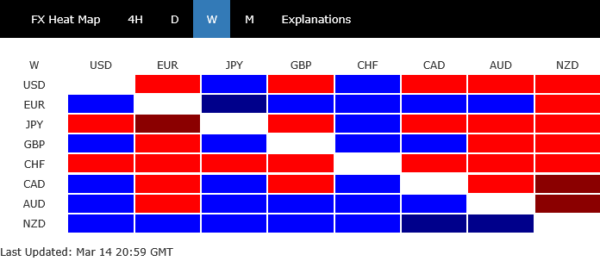
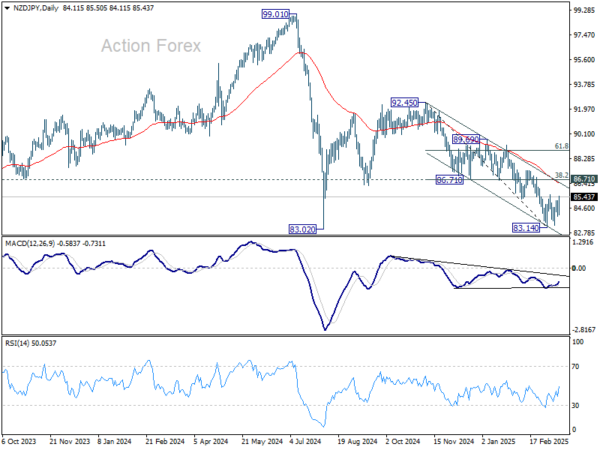
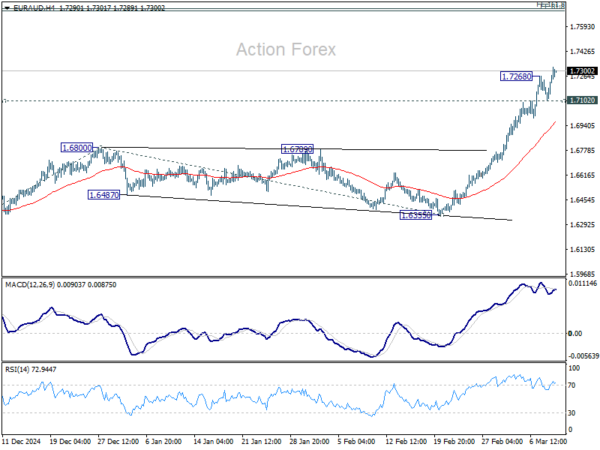
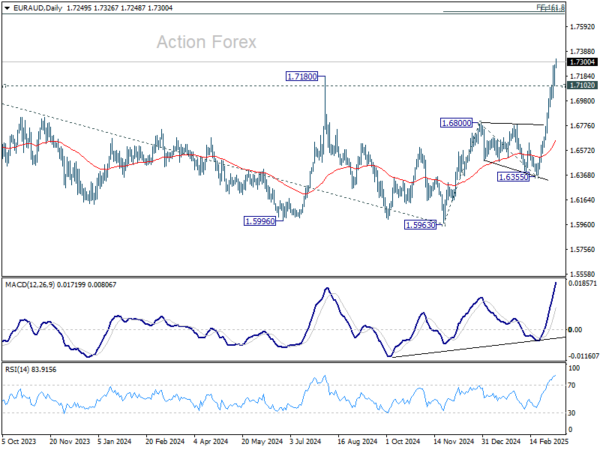
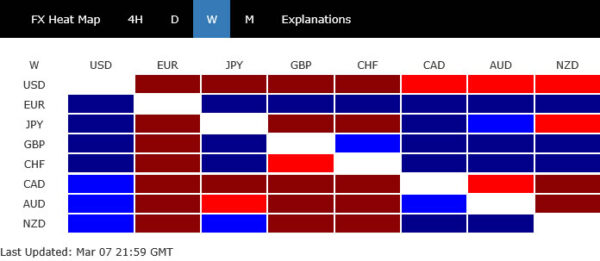
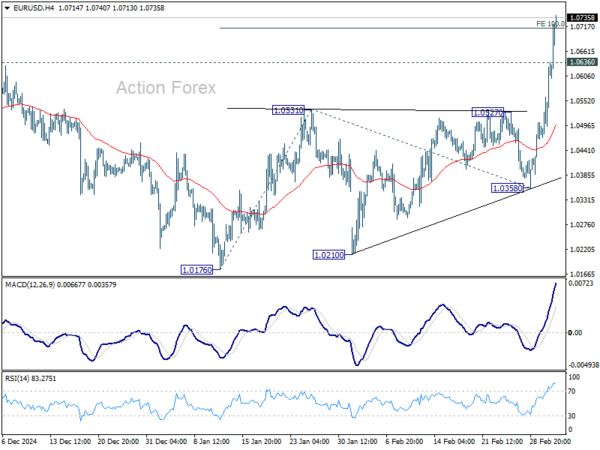
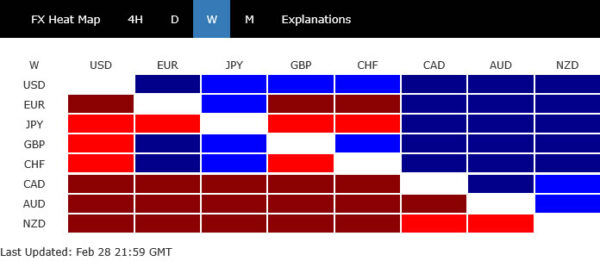
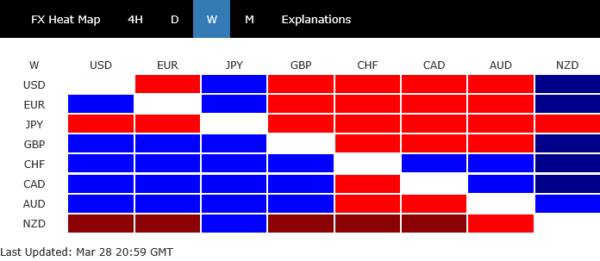
Meanwhile, forex markets have remained relatively stable, with most major pairs stuck inside the prior week’s ranges. Kiwi was the lone exception. However, late-week price action across several currency pairs — particularly EUR/USD — suggests that breakouts may be imminent. The common currency is showing signs of bullish potential, with traders watching closely to see whether March strength can evolve into something even more meaningful.
Ultimately, April could be a make-or-break month for the Euro. Either it confirms a genuine bullish turn, reversing the multi-decade downtrend, or it becomes just another short-lived bounce in a longer-term bearish cycle. Otherwise, the March rally risks being remembered as another false dawn in the common currency’s struggle to reverse its long-term decline.
Wall Street Sinks as Markets Front-Run Trump’s “Liberation Day” Tariff Blitz
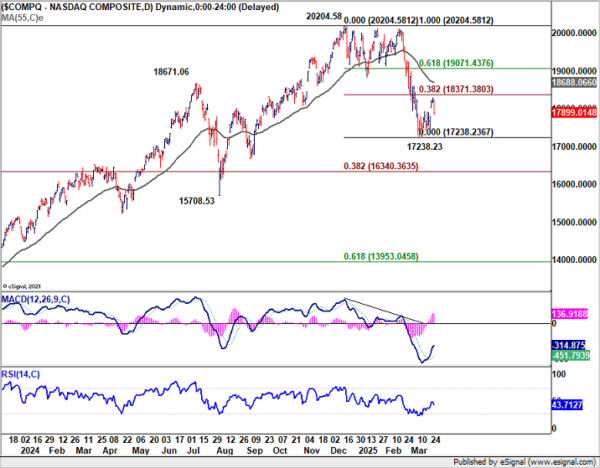
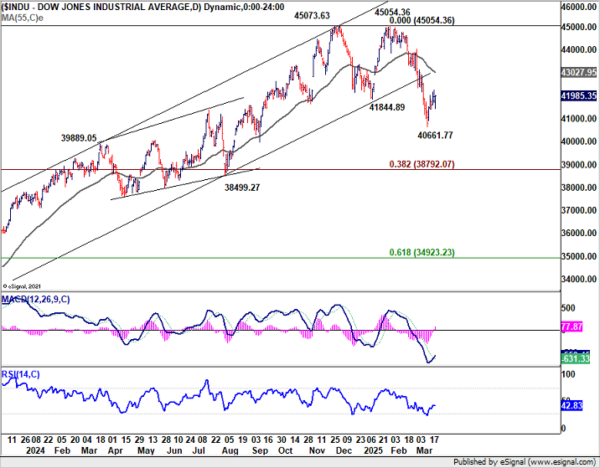
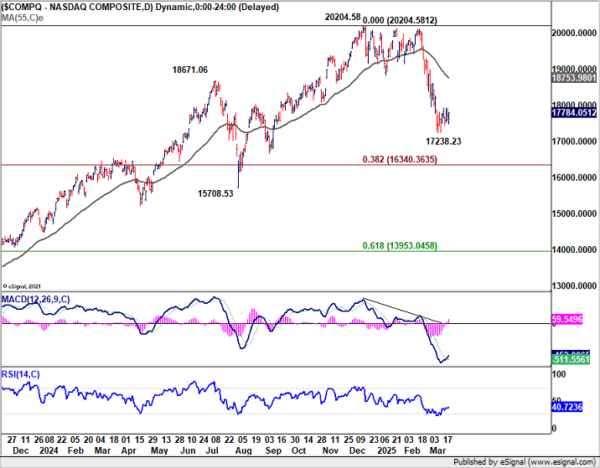
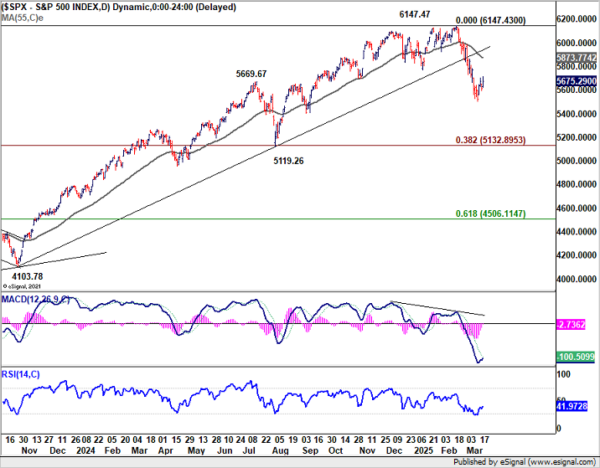
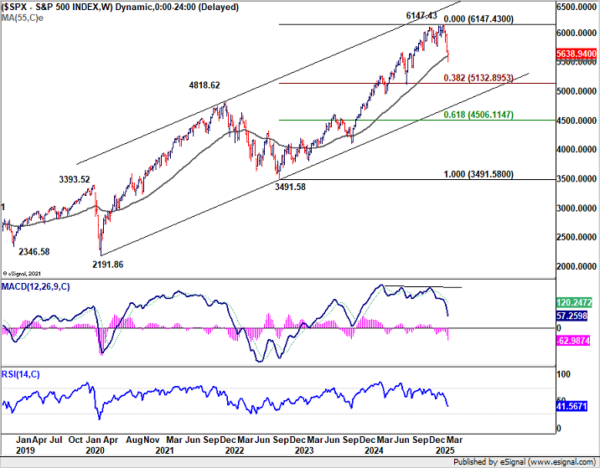
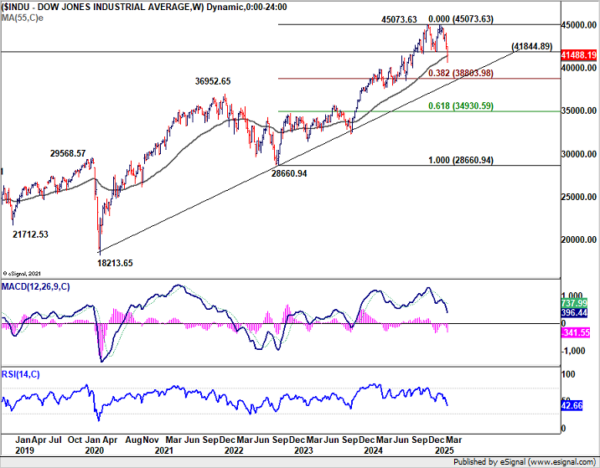
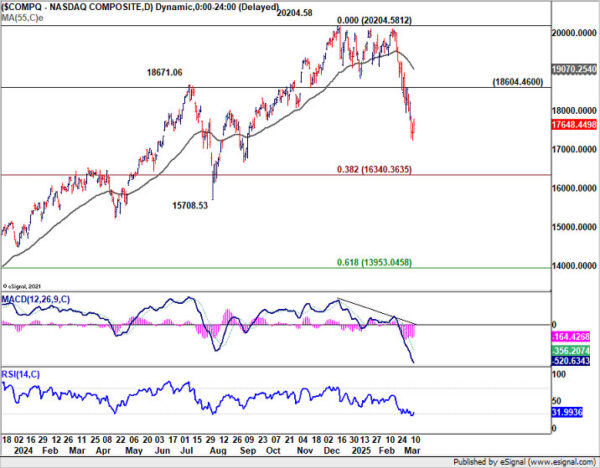
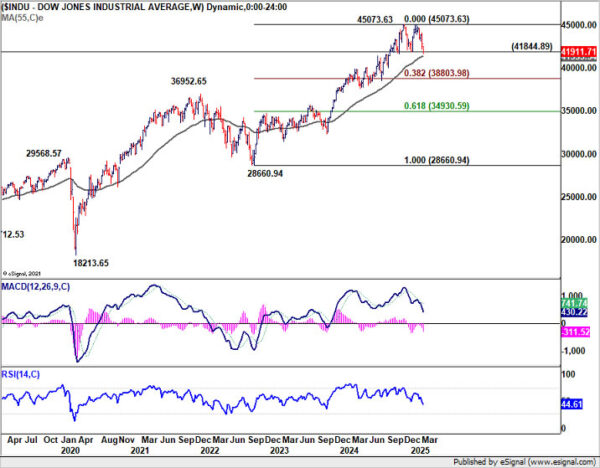
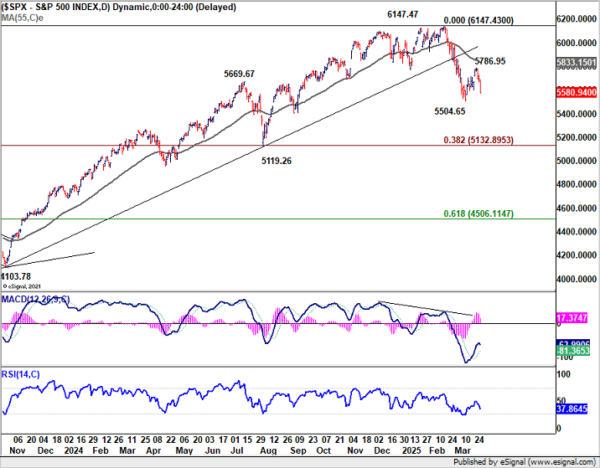
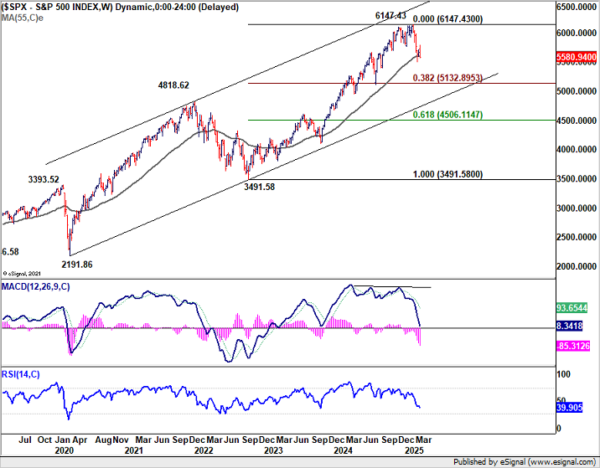
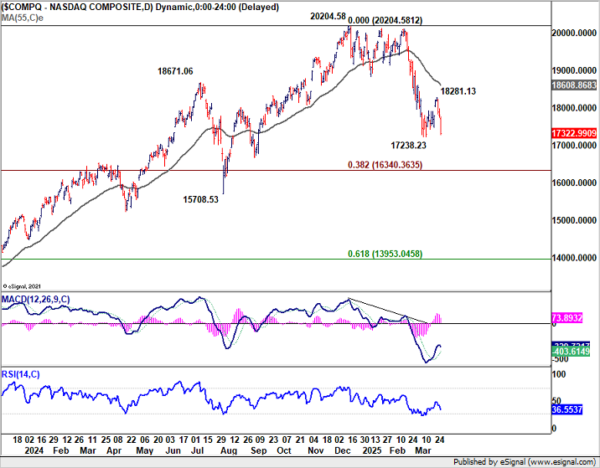
US equities closed out the week with sharp losses, as fears over the looming escalation in trade tensions and persistent inflation sent risk sentiment spiraling. S&P 500 fell -1.53% on the week, while DOW dropped -0.96%. Tech bore the brunt of the selloff, with NASDAQ sliding -2.59%. That puts the NASDAQ on track for a painful monthly decline of over -8%, which would mark its worst monthly performance since December 2022.
The market is being squeezed from two ends. On one side, uncertainty over the scope and scale of US tariffs is weighing on sentiment. On the other, resilient inflation data, especially in core readings, is reinforcing expectations that Fed will keep interest rates higher for longer. Together, these twin pressures are raising fears of a broader slowdown in consumer spending, business investment, and overall economic growth, with the risk of tipping the US into recession.
Trump’s steel and aluminum tariffs have already been in place, but tensions intensified last week as he announced a fresh 25% levy on imported cars and auto parts. That was a mere prelude to what he has dubbed “Liberation Day” on April 2, when the broader reciprocal tariff regime is expected to be unveiled. Stock markets may already be bracing for impact, with traders possibly front-running the announcement, despite the usual quarter-end rebalancing flows.
The broader concern is that even after the April 2 announcement, the tariff saga won’t be over. Canada and the EU are almost certain to respond with retaliations, and China’s stance remains unclear. Others, like the UK and Australia, are expected to hold back. But should retaliation begin to pile up, there is every chance that Trump will double down with even more aggressive measures, setting off a full-blown global trade war.
Still, there is a glimmer of hope. If current market anxiety is more about the “uncertainty” surrounding tariffs rather than the “actual impact” of tariffs themselves, there may be room for a sentiment rebound once the details are made clear — hopefully sometime in Q2.
But that’s a big assumption, and one that relies heavily on the scope, implementation, and global response to the tariffs.
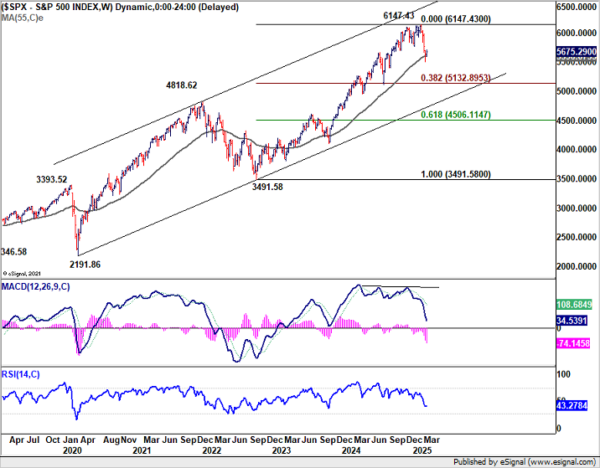
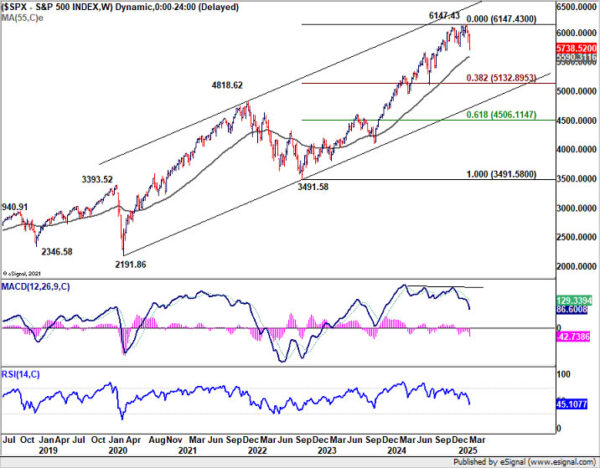
Technically, S&P 500’s rebound from 5504.65 should have completed at 5786.95, ahead of falling 55 D EMA (now at 5833.15). Focus for the next few days will be back on 5504.65 support. Firm break there will resume the corrective decline from 6147.47 high to 38.2% retracement of 3491.58 to 6147.43 at 5132.89. Strong support should be seen there to contain downside and bring rebound, at least on first attempt.
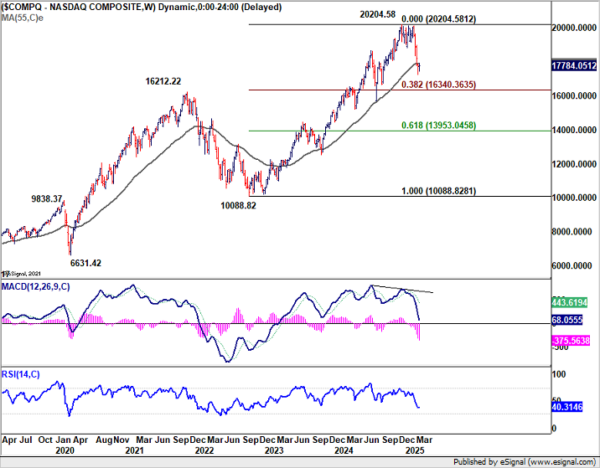
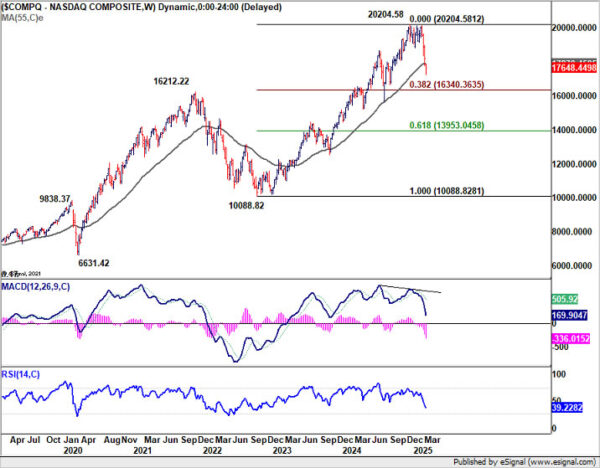
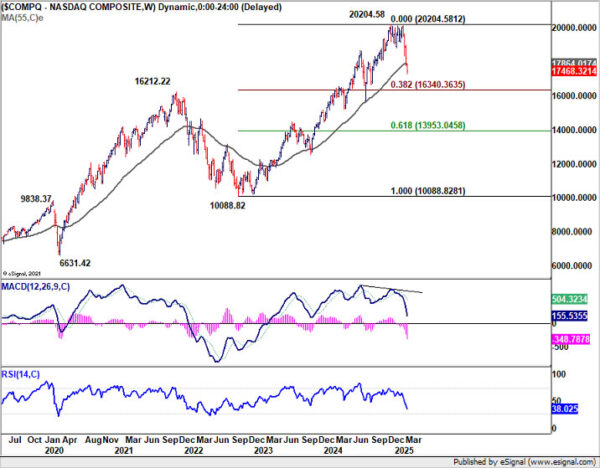
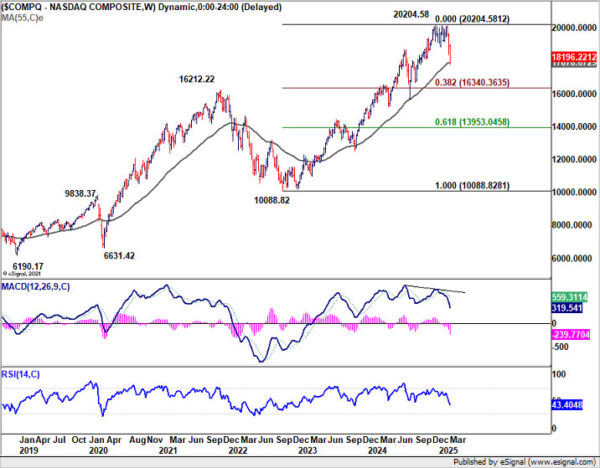
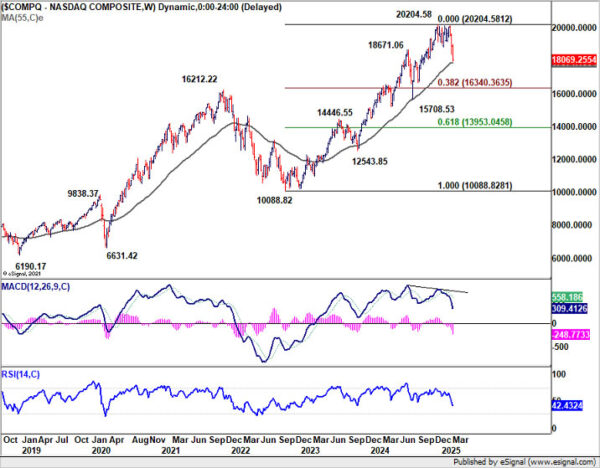
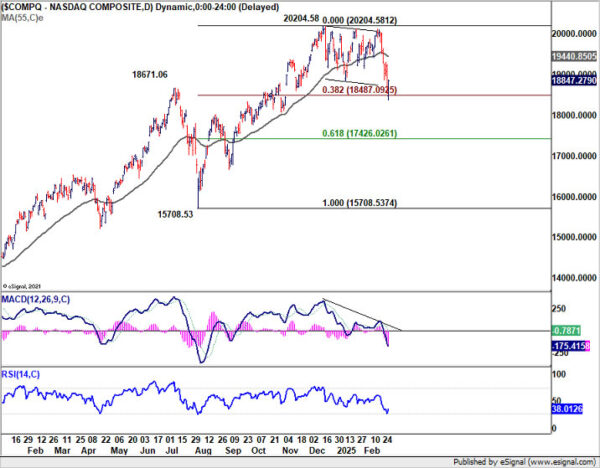
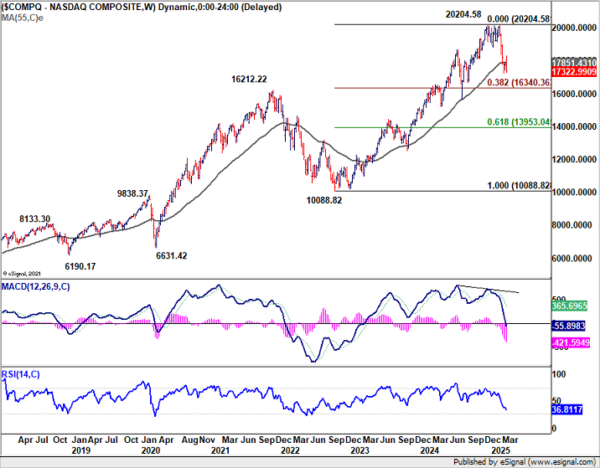
Similarly, NASDAQ’s corrective recovery from 17238.23 should have completed at 18281.13, ahead of falling 55 D EMA (now at 18608.86). Break of 17238.23 in the next week days will resume the corrective fall from 20204.58 to 38.2% retracement of 10088.82 to 20204.58 at 16340.36. Strong support should be seen there to bring rebound, at least on first attempt. However, firm break there will pave the way to 15708.53 support next.
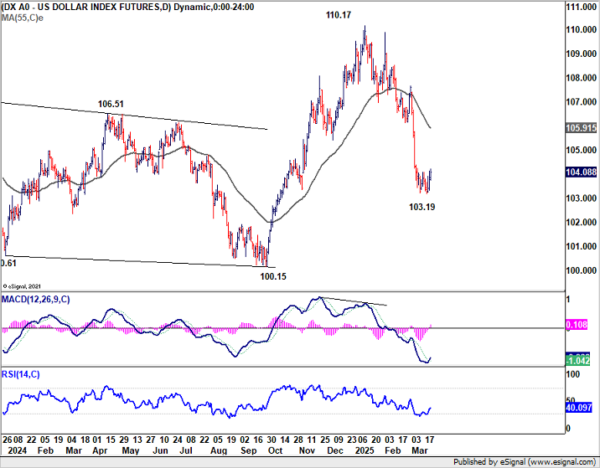
Yields Tumble on Safe Haven Flows, Dollar Index Relatively Resilient
US 10-year Treasury yields fell sharply on Friday, even as core PCE inflation surprised to the upside. The data highlighted persistent inflationary pressures, with the core PCE accelerating to 2.8% yoy, above expectations and well above Fed’s 2% target. Typically, such data would push yields higher as markets price out rate cuts. However, Friday’s yield decline suggests a different narrative dominated—one of risk aversion.
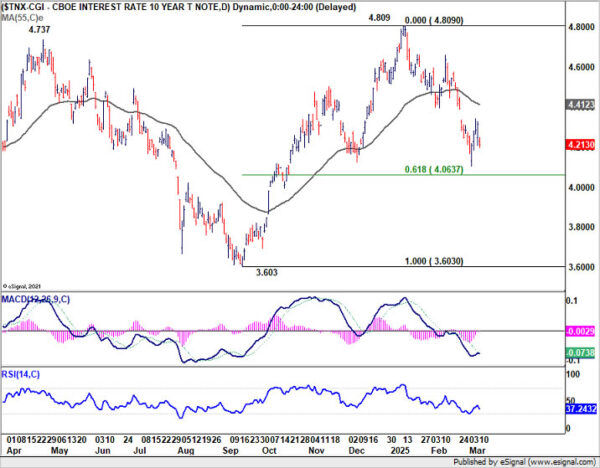
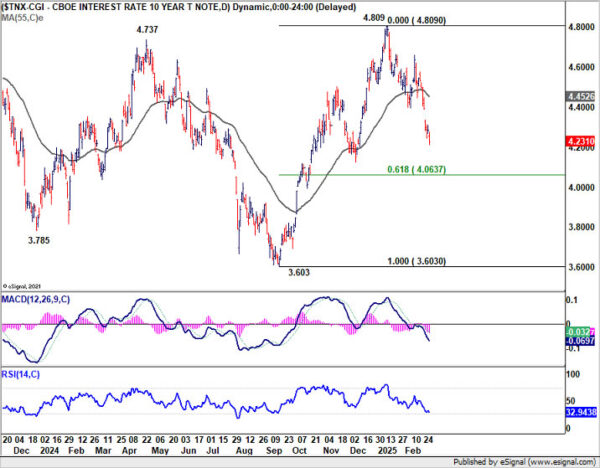
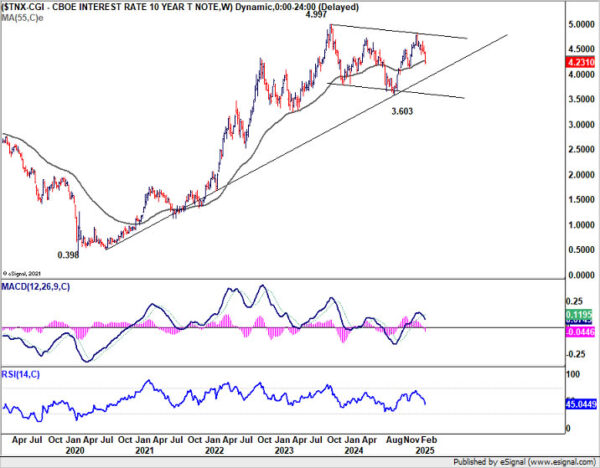
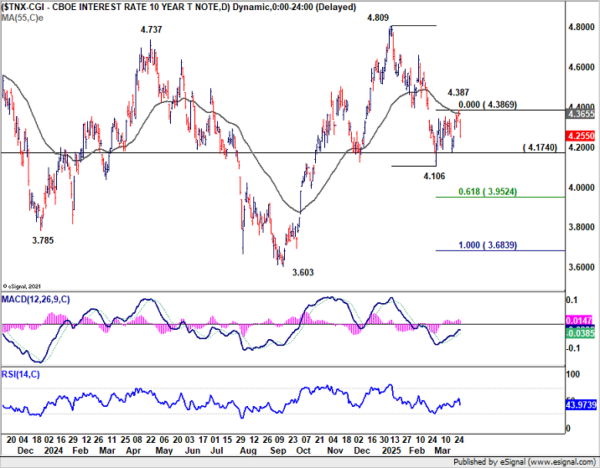
Technically, corrective recovery from 4.106 could have already completed at 4.387 after hitting falling 55 D EMA (now at 4.3650). Break of 4.174 support will argue that the whole decline from 4.809 is ready to resume through 4.106 short term bottom. Next target will then be 61.8% projection of 4.809 to 4.106 from 4.387 at 3.952, which is below 4% psychological level.
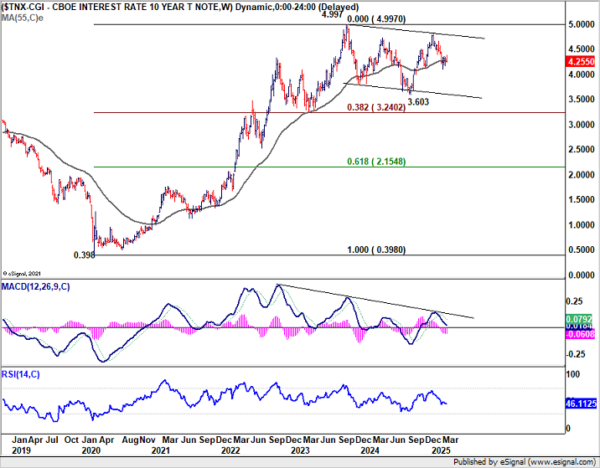
More importantly, the next fall will solidify that decline from 4.809 is another leg inside the medium term pattern from 4.997 (2023 high) with risk of extending to 3.603 (2024 low) and below.
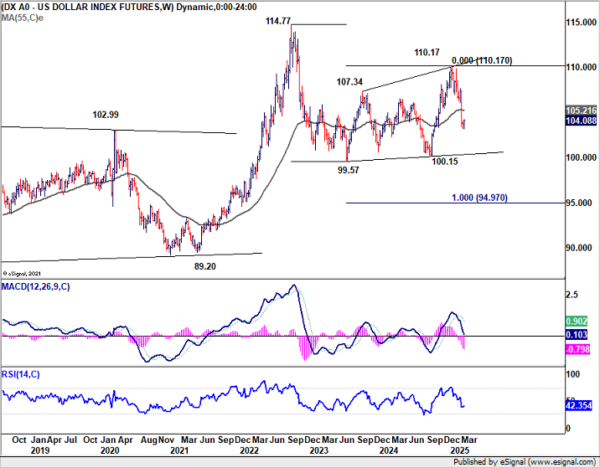
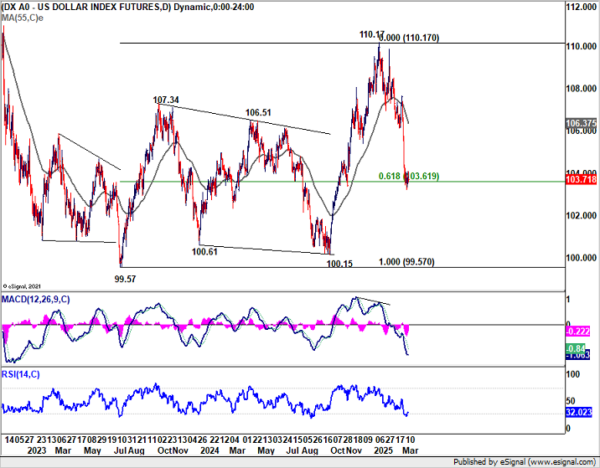
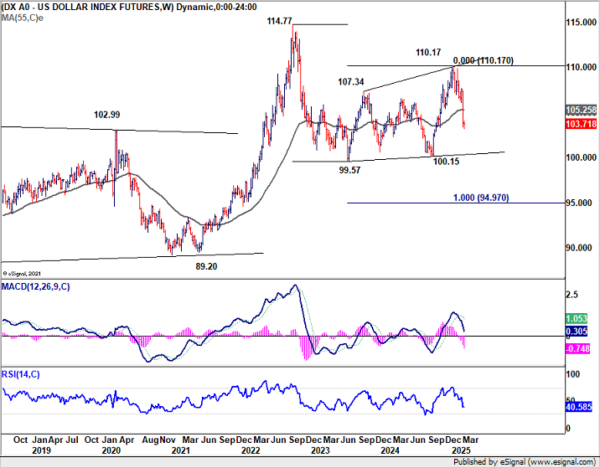
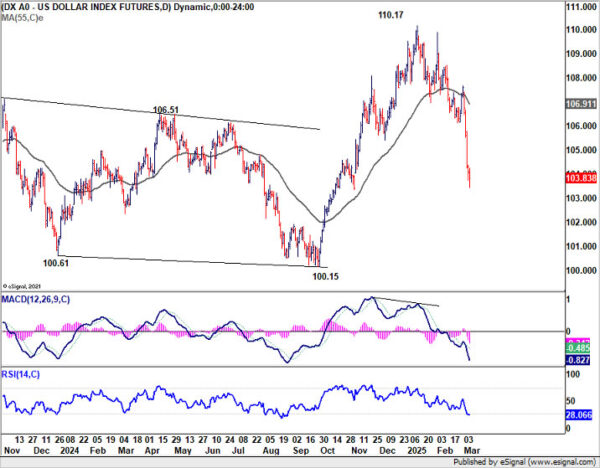
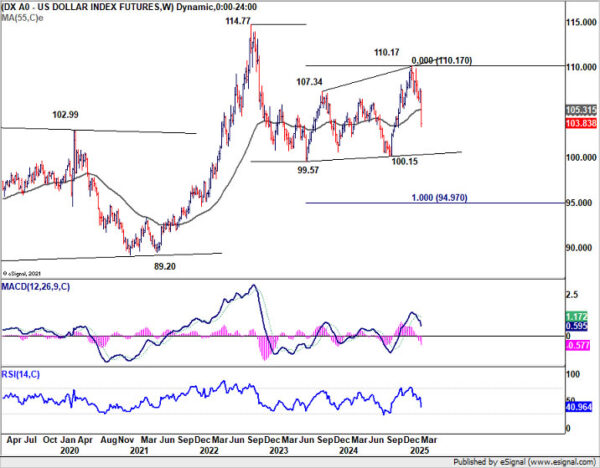
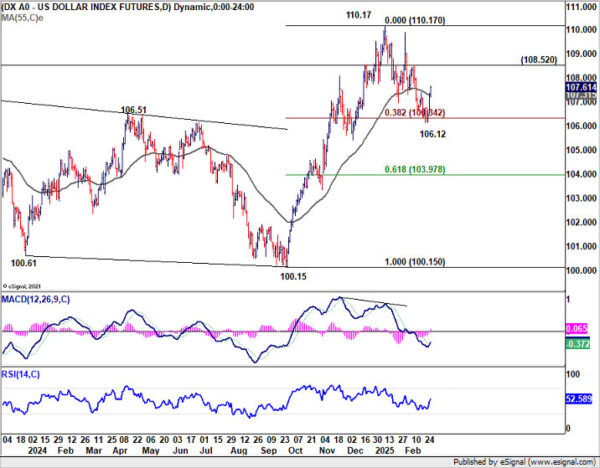
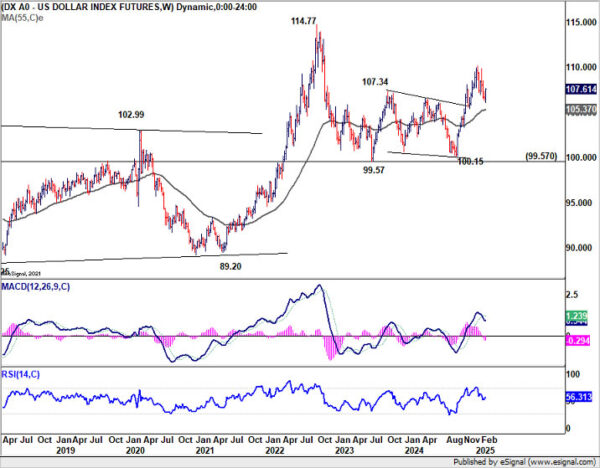
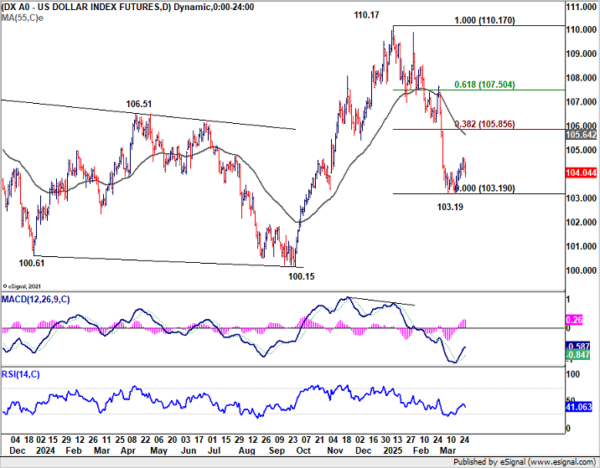
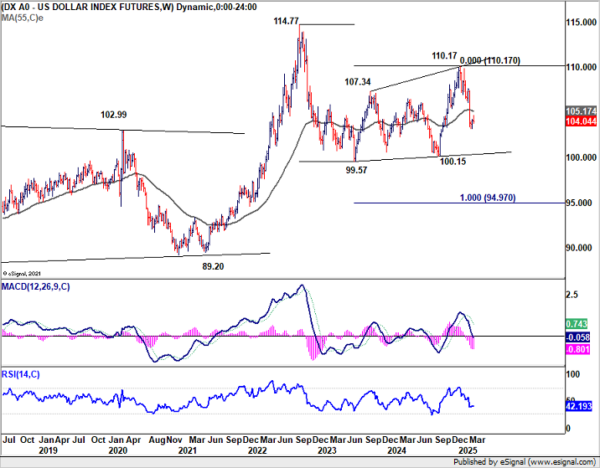
Dollar Index only dipped slightly on Friday and the development argues that corrective recovery from 103.19 might still extend. But even in case of another rise, upside should be limited by 55 D EMA (now at 105.64). Break of 103.19 will resume the fall from 110.17 to 100.15 support next.
Crucially, the next fall will further solidify the case that decline from 110.17 is the third leg of the pattern from 114.77 (2022 high). Break of 100.15 support will pave the way through 99.57 (2023 low) to 100% projection of 114.77 to 99.57 from 110.17 at 94.97.
March Belongs to Europe, But Can Momentum Survive April’s Storm?
Despite rising global trade tensions and the looming threat of reciprocal US tariffs, European currencies and assets have emerged as the standout performers for March. In the equity space, major European indices like Germany’s DAX and the UK’s FTSE have remained relatively insulated from the sharp selloff seen on Wall Street.
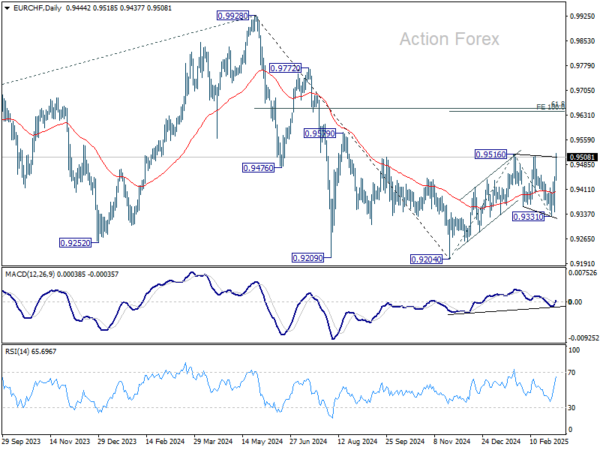
Meanwhile, Euro has led the charge in the currency markets, with Sterling and, to a lesser extent, Swiss Franc following closely. The coming weeks will be critical in determining whether this resilience in European markets can be sustained or even turn into renewed momentum.
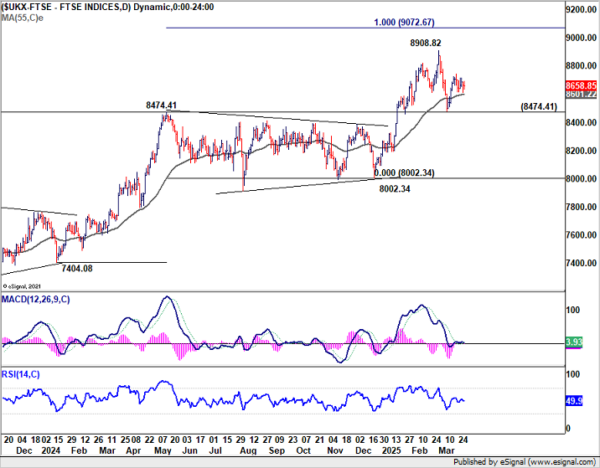
Technically, with 8474.41 resistance turned support intact, FTSE’s price actions from 8908.82 are viewed as a sideway consolidation pattern only. Larger up trend is expected resume through 8908.82 to 100% projection of 7404.08 to 8474.41 from 8002.34 at 9072.67 at a later stage.
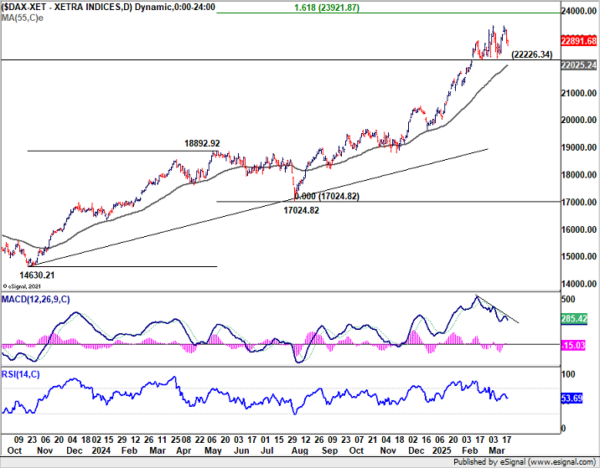
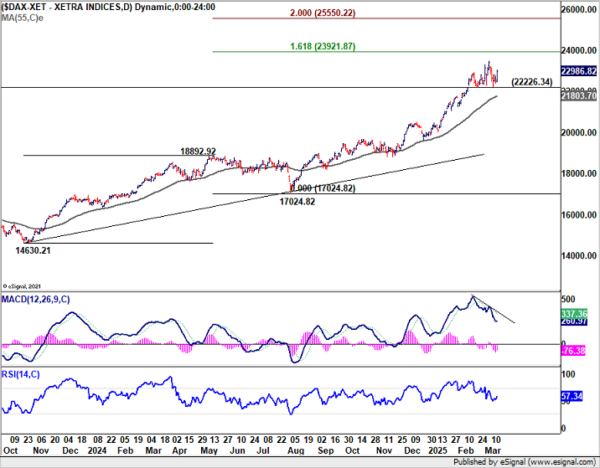
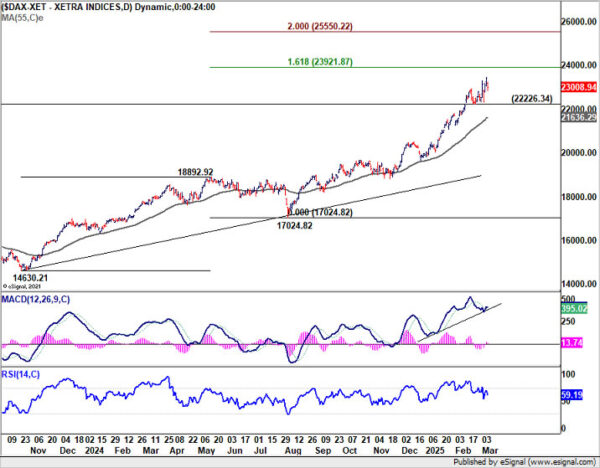
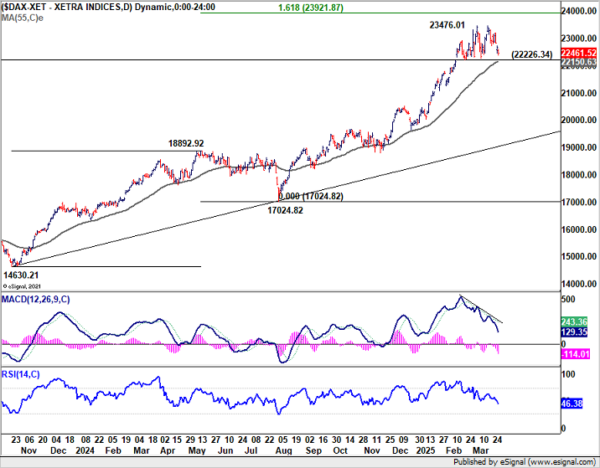
As for the stronger DAX, outlook is staying bullish with 22226.34 support intact, which is close to 55 D EMA (now at 22150.63). Another rise is till expected to 161.8% projection of 14630.21 to 18892.92 from 17024.82 at 23921.87, or even further to 24000 psychological level.
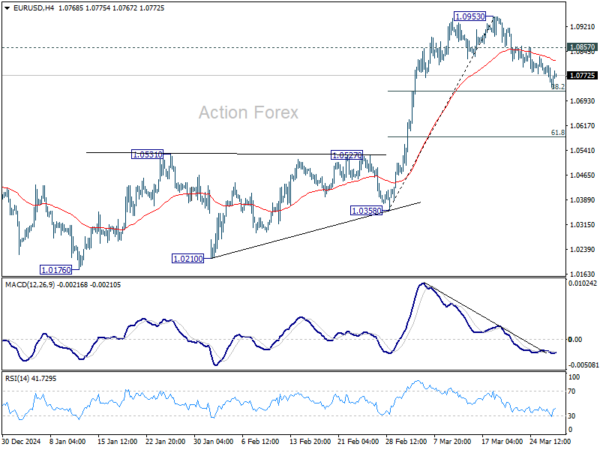
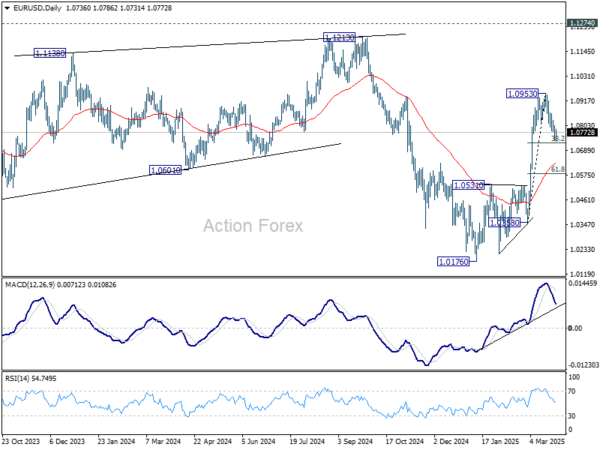
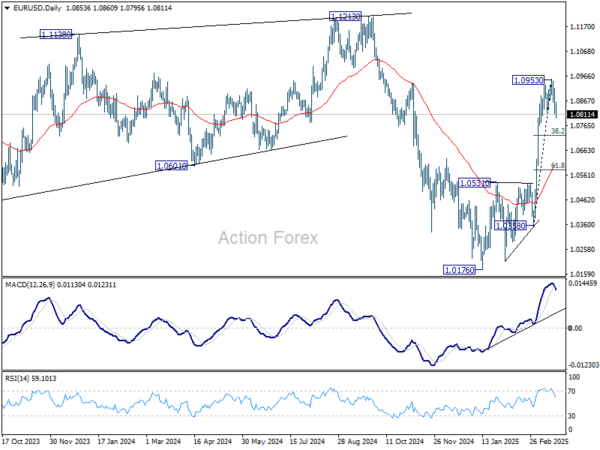
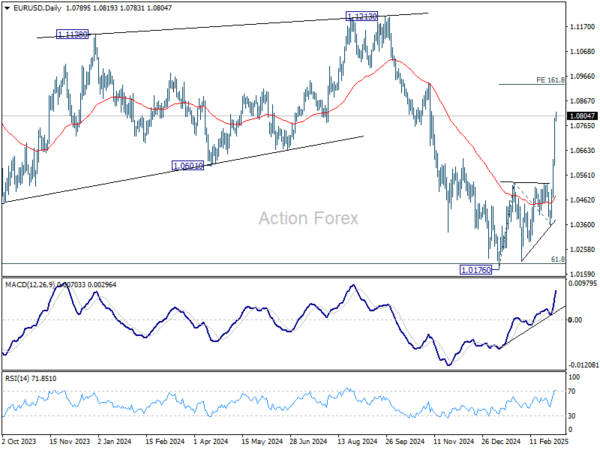
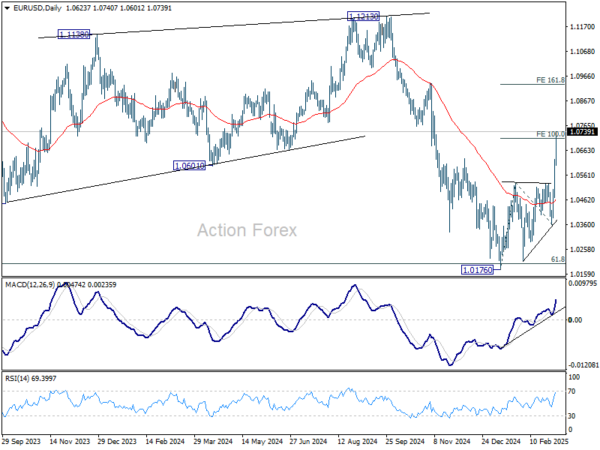
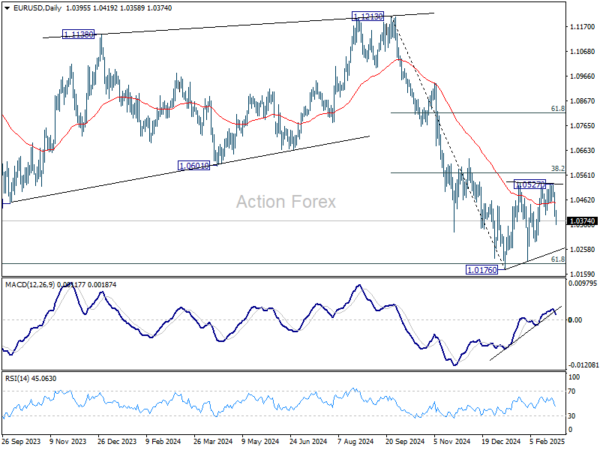
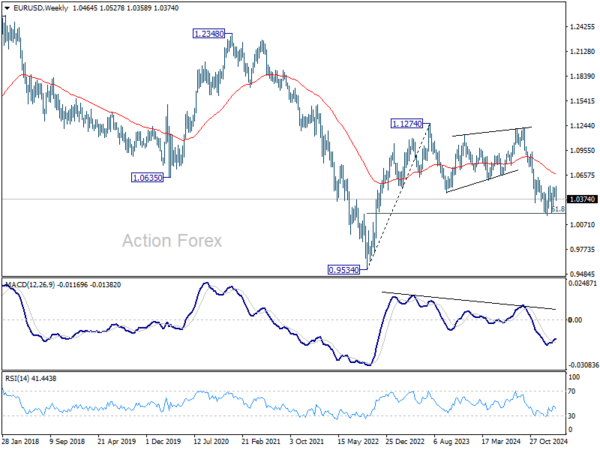
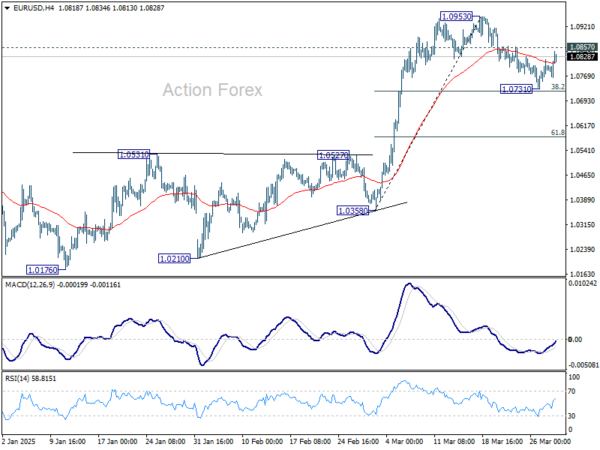
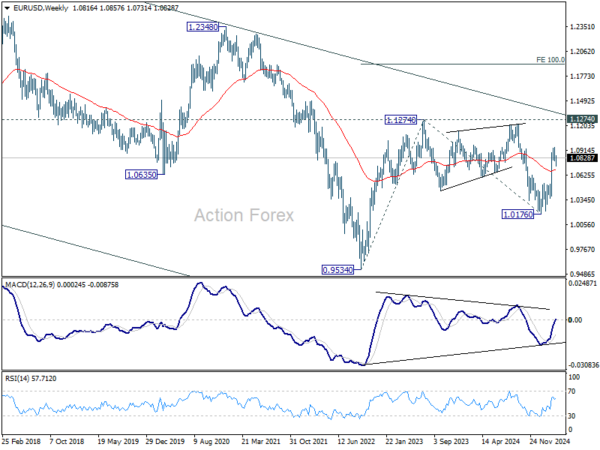
It’s also important for EUR/USD. The near term pull back from 1.0953 could have already completed at 1.0731, ahead of 38.2% retracement of 1.0358 to 1.0953 at 1.0726. Break of 1.0857 minor resistance should affirm this bullish case, and push EUR/USD through 1.0953 to resume the whole rally from 1.0176.
More significantly, the next rally would set up EUR/USD for a test on key resistance between 1.1274 (2023 high) and multi-decade falling channel resistance (now at around 1.1380). This resistance zone is crucial to determine whether EUR/USD is reversing the long term down trend.
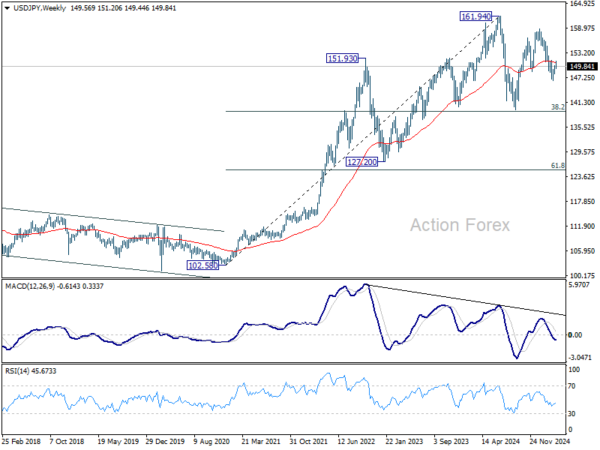
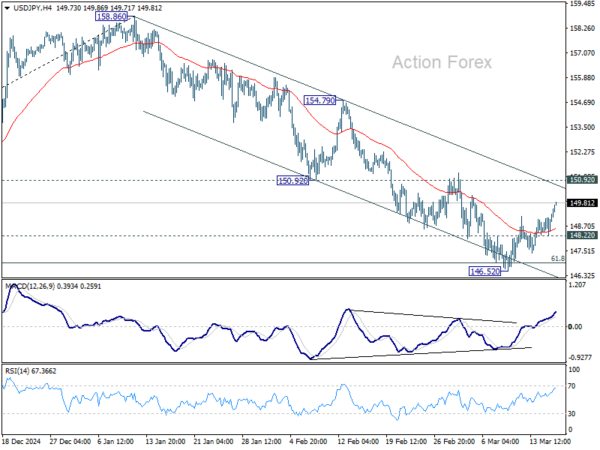
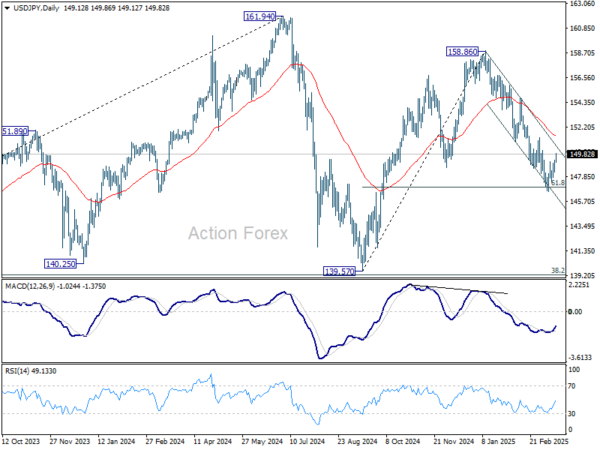
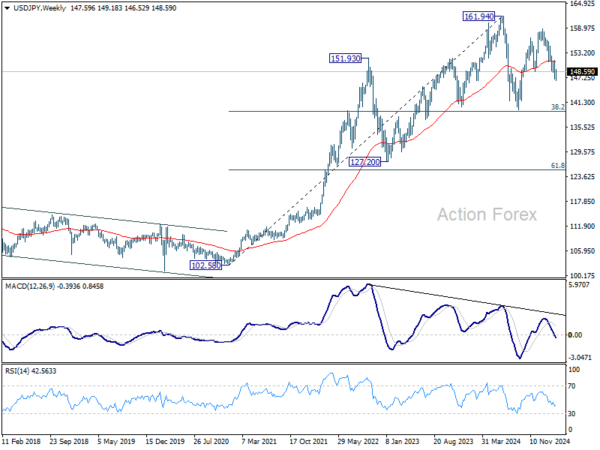
USD/JPY Weekly Outlook
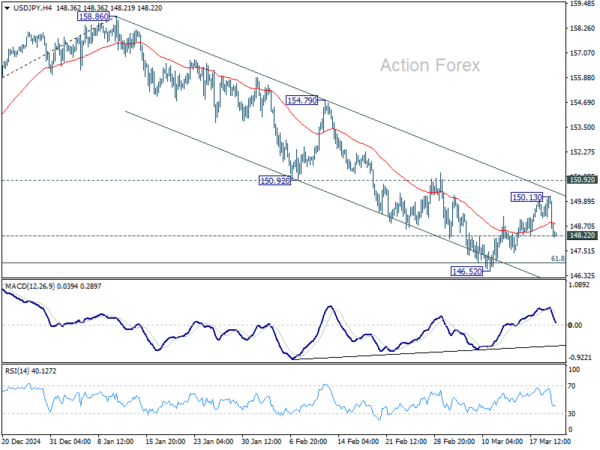
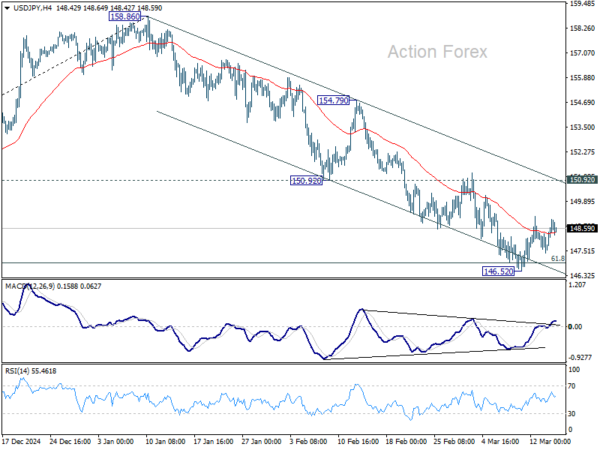
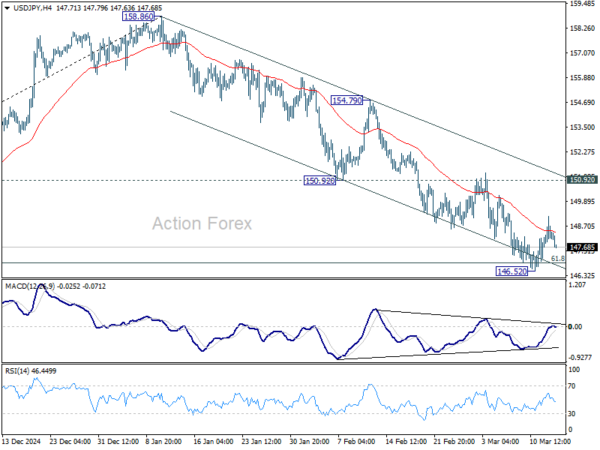
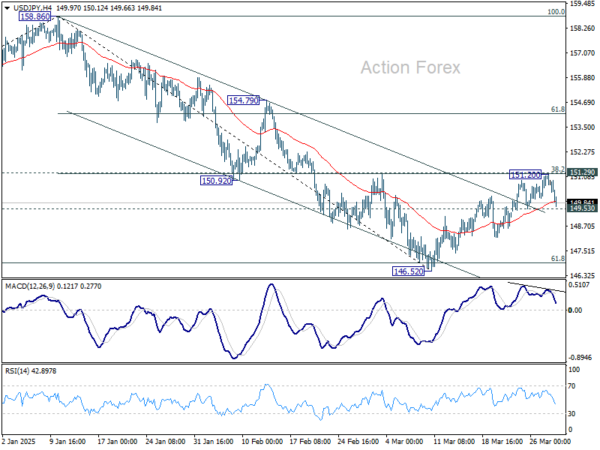
USD/JPY recovered further to 151.20 last week but retreated sharply ahead of 151.29 cluster resistance (38.2% retracement of 158.86 to 146.52 at 151.23). Initial bias remains neutral first and outlook stay bearish. On the downside, below 149.53 minor support will argue that the corrective recovery has completed and bring retest of 146.52 low. Firm break there will resume whole fall from 158.86. However, firm break of 151.23/9 will turn bias back to the upside for 154.79 resistance instead.
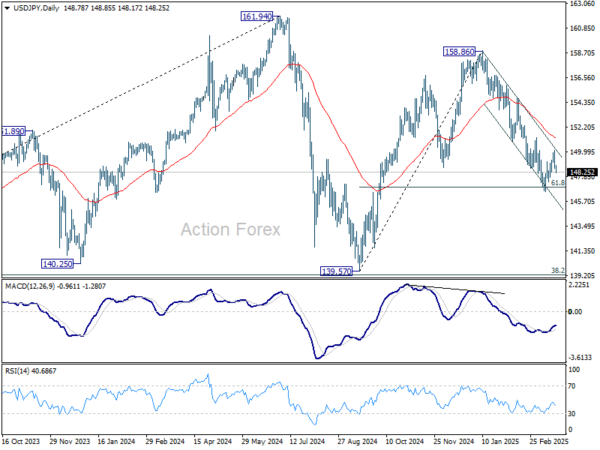
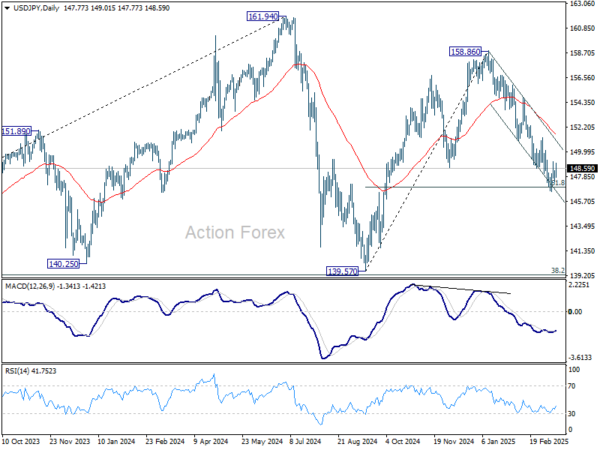
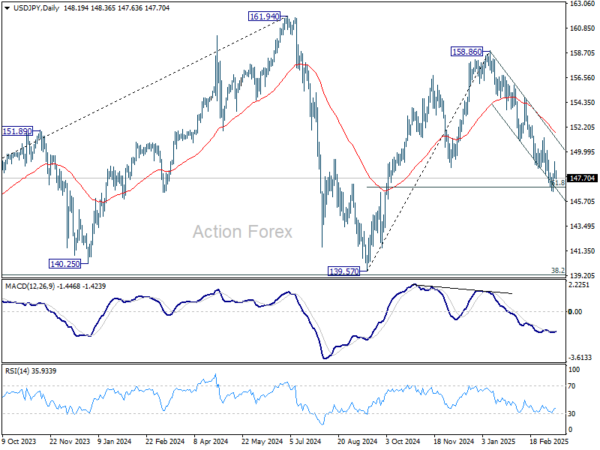
In the bigger picture, price actions from 161.94 are seen as a corrective pattern to rise from 102.58 (2021 low), with fall from 158.86 as the third leg. Strong support should be seen from 38.2% retracement of 102.58 to 161.94 at 139.26 to bring rebound. However, sustained break of 139.26 would open up deeper medium term decline to 61.8% retracement at 125.25.
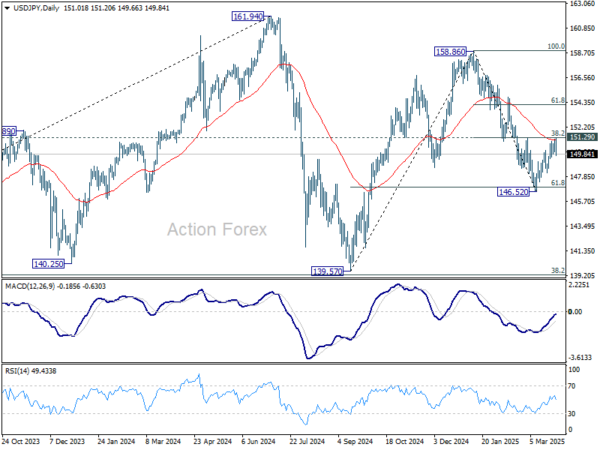
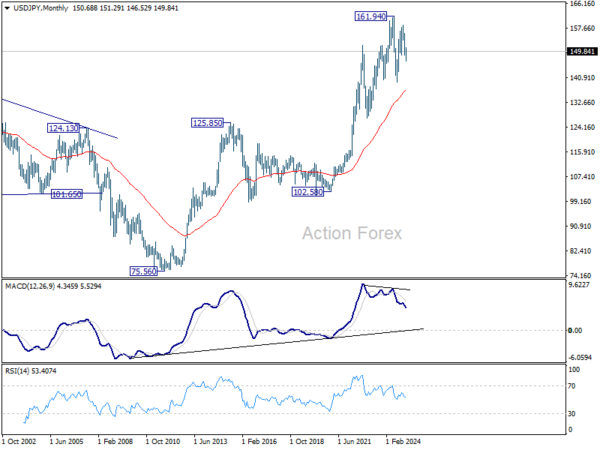
In the long term picture, it’s still early to conclude that up trend from 75.56 (2011 low) has completed. A medium term corrective phase should have commenced, with risk of deep correction towards 55 M EMA (now at 136.94).