Tag: Technical Analysis

  • Gold surges past ,400 on Israel-Iran war risk, soft US inflation boosts safe-haven demand

    Gold surges past $3,400 on Israel-Iran war risk, soft US inflation boosts safe-haven demand


    • Bullion rallies to five-week high amid geopolitical tension and dovish Fed outlook
    • Israel strikes Iran, fueling fears of broader war and driving flight to safety into Gold.
    • XAU/USD hits $3,446 before easing on profit-taking; eyes next week’s Fed decision and US data slate.

    Gold price rallied for the third consecutive day after the Israel-Iran conflict erupted on Friday, triggering a risk-off mood in financial markets as fears that it could escalate loom. At the time of writing, XAU/USD trades at $3,422, up more than 1%.

    Several factors underpin bullion. On Friday, Israel’s attack on Iran’s military installations, nuclear facilities and senior officials augmented tension in the area. After the attack,  XAU/USD reached a five-week high of $3,446 before retreating somewhat to its current levels as traders booked profits ahead of the weekend.

    Softer US CPI and PPI strengthen bets on Fed rate cuts despite improving consumer sentiment

    Another factor was that inflation in the United States (US) continued to ease following the release of the Consumer Price Index (CPI) and the Producer Price Index (PPI) figures for May. Recently, a University of Michigan (UoM) Consumer Sentiment survey revealed that households are becoming more optimistic about the economy, yet they remain worried about higher prices.

    US President Donald Trump hinted that Iran brought the attack on itself, as Washington warned Iran to restrict its nuclear program.

    Next week, traders will be watching the release of the Federal Reserve’s (Fed) monetary policy meeting, where officials will update their economic projections. Besides this, Retail Sales, Industrial Production, housing and jobs data could help dictate Gold’s direction.

    Daily digest market movers: Gold price surges on risk aversion

    • Recently, US President Trump said to Axios that Israel’s attack could help him reach an agreement with Iran. He urged Iran to make a deal, adding, “There has already been great death and destruction, but there is still time to make this slaughter, with the next already planned attacks being even more brutal, come to an end.”
    • The University of Michigan (UoM) Consumer Sentiment report in June showed that households are becoming more optimistic about the economy. The Sentiment Index rose from 52.2 to 60.5, while inflation expectations decreased for both one-year and five-year periods, from 6.6% to 5.1% and from 4.2% to 4.1%, respectively.
    • Although the data is positive and clears the path for the Federal Reserve to ease policy, the escalation of the Middle East conflict pushed Oil prices up by more than 6%. This suggests that Gasoline prices could increase, and that a reacceleration of inflation looms.
    • US Treasury yields are recovering, with the US 10-year Treasury yield climbing over seven basis points (bps) to 4.436%. US real yields followed suit, rising seven basis points to 2.186%, capping Bullion’s advance.
    • The Greenback rises after hitting three-year lows, according to the US Dollar Index (DXY). The DXY, which tracks the value of the Dollar against a basket of peers, is up 0.30% at 98.15 after hitting a multi-year low of 97.60.
    • Goldman Sachs reiterated that the price of Bullion would rise to $3,700 by the end of 2025 and $4,000 by mid-2026. Bank of America (BofA) sees Gold at $4,000 over the next 12 months.
    • Money markets suggest that traders are pricing in 47 basis points of easing toward the end of the year, according to Prime Market Terminal data.

    Source: Prime Market Terminal

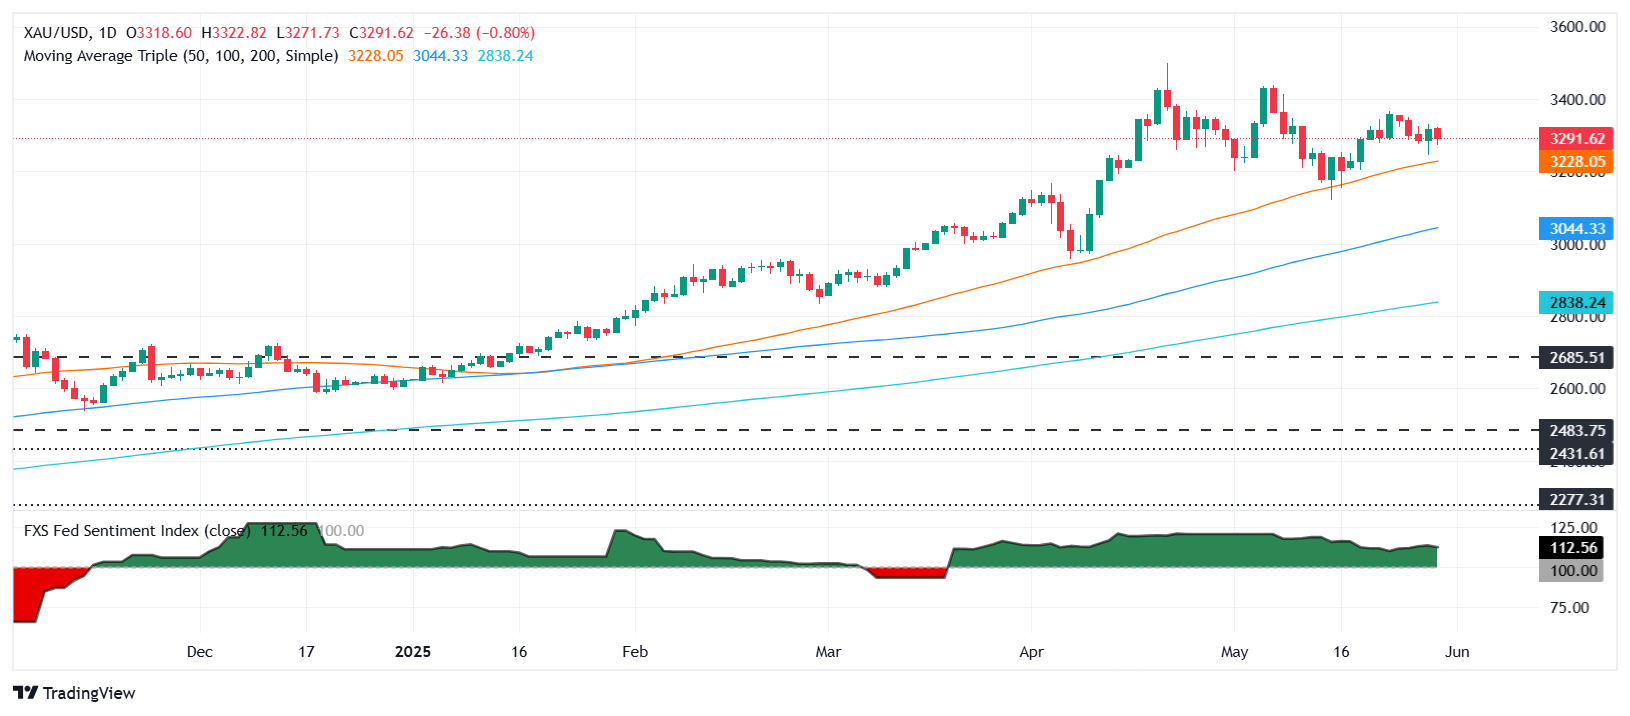
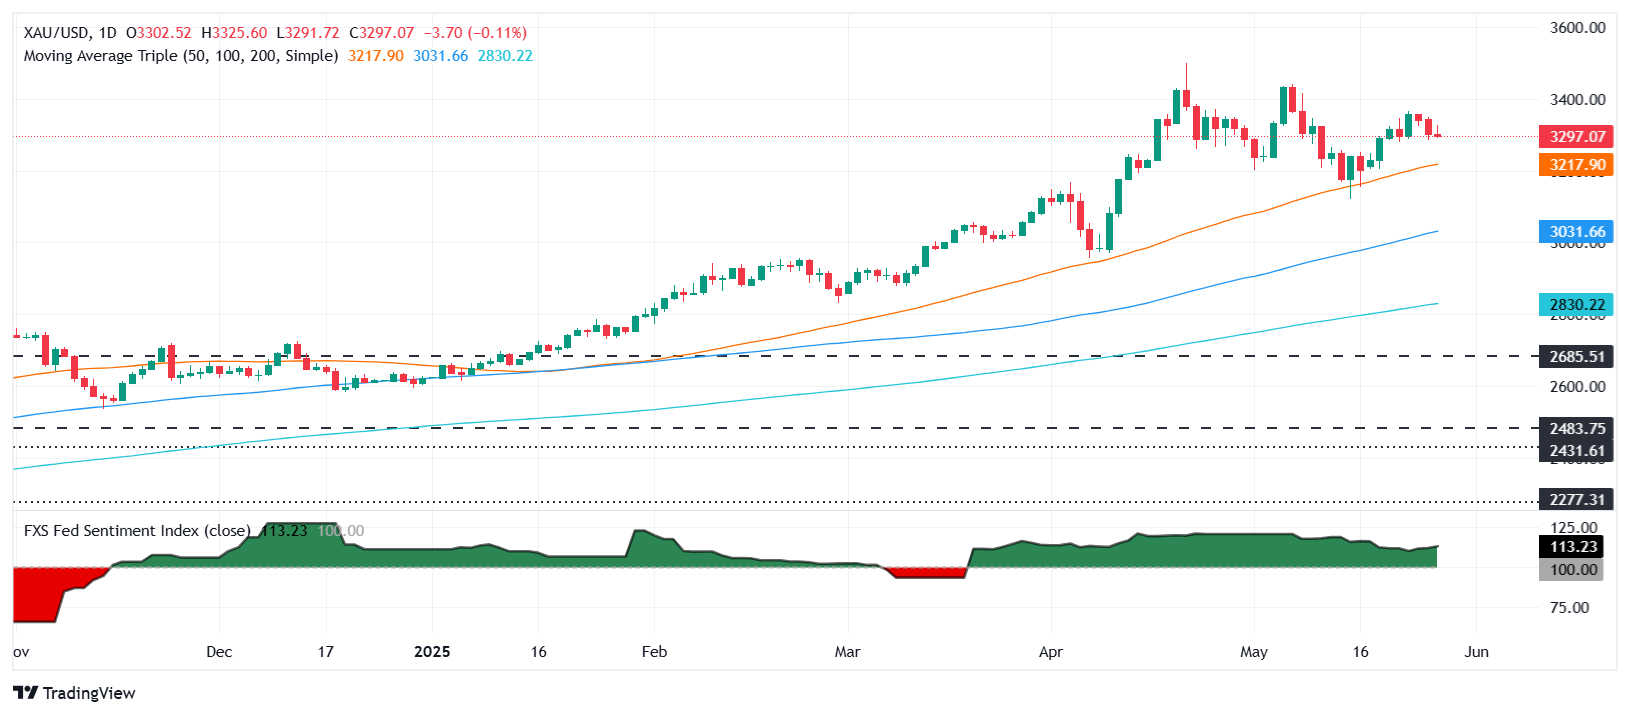
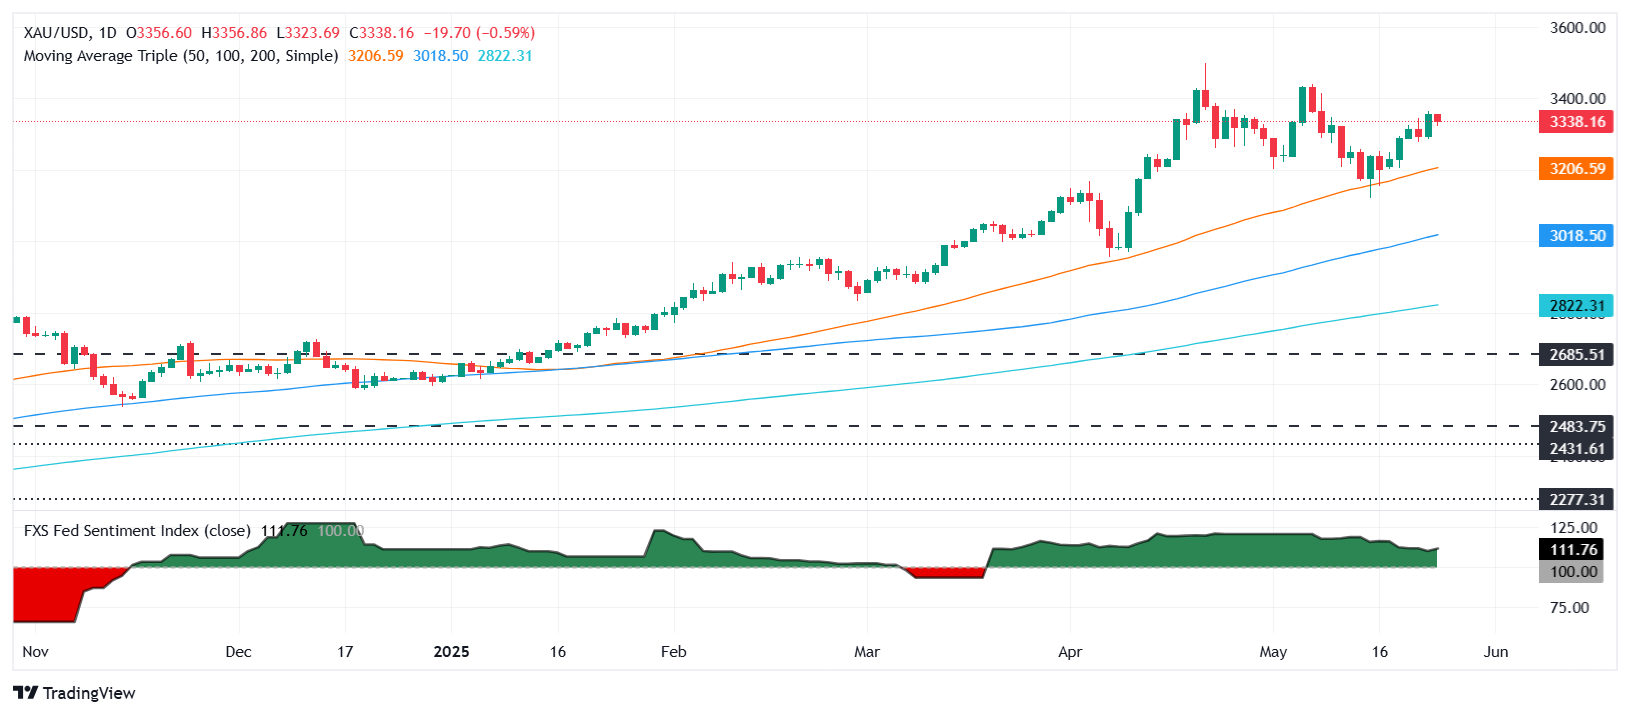
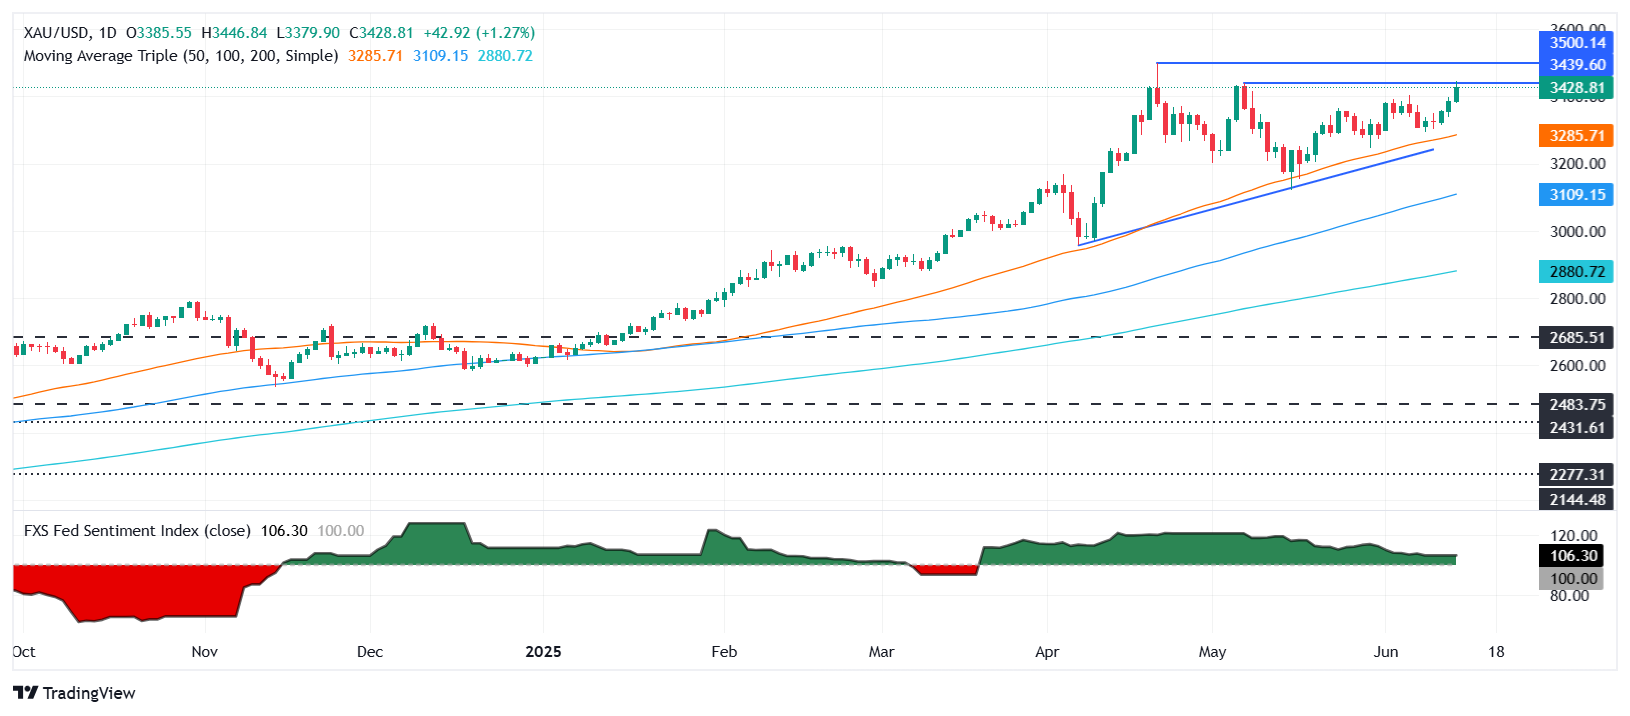
    XAU/USD technical outlook: Gold price consolidates near $3,400

    Gold price is set to extend its gains past the $3,450 figure, clearing the path to challenge the record high of $3,500 in the near term. The Relative Strength Index (RSI) shows that momentum remains bullishly biased, and with that in mind, the path of least resistance is tilted to the upside.

    Conversely, if XAU/USD tumbles below $3,450, the first support would be the $3,400 mark. If it surpasses, the next stop would be the 50-day Simple Moving Average (SMA) at $3,281, ahead of the April 3 high-turned-support at $3,167.

    Gold FAQs

    Gold has played a key role in human’s history as it has been widely used as a store of value and medium of exchange. Currently, apart from its shine and usage for jewelry, the precious metal is widely seen as a safe-haven asset, meaning that it is considered a good investment during turbulent times. Gold is also widely seen as a hedge against inflation and against depreciating currencies as it doesn’t rely on any specific issuer or government.

    Central banks are the biggest Gold holders. In their aim to support their currencies in turbulent times, central banks tend to diversify their reserves and buy Gold to improve the perceived strength of the economy and the currency. High Gold reserves can be a source of trust for a country’s solvency. Central banks added 1,136 tonnes of Gold worth around $70 billion to their reserves in 2022, according to data from the World Gold Council. This is the highest yearly purchase since records began. Central banks from emerging economies such as China, India and Turkey are quickly increasing their Gold reserves.

    Gold has an inverse correlation with the US Dollar and US Treasuries, which are both major reserve and safe-haven assets. When the Dollar depreciates, Gold tends to rise, enabling investors and central banks to diversify their assets in turbulent times. Gold is also inversely correlated with risk assets. A rally in the stock market tends to weaken Gold price, while sell-offs in riskier markets tend to favor the precious metal.

    The price can move due to a wide range of factors. Geopolitical instability or fears of a deep recession can quickly make Gold price escalate due to its safe-haven status. As a yield-less asset, Gold tends to rise with lower interest rates, while higher cost of money usually weighs down on the yellow metal. Still, most moves depend on how the US Dollar (USD) behaves as the asset is priced in dollars (XAU/USD). A strong Dollar tends to keep the price of Gold controlled, whereas a weaker Dollar is likely to push Gold prices up.


    Source link

  • EUR: Not liking the oil rally – ING

    EUR: Not liking the oil rally – ING


    The Euro (EUR) generally dislikes geopolitical shocks leading to higher energy prices, and has therefore detached from JPY and CHF in early price action after the Israeli strike on Iran.


    Source link

  • EUR/USD extends gains on dovish US CPI, flirts with 1.15

    EUR/USD extends gains on dovish US CPI, flirts with 1.15


    • EUR/USD advances as lower US inflation sparks calls for aggressive Fed rate cuts.
    • Trump urges full percentage point cut in Fed funds rate post-CPI.
    • ECB policymakers cautious, but inflation outlook hints at further fine-tuning.

    The EUR/USD surged during the North American session but remains shy of clearing the 1.1500 figure, following the release of a softer-than-expected inflation report in the United States (US), which could prompt the Federal Reserve (Fed) to reduce borrowing costs in the near term. At the time of writing, the pair trades at 1.1482, up by over 0.50%.

    US data revealed that the Consumer Price Index (CPI) in May fell short of estimates as prices continued to trend lower. Following the data release, US President Donald Trump posted on his social network that the Fed should lower the fed funds rate by one whole percentage point.

    Although inflation edged lower, some analysts project that households in the upcoming month will feel the impact of tariffs. Meanwhile, positive trade news regarding negotiations between the US and China emerged, as the Wall Street Journal (WSJ) revealed that China is putting a six-month limit on rare-earth export licenses for US automakers and manufacturers.

    Meanwhile, in the Eurozone (EU), European Central Bank (ECB) policymakers made headlines, although they failed to move the EUR/USD pair. The ECB’s Vujcic said that he is looking for more clarity on trade, while Kazaks noted that it is “quite likely that 2% inflation will require some further cuts for fine-tuning,” said via Econostream on X.

    The ECB Chief Economist, Philip Lane, added that last week’s rate cut helped clarify the bank’s policy stance to bring inflation toward its target.

    Ahead in the week, the EUR/USD is expected to be greatly influenced by the release of the US Producer Price Index (PPI) numbers, along with the Initial Jobless Claims report. Across the pond, the EU’s schedule is scarce on economic data, but ECB officials led by Vice-President Luis de Guindos will cross the wires.

    Euro PRICE This week

    The table below shows the percentage change of Euro (EUR) against listed major currencies this week. Euro was the strongest against the US Dollar.

    USD EUR GBP JPY CAD AUD NZD CHF
    USD -0.85% -0.19% -0.32% -0.19% -0.12% -0.23% -0.28%
    EUR 0.85% 0.65% 0.51% 0.65% 0.76% 0.62% 0.56%
    GBP 0.19% -0.65% -0.04% 0.00% 0.12% -0.03% -0.08%
    JPY 0.32% -0.51% 0.04% 0.12% 0.15% 0.03% -0.08%
    CAD 0.19% -0.65% -0.01% -0.12% 0.06% -0.04% -0.09%
    AUD 0.12% -0.76% -0.12% -0.15% -0.06% -0.14% -0.19%
    NZD 0.23% -0.62% 0.03% -0.03% 0.04% 0.14% -0.05%
    CHF 0.28% -0.56% 0.08% 0.08% 0.09% 0.19% 0.05%

    The heat map shows percentage changes of major currencies against each other. The base currency is picked from the left column, while the quote currency is picked from the top row. For example, if you pick the Euro from the left column and move along the horizontal line to the US Dollar, the percentage change displayed in the box will represent EUR (base)/USD (quote).

    Daily digest market movers: EUR/USD soars past 1.1480 as traders shift toward US PPI data

    • EUR/USD appears poised to test the 1.1500 mark in the near term as positive news about US-China talks could increase appetite for riskier assets and weigh on the US Dollar.
    • US Treasury Secretary Scott Bessent commented that trade fairness with China could be achieved through reduced exports to the US or by rebalancing the world’s largest economies. He added that the Trump administration is committed to maintaining the US Dollar’s reserve currency status.
    • US inflation came in softer than expected in May. Headline CPI rose 2.4% YoY, slightly above April’s 2.3% but below the 2.5% forecast. Core CPI held steady at 2.8% YoY, suggesting underlying inflation remains stable but persistent.
    • The PPI for May is projected to increase from 2.4% to 2.6% YoY. Underlying PPI figures are expected to remain at 3.1% higher, unchanged compared to April’s print.
    • Financial market players do not expect that the ECB would reduce its Deposit Facility Rate by 25 basis points (bps) at the July monetary policy meeting.

    Euro technical outlook: EUR/USD bulls eyes 1.15 and the YTD high

    From a technical perspective, the uptrend is expected to continue as buyers target a clear break above the 1.1500 figure. This will expose the year-to-date (YTD) high of 1.1572, ahead of 1.1600. The Relative Strength Index (RSI) is bullish, indicating an upward direction, which suggests that buyers are gaining momentum.

    The less likely scenario on the downside is that the EUR/USD needs to clear the 1.1450 area. This would set the pair for a pullback toward the 20-day Simple Moving Average (SMA) at 1.1346 before testing 1.1300.

    ECB FAQs

    The European Central Bank (ECB) in Frankfurt, Germany, is the reserve bank for the Eurozone. The ECB sets interest rates and manages monetary policy for the region.
    The ECB primary mandate is to maintain price stability, which means keeping inflation at around 2%. Its primary tool for achieving this is by raising or lowering interest rates. Relatively high interest rates will usually result in a stronger Euro and vice versa.
    The ECB Governing Council makes monetary policy decisions at meetings held eight times a year. Decisions are made by heads of the Eurozone national banks and six permanent members, including the President of the ECB, Christine Lagarde.

    In extreme situations, the European Central Bank can enact a policy tool called Quantitative Easing. QE is the process by which the ECB prints Euros and uses them to buy assets – usually government or corporate bonds – from banks and other financial institutions. QE usually results in a weaker Euro.
    QE is a last resort when simply lowering interest rates is unlikely to achieve the objective of price stability. The ECB used it during the Great Financial Crisis in 2009-11, in 2015 when inflation remained stubbornly low, as well as during the covid pandemic.

    Quantitative tightening (QT) is the reverse of QE. It is undertaken after QE when an economic recovery is underway and inflation starts rising. Whilst in QE the European Central Bank (ECB) purchases government and corporate bonds from financial institutions to provide them with liquidity, in QT the ECB stops buying more bonds, and stops reinvesting the principal maturing on the bonds it already holds. It is usually positive (or bullish) for the Euro.


    Source link

  • GBP/USD climbs as US CPI miss fuels Fed rate cut bets

    GBP/USD climbs as US CPI miss fuels Fed rate cut bets


    GBP/USD climbs as US CPI miss fuels Fed rate cut bets

    GBP/USD holds above 1.3500 as USD loses strength after CPI

    Pound Sterling edges lower against US Dollar ahead of US inflation data


    Information on these pages contains forward-looking statements that involve risks and uncertainties. Markets and instruments profiled on this page are for informational purposes only and should not in any way come across as a recommendation to buy or sell in these assets. You should do your own thorough research before making any investment decisions. FXStreet does not in any way guarantee that this information is free from mistakes, errors, or material misstatements. It also does not guarantee that this information is of a timely nature. Investing in Open Markets involves a great deal of risk, including the loss of all or a portion of your investment, as well as emotional distress. All risks, losses and costs associated with investing, including total loss of principal, are your responsibility. The views and opinions expressed in this article are those of the authors and do not necessarily reflect the official policy or position of FXStreet nor its advertisers. The author will not be held responsible for information that is found at the end of links posted on this page.

    If not otherwise explicitly mentioned in the body of the article, at the time of writing, the author has no position in any stock mentioned in this article and no business relationship with any company mentioned. The author has not received compensation for writing this article, other than from FXStreet.

    FXStreet and the author do not provide personalized recommendations. The author makes no representations as to the accuracy, completeness, or suitability of this information. FXStreet and the author will not be liable for any errors, omissions or any losses, injuries or damages arising from this information and its display or use. Errors and omissions excepted.

    The author and FXStreet are not registered investment advisors and nothing in this article is intended to be investment advice.


    Source link

  • GBP/USD slips as strong US jobs data cools Fed rate cut bets

    GBP/USD slips as strong US jobs data cools Fed rate cut bets


    • Sterling still set for weekly gain over 0.80% amid broad Greenback weakness earlier in the week.
    • US economy added 139K jobs in May, beating forecasts and reinforcing Fed’s cautious stance on rate cuts.
    • Dollar strength resurfaces, with DXY climbing 0.58% to 99.28, its highest in two days.

    GBP/USD tumbled during the North American session, down over 0.30% after the latest jobs report in the United States (US) maintained the status quo, with the economy remaining strong. The pair traded at 1.3526 after hitting a daily high of 1.3586.

    Pound retreats below 1.3550 after NFP beats estimates, lifting the US Dollar and dampening dovish expectations

    US Nonfarm Payroll figures in May exceeded estimates of 130K, rising by 139K, which was below April’s downwardly revised 147K. Although the jobs market shows that it’s softening, beating economists’ estimates, it pushed aside traders’ bets that the US Federal Reserve (Fed) will cut interest rates in 2025.

    The data revealed that the Unemployment Rate remained unchanged at 4.2%, and that the Federal Government cut 10,000 jobs in the past month.

    A scarce economic docket in the UK, kept GBP/USD traders leaning onto US news. In addition, Sterling is poised to post gains of over 0.80% in the week, sponsored fy broad UA Dollar weakness.

    Despite this, the buck has recovered some ground, as depicted by the US Dollar Index (DXY). The DXY, which tracks the value of the American dollar against a basket of six currencies, climbed 0.58% to 99.28, its highest level in two days.

    Next week, the UK economic docket will feature jobs data and gross Domestic Product (GDP) figures for April. Across the pond, the US schedule will announce the latest Consumer Price Index (CPI), followed by the Producer Price Index (PPI) and the University of Michigan Consumer Sentiment.

    British Pound PRICE This week

    The table below shows the percentage change of British Pound (GBP) against listed major currencies this week. British Pound was the strongest against the Japanese Yen.

    USD EUR GBP JPY CAD AUD NZD CHF
    USD -0.32% -0.40% 0.75% -0.35% -0.75% -0.76% 0.08%
    EUR 0.32% -0.08% 1.07% -0.03% -0.43% -0.46% 0.39%
    GBP 0.40% 0.08% 1.22% 0.05% -0.35% -0.38% 0.46%
    JPY -0.75% -1.07% -1.22% -1.09% -1.49% -1.51% -0.76%
    CAD 0.35% 0.03% -0.05% 1.09% -0.40% -0.43% 0.42%
    AUD 0.75% 0.43% 0.35% 1.49% 0.40% 0.02% 0.90%
    NZD 0.76% 0.46% 0.38% 1.51% 0.43% -0.02% 0.85%
    CHF -0.08% -0.39% -0.46% 0.76% -0.42% -0.90% -0.85%

    The heat map shows percentage changes of major currencies against each other. The base currency is picked from the left column, while the quote currency is picked from the top row. For example, if you pick the British Pound from the left column and move along the horizontal line to the US Dollar, the percentage change displayed in the box will represent GBP (base)/USD (quote).

    GBP/USD Price Forecast: Technical outlook

    The trend remains up, as GBP/USD buyers tested the 20-day Simple Moving Average (SMA) at 1.3509. If this level holds, the pair’s direction would likely resume in the short term after making successive series of higher highs and higher lows, warranting further upside.

    However, momentum has taken a hit. The Relative Strength Index (RSI) is aiming lower, hints that sellers are moving in.

    If GBP/USD stays above 1.3500, this opens the door for a move to 1.3584 today’s high, followed by the year-to-date (YTD) high at 1.3616. On the other hand, a daily close below 1.35 could sponsor a drop towards April’s 28 sing high turned support at 1.3443 ahead of the 1.34 mark.

    Pound Sterling FAQs

    The Pound Sterling (GBP) is the oldest currency in the world (886 AD) and the official currency of the United Kingdom. It is the fourth most traded unit for foreign exchange (FX) in the world, accounting for 12% of all transactions, averaging $630 billion a day, according to 2022 data.
    Its key trading pairs are GBP/USD, also known as ‘Cable’, which accounts for 11% of FX, GBP/JPY, or the ‘Dragon’ as it is known by traders (3%), and EUR/GBP (2%). The Pound Sterling is issued by the Bank of England (BoE).

    The single most important factor influencing the value of the Pound Sterling is monetary policy decided by the Bank of England. The BoE bases its decisions on whether it has achieved its primary goal of “price stability” – a steady inflation rate of around 2%. Its primary tool for achieving this is the adjustment of interest rates.
    When inflation is too high, the BoE will try to rein it in by raising interest rates, making it more expensive for people and businesses to access credit. This is generally positive for GBP, as higher interest rates make the UK a more attractive place for global investors to park their money.
    When inflation falls too low it is a sign economic growth is slowing. In this scenario, the BoE will consider lowering interest rates to cheapen credit so businesses will borrow more to invest in growth-generating projects.

    Data releases gauge the health of the economy and can impact the value of the Pound Sterling. Indicators such as GDP, Manufacturing and Services PMIs, and employment can all influence the direction of the GBP.
    A strong economy is good for Sterling. Not only does it attract more foreign investment but it may encourage the BoE to put up interest rates, which will directly strengthen GBP. Otherwise, if economic data is weak, the Pound Sterling is likely to fall.

    Another significant data release for the Pound Sterling is the Trade Balance. This indicator measures the difference between what a country earns from its exports and what it spends on imports over a given period.
    If a country produces highly sought-after exports, its currency will benefit purely from the extra demand created from foreign buyers seeking to purchase these goods. Therefore, a positive net Trade Balance strengthens a currency and vice versa for a negative balance.


    Source link

  • Slides below 0.82, reaches multi-week low as USD appreciates

    Slides below 0.82, reaches multi-week low as USD appreciates


    • USD/CHF drops to 0.8155 amid renewed ‘Sell America’ sentiment across global markets.
    • RSI confirms bearish momentum; next targets are YTD low at 0.8083 and psychological support at 0.8000.
    • Recovery needs a break above 0.8200, with resistance at 0.8300 and last week’s high at 0.8346.

    USD/CHF extended its losses during Monday’s North American session, down 0.60% as the Greenback weakened across the board. An earlier risk-off impulse, which surprisingly shifted positively, weighs on the US Dollar (USD), which did not capitalize on its status as the ‘sell America’ trade continues to gain steam in the financial markets. The pair trades below 0.8200 after hitting a six-week low of 0.8155.

    USD/CHF Price Forecast: Technical outlook

    Since hitting a weekly high of 0.8346, the USD/CHF pair has plummeted sharply due to overall weakness in the US Dollar. Momentum as measured by the Relative Strength Index (RSI) shows that sellers are gathering momentum. This means the major could retest the year-to-date (YTD) lows hit on April 21, a swing low of 0.8083. If that level is surpassed, the next stop would be the 0.8000 figure.

    Conversely, if USD/CHF drops below 0.8100, the next support would be the abovementioned YTD low of 0.8083sd and the 0.8000 figure.

    USD/CHF Price Chart – Daily

    Swiss Franc PRICE Today

    The table below shows the percentage change of Swiss Franc (CHF) against listed major currencies today. Swiss Franc was the strongest against the US Dollar.

    USD EUR GBP JPY CAD AUD NZD CHF
    USD -0.85% -0.62% -0.81% -0.27% -0.97% -1.32% -0.78%
    EUR 0.85% 0.22% 0.05% 0.57% -0.12% -0.51% 0.06%
    GBP 0.62% -0.22% -0.15% 0.36% -0.34% -0.74% -0.16%
    JPY 0.81% -0.05% 0.15% 0.54% -0.17% -0.53% -0.07%
    CAD 0.27% -0.57% -0.36% -0.54% -0.70% -1.08% -0.51%
    AUD 0.97% 0.12% 0.34% 0.17% 0.70% -0.33% 0.28%
    NZD 1.32% 0.51% 0.74% 0.53% 1.08% 0.33% 0.57%
    CHF 0.78% -0.06% 0.16% 0.07% 0.51% -0.28% -0.57%

    The heat map shows percentage changes of major currencies against each other. The base currency is picked from the left column, while the quote currency is picked from the top row. For example, if you pick the Swiss Franc from the left column and move along the horizontal line to the US Dollar, the percentage change displayed in the box will represent CHF (base)/USD (quote).


    Source link

  • GBP/USD start the new week on a positive note amid fresh USD selling.

    GBP/USD start the new week on a positive note amid fresh USD selling.


    GBP/USD Weekly Outlook: Pound Sterling’s upside bias persists as traders brace for US NFP week

    The Pound Sterling (GBP) set out on a corrective downside against the US Dollar (USD) after the GBP/USD pair hit the highest level since February 2022, just shy of the 1.3600 mark. It was all about the US tariff headlines and the resultant USD price action that emerged as underlying factors behind the GBP/USD performance in the past week.

    The Greenback kicked off a solid recovery and maintained it almost throughout the week, barring a brief pullback on Thursday. Optimism on the trade front and hawkish US Federal Reserve’s (Fed) policy stance powered the USD turnaround. It started with a positive shift in risk sentiment after US President Donald Trump’s backpedalled on 50% tariffs announced last Friday on European Union (EU) imports from June 1, extending the deadline to July 9. Read more…

    GBP/USD moves back closer to 1.3500 mark amid broadly weaker USD

    The GBP/USD pair regains positive traction at the start of a new week amid renewed US Dollar (USD) selling though it remains below the 1.3500 psychological mark during the Asian session. The Personal Consumption Expenditures (PCE) Price Index released on Friday pointed to further easing inflationary pressures in the US and bolstered the case for more policy easing by the Federal Reserve (Fed). Adding to this, concerns about the worsening US fiscal condition, fueled by the passage of US President Donald Trump’s “Big Beautiful Bill,” exert fresh downward pressure on the USD.

    The British Pound (GBP), on the other hand, continues with its relative outperformance on the back of expectations that the Bank of England (BoE) would pause at its next meeting on June 18 and take its time before lowering borrowing costs further. This, in turn, is seen as another factor lending support to the GBP/USD pair. However, a weaker risk tone limits USD losses and might cap the pair. Read more…


    Source link

  • Gold price falls below ,300 on strong US Dollar as Trump reignites China tensions

    Gold price falls below $3,300 on strong US Dollar as Trump reignites China tensions


    • XAU/USD drops as strong US Dollar pressures Bullion; tariff uncertainty rattles markets.
    • US core PCE dips in April, but strong data lifts yields, dampening Gold’s appeal.
    • Trump accuses China of violating trade deal, reviving geopolitical and tariff concerns.

    Gold price slumped on Friday as the US Dollar recovered some ground despite witnessing a drop in US Treasury bond yields following a strong inflation report, which keeps traders hopeful that the US Federal Reserve (Fed) will ease policy in 2025. XAU/USD trades at $3,289, down 0.83%.

    Sentiment shifted sour as US President Donald Trump complained that China is not fulfilling the agreement negotiated between both parties in Switzerland. He wrote, “China, perhaps not surprisingly to some, HAS TOTALLY VIOLATED ITS AGREEMENT WITH US. So much for being Mr. NICE GUY!”

    Consequently, US equities fell, while the American Dollar recovered from near daily lows, according to the US Dollar Index (DXY).

    Turning to trade-related news, a US Federal Appeals Court reinstated most of Trump’s tariffs imposed on April 2, “Liberation Day,” following a decision by a US Court of International Trade, which blocked most of the duties as they were considered illegal.

    The US Core Personal Consumption Expenditures (PCE) Price Index dipped in April compared to March’s meeting. Other data showed that the University of Michigan’s (UoM) Consumer Sentiment in May’s final reading improved compared to estimates, while inflation expectations declined.

    Gold daily market movers: Tumbles despite soft US inflation data amid US Dollar strength

    • Gold price is pressured due to a strong US Dollar.The DXY, which tracks the US Dollar’s value against a basket of six currencies, edges up 0.11% to 99.44.
    • US Treasury bond yields are falling. The US 10-year Treasury note yield falls two basis points to 4.40%, while US real yields are also edging down by the same amount 2.086%, slightly below the May 29 close.
    • The US core PCE in April showed the evolution of the disinflation process, which was driven by the Fed’s restrictive interest rates. The reading came in at 2.5% YoY, down from 2.6%. Headline inflation came in at 2.1% YoY, below March’s 2.3% rise.
    • Despite witnessing a lower inflation environment, Bullion prices failed to gain traction as US Dollar short positions in the futures market were trimmed in the last week, according to Commitments of Traders (COT) data.
    • The UoM Consumer Sentiment in May improved from 50.8 to 52.2, exceeding estimates on its final reading. It is worth noting that inflation expectations fell. For the 12 months ahead, expectations fell from 7.3% to 6.6%, and for the next five years, they dropped from 4.6% to 4.2%.
    • After the data release, the Atlanta Fed’s GDPNow preliminary reading of economic growth for Q2 2025 rose sharply from 2.2% to 3.8%.
    • Federal Reserve officials crossed the wires on Thursday, emphasizing that the monetary policy is in a good place and that it would take some time to see a shift in the balance of risks for the Fed’s dual mandate.
    • San Francisco’s Fed President Mary Daly said the labor market is in solid shape and revealed that it would not reach the 2% inflation goal in 2025. Despite this, she said that if jobs are solid and the disinflation process continues, it would make sense to cut rates twice as markets expect.
    • Money markets suggest that traders are pricing in 52 basis points of easing toward the end of the year, following the release of US data, according to Prime Market Terminal data.

    Source: Prime Market Terminal

    XAU/USD technical outlook: Tumbles and poised to test $3,250

    Gold price uptrend is intact, though XAU/USD spot prices achieving a daily/weekly close below $3,300 could sponsor some sideways trading action within the $3,250-$3,300 range amid the lack of fresh catalysts ahead of the weekend.

    For a bearish resumption, sellers must drive Gold prices below $3,250, ahead of the 50-day Simple Moving Average (SMA) at $3,221. A breach of the latter will expose the April 3 high turned support at $3,167.

    Conversely, if bulls push XAU/USD past $3,300, the next key resistance levels will be $3,350, $3,400, the May 7 swing high of $3,438 and the record high $3,500.

    Gold FAQs

    Gold has played a key role in human’s history as it has been widely used as a store of value and medium of exchange. Currently, apart from its shine and usage for jewelry, the precious metal is widely seen as a safe-haven asset, meaning that it is considered a good investment during turbulent times. Gold is also widely seen as a hedge against inflation and against depreciating currencies as it doesn’t rely on any specific issuer or government.

    Central banks are the biggest Gold holders. In their aim to support their currencies in turbulent times, central banks tend to diversify their reserves and buy Gold to improve the perceived strength of the economy and the currency. High Gold reserves can be a source of trust for a country’s solvency. Central banks added 1,136 tonnes of Gold worth around $70 billion to their reserves in 2022, according to data from the World Gold Council. This is the highest yearly purchase since records began. Central banks from emerging economies such as China, India and Turkey are quickly increasing their Gold reserves.

    Gold has an inverse correlation with the US Dollar and US Treasuries, which are both major reserve and safe-haven assets. When the Dollar depreciates, Gold tends to rise, enabling investors and central banks to diversify their assets in turbulent times. Gold is also inversely correlated with risk assets. A rally in the stock market tends to weaken Gold price, while sell-offs in riskier markets tend to favor the precious metal.

    The price can move due to a wide range of factors. Geopolitical instability or fears of a deep recession can quickly make Gold price escalate due to its safe-haven status. As a yield-less asset, Gold tends to rise with lower interest rates, while higher cost of money usually weighs down on the yellow metal. Still, most moves depend on how the US Dollar (USD) behaves as the asset is priced in dollars (XAU/USD). A strong Dollar tends to keep the price of Gold controlled, whereas a weaker Dollar is likely to push Gold prices up.


    Source link

  • Bullish tone remains in play above 163.00

    Bullish tone remains in play above 163.00


    • EUR/JPY trades in negative territory near 163.25 in Friday’s early European session. 
    • The positive view of the cross prevails above the key 100-day EMA, but the RSI indicator suggests neutral momentum.
    • The first upside barrier is seen at 164.26; the initial support level is located at 162.10.

    The EUR/JPY cross attracts some sellers to around 163.25 during the early European session on Thursday. The Japanese Yen (JPY) strengthens against the Euro (EUR) amid rising expectations that the Bank of Japan (BoJ) will continue raising interest rates this year. Furthermore, the persistent trade-related uncertainties boost the safe-haven flows, benefitting the JPY. 

    Technically, the bullish outlook of EUR/JPY remains intact on the daily chart, with the price holding above the key 100-day Exponential Moving Average (EMA). However, further consolidation cannot be ruled out as the Relative Strength Index (RSI) hovers around the midline. This suggests a neutral momentum in the near term. 

    The immediate resistance level emerges at 164.26, the high of May 29. Further north, the next hurdle is seen at 164.75, the upper boundary of the Bollinger Band. A decisive break above this level could pave the way to 165.21, the high of May 13. 

    On the flip side, the first downside target to watch is 162.10, the 100-day EMA. Extended losses could see a drop to 161.60, the lower limit of the Bollinger Band. The crucial support level for EUR/JPY is seen at 160.00, the psychological level and the low of April 8. 

    EUR/JPY daily chart

    Japanese Yen FAQs

    The Japanese Yen (JPY) is one of the world’s most traded currencies. Its value is broadly determined by the performance of the Japanese economy, but more specifically by the Bank of Japan’s policy, the differential between Japanese and US bond yields, or risk sentiment among traders, among other factors.

    One of the Bank of Japan’s mandates is currency control, so its moves are key for the Yen. The BoJ has directly intervened in currency markets sometimes, generally to lower the value of the Yen, although it refrains from doing it often due to political concerns of its main trading partners. The BoJ ultra-loose monetary policy between 2013 and 2024 caused the Yen to depreciate against its main currency peers due to an increasing policy divergence between the Bank of Japan and other main central banks. More recently, the gradually unwinding of this ultra-loose policy has given some support to the Yen.

    Over the last decade, the BoJ’s stance of sticking to ultra-loose monetary policy has led to a widening policy divergence with other central banks, particularly with the US Federal Reserve. This supported a widening of the differential between the 10-year US and Japanese bonds, which favored the US Dollar against the Japanese Yen. The BoJ decision in 2024 to gradually abandon the ultra-loose policy, coupled with interest-rate cuts in other major central banks, is narrowing this differential.

    The Japanese Yen is often seen as a safe-haven investment. This means that in times of market stress, investors are more likely to put their money in the Japanese currency due to its supposed reliability and stability. Turbulent times are likely to strengthen the Yen’s value against other currencies seen as more risky to invest in.


    Source link

  • Trump tariffs challenged – OCBC

    Trump tariffs challenged – OCBC


    US Dollar’s (USD’s) rebound found momentum from a US court ruling, saying that Trump’s unilateral imposition of ‘Liberation Day tariffs’ under the International Emergency Economic Powers Act (IEEPA) is invalid. DXY was last at 99.93 levels, OCBC’s FX analysts Frances Cheung and Christopher Wong note.

    2-way trades still likely in the near term

    “The ruling also blocks the enforcement of fentanyl-related tariffs on China, Mexico, and Canada that were announced earlier this year. In response, the Trump administration had filed a notice that it was appealing the ruling, and ultimately the US Supreme Court may have the final say. The court ruling helps to restore some credibility to the system which has been undermined by the unpredictability of Trump’s tariffs. “

    “The check and balance system is at least intact for now, providing a knee-jerk rebound for the USD while US futures jumped over 1%. Adding to FX market volatility was BoK Governor Rhee’s comments that Asian nations had currency talks with the US. This headline saw some knee-jerk reaction, slowing USD’s advance against Asian FX. Nevertheless, Rhee’s comments alongside, uncertainty over the legitimacy of Trump’s tariffs may continue to see more 2-way price action in the USD ahead of core PCE data (Friday).”

    “Daily momentum is not showing a clear bias while RSI rose. 2-way trades still likely in the near term. Resistance at 100.80/101 levels (50 DMA, 23.6% fibo retracement of 2025 peak to trough). Support at 99.2 and 97.90 (2025 low).”


    Source link

  • Gold price falls below ,300 on strong US Dollar as Trump reignites China tensions

    Gold price slumps beneath $3,300 as Fed Minutes signal stagflation risks and patience


    • Gold drops 0.27% after Fed cites tariff-driven inflation concerns; yields rebound, stalling bullion’s rally.
    • Fed minutes highlight risks of persistent inflation and weakening job growth, prompting cautious rate stance.
    • US bond yields rebound, lifting the Dollar and pressuring Gold below $3,300.
    • Goldman Sachs urges increased Gold exposure amid rising geopolitical risks and central bank demand.

    Gold price extended its losses during the North American session on Wednesday after hitting a daily high of $3,325 earlier in the day, as market participants digested the latest Federal Reserve (Fed) policy minutes. At the time of writing, XAU/USD trades below $3,300, resulting in a solid 0.27% decline.

    On May 6-7, the Fed decided to keep rates unchanged, citing uncertainty about the impact of tariffs on the economy. Officials adopted a patience approach due to increased risks of high inflation and unemployment, fueled by the potential impact of tariffs.

    Policymakers acknowledged some stagflation risks as they noted the “Committee might face difficult tradeoffs if inflation proves to be more persistent while the outlooks for growth and employment weaken.”

    Therefore, the Fed has taken a cautious approach regarding monetary policy, waiting for the “net economic effects of the array of changes to government policies to become clearer.” It is worth noting that the Fed meeting took place before Trump reduced tariffs on China from 145% to 30%.

    Bullion’s rally appears to have stalled during the week, as US Treasury bond yields recovered some of the previous week’s fall, underpinning the US Dollar. However, a surprise dovish tilt in the minutes, the less likely scenario, could drive XAU/USD prices higher.

    On Tuesday, Fox Business News Gasparino, in a post on X, revealed that a framework between the US and India is close to being announced. It should be noted that the US has taken a more flexible approach to trade talks.

    Despite this, the Gold upside remains due to increasing geopolitical tensions between Russia and Ukraine, as well as the Middle East conflict involving Israel and Hamas.

    Goldman Sachs analysts recommended a higher-than-usual allocation to Gold in long-term portfolios, revealed Reuters. They cite elevated risks to US institutional credibility, pressure on the Fed, and sustained central bank demand.

    Ahead in the week, the docket will feature the second estimate for Gross Domestic Product (GDP) in Q1 2025, and the Fed’s preferred inflation gauge, the Core Personal Consumption Expenditures (PCE) Price Index.

    Gold daily market movers: Bullion retreats on strong US Dollar and high US yields

    • US Treasury bond yields are rising as the 10-year Treasury note yield increases by four and a half basis points (bps) to 4.493%. Meanwhile, US real yields also advance four bps at 2.171%.
    • The US Dollar Index (DXY), which tracks the buck’s value against a basket of six currencies, rises over 0.33% to 99.89, fueled by an improvement in Consumer Confidence data, which grew the most in four years, revealed the Conference Board .
    • New York Fed President John Williams said that inflation expectations are well-anchored and added that he wants to avoid inflation becoming highly persistent, as that could become permanent.
    • Data revealed that Gold imports to Switzerland from the US rose to its highest level since at least 2012 in April.
    • Besides this, Reuters revealed that “China’s net gold imports via Hong Kong more than doubled in April from March, and were the highest since March 2024, data showed.”
    • Money markets suggest that traders are pricing in 45 basis points of easing toward the end of the year, according to Prime Market Terminal data.

    Source: Prime Market Terminal

    XAU/USD technical outlook: Gold price pullback to challenge $3,250

    Gold prices have consolidated within the $3,280-$3,330 range over the last four trading sessions, as bullish momentum appears to be fading due to technical reasons. Momentum, as measured by the Relative Strength Index (RSI), is aiming toward its 50-neutral line, which if broken, could sponsor a leg-lower in XAU/USD prices.

    For a continuation of the uptrend, bulls must clear $3,300, $3,400 and the May 7 swing high of $3,438. If achieved, Gold’s next goal would be $3,500.

    On the downside, Gold tumbling below $3,250 could expose a move to the 50-day Simple Moving Average (SMA) at $3,211, followed by the May 20 daily low of $3,204.

    Fed FAQs

    Monetary policy in the US is shaped by the Federal Reserve (Fed). The Fed has two mandates: to achieve price stability and foster full employment. Its primary tool to achieve these goals is by adjusting interest rates.
    When prices are rising too quickly and inflation is above the Fed’s 2% target, it raises interest rates, increasing borrowing costs throughout the economy. This results in a stronger US Dollar (USD) as it makes the US a more attractive place for international investors to park their money.
    When inflation falls below 2% or the Unemployment Rate is too high, the Fed may lower interest rates to encourage borrowing, which weighs on the Greenback.

    The Federal Reserve (Fed) holds eight policy meetings a year, where the Federal Open Market Committee (FOMC) assesses economic conditions and makes monetary policy decisions.
    The FOMC is attended by twelve Fed officials – the seven members of the Board of Governors, the president of the Federal Reserve Bank of New York, and four of the remaining eleven regional Reserve Bank presidents, who serve one-year terms on a rotating basis.

    In extreme situations, the Federal Reserve may resort to a policy named Quantitative Easing (QE). QE is the process by which the Fed substantially increases the flow of credit in a stuck financial system.
    It is a non-standard policy measure used during crises or when inflation is extremely low. It was the Fed’s weapon of choice during the Great Financial Crisis in 2008. It involves the Fed printing more Dollars and using them to buy high grade bonds from financial institutions. QE usually weakens the US Dollar.

    Quantitative tightening (QT) is the reverse process of QE, whereby the Federal Reserve stops buying bonds from financial institutions and does not reinvest the principal from the bonds it holds maturing, to purchase new bonds. It is usually positive for the value of the US Dollar.


    Source link

  • Gold slips as Trump’s hits pause on EU duties amid thin trading volume

    Gold slips as Trump’s hits pause on EU duties amid thin trading volume


    • Gold price dips over 0.50% as improved sentiment trims haven flows after last week’s 4.86% surge.
    • Trump postpones 50% EU tariffs to July 9, easing short-term trade war fears.
    • Strong Chinese Gold imports and Russia-Ukraine tensions keep the bullish outlook intact.

    Gold price drops more than 0.50% on Monday amid the lack of demand for haven assets after United States (US) President Donald Trump delayed tariffs on the European Union (EU). In the meantime, trading remains thin due to the closure of the United Kingdom (UK) and US financial markets for holidays. At the time of writing, XAU/USD trades at $3,336.

    Market mood improved on Trump’s statement on Sunday, pushing back the enactment of duties on EU products until July 9. Therefore, Bullion is pressured following last week’s gains of over 4.86%, the most significant increase since the week starting on April 7.

    On Friday, XAU/USD extended its bullish move as Trump continued to pressure Apple (AAPL) to make iPhones in the US. If not, 25% of duties would be imposed. At the same time, he escalated the rhetoric against the EU, threatening to impose 50% tariffs on its goods. This drove the golden metal from $3,287 to last week’s highest high of $3,365.

    Despite retreating, Gold prices are set to continue rallying, as Reuters revealed that “China’s net gold imports via Hong Kong more than doubled in April from March, and were the highest since March 2024, data showed.”

    Additionally, geopolitical risks remain high after Russia attacked Ukraine for the third straight night, spurring an angry reaction on Trump.

    This week, the US economic docket will feature April Durable Goods Orders, the Federal Open Market Committee (FOMC) meeting minutes, the second estimate for Q1 2025 Gross Domestic Product (GDP) and the release of the Core Personal Consumption Expenditures (PCE) Price Index, the Fed’s favorite inflation gauge.

    Gold daily market movers: Improvement in risk appetite weighs on Gold prices

    • US Treasury bond yields remain steady. The 10-year Treasury note yield fell two basis points (bps) on Friday to 4.509%. Meanwhile, US real yields were down as well, one 4 bps to 2.179%.
    • Gold price outlook is optimistic, given the fragile market mood toward US assets sparked by the growing fiscal deficit in the United States, which ignited Moody’s downgrade of US government debt from AAA to AA1.
    • The fiscal package approved by the US lower house is projected to raise the debt ceiling by $4 trillion.
    • The US Dollar Index (DXY), which tracks the buck’s value against a basket of six currencies, edged down 0.10% at 99.00, a tailwind for the Dollar-denominated precious metal.
    • Money markets suggest that traders are pricing in 47.5 basis points of easing toward the end of the year, according to Prime Market Terminal data.

    Source: Prime Market Terminal

    XAU/USD technical outlook: Gold’s uptrend to extend to $3,400

    Gold prices retreated slightly, and it seems traders are booking profits amid thin liquidity and low volatility in the US in observance of the holiday. Trump’s inconsistency regarding trade policies could keep prices swinging violently once trading resumes on Tuesday.

    From a technical perspective, Gold’s bull trend remains intact. If buyers achieve a daily close above $3,300, they could test last week’s high of $3,365. If surpassed, the next stop would be the $3,400 figure, followed by the May 7 high at $3,438 and the all-time high (ATH) at $3,500.

    On the bearish side, if Gold drops below $3,300, expect a move to the May 20 daily low of $3,204, ahead of the 50-day Simple Moving Average (SMA) at $3,199.

    Fed FAQs

    Monetary policy in the US is shaped by the Federal Reserve (Fed). The Fed has two mandates: to achieve price stability and foster full employment. Its primary tool to achieve these goals is by adjusting interest rates.
    When prices are rising too quickly and inflation is above the Fed’s 2% target, it raises interest rates, increasing borrowing costs throughout the economy. This results in a stronger US Dollar (USD) as it makes the US a more attractive place for international investors to park their money.
    When inflation falls below 2% or the Unemployment Rate is too high, the Fed may lower interest rates to encourage borrowing, which weighs on the Greenback.

    The Federal Reserve (Fed) holds eight policy meetings a year, where the Federal Open Market Committee (FOMC) assesses economic conditions and makes monetary policy decisions.
    The FOMC is attended by twelve Fed officials – the seven members of the Board of Governors, the president of the Federal Reserve Bank of New York, and four of the remaining eleven regional Reserve Bank presidents, who serve one-year terms on a rotating basis.

    In extreme situations, the Federal Reserve may resort to a policy named Quantitative Easing (QE). QE is the process by which the Fed substantially increases the flow of credit in a stuck financial system.
    It is a non-standard policy measure used during crises or when inflation is extremely low. It was the Fed’s weapon of choice during the Great Financial Crisis in 2008. It involves the Fed printing more Dollars and using them to buy high grade bonds from financial institutions. QE usually weakens the US Dollar.

    Quantitative tightening (QT) is the reverse process of QE, whereby the Federal Reserve stops buying bonds from financial institutions and does not reinvest the principal from the bonds it holds maturing, to purchase new bonds. It is usually positive for the value of the US Dollar.


    Source link

  • EUR/USD snaps back above 1.1300 as Trump’s tariff salvo roils markets

    EUR/USD snaps back above 1.1300 as Trump’s tariff salvo roils markets


    • EUR/USD dips to 1.1296 after Trump announces steep tariffs on EU imports starting June 1.
    • The pair rebounds to 1.1350 as US Dollar stays pressured by rising fiscal deficit concerns.
    • Euro shrugs off ECB rate cut talk, supported by improving German GDP figures.

    EUR/USD recovered during the mid-North American session on Friday after diving below 1.1300 after US President Donald Trump rattled the markets by threatening to impose 50% tariffs on the European Union (EU). At the time of writing, the pair recovered and climbed to around 1.1350

    US President Donald Trump posted on his social network early Friday that discussions with the European Union “are going nowhere! Therefore, I am recommending a straight 50% tariff on the European Union, starting on June 1, 2025,” he wrote. The EUR/USD fell to 1.1296 on the remarks before the uptrend resumed.

    Following those remarks, US Treasury Secretary Scott Bessent said that “EU proposals have not been of good quality,” adding that “Most countries are negotiating in good faith, except the EU.”

    The Greenback remains on the back foot, weighed down by the approval of Trump’s tax bill in the House of Representatives, which is on its way to the Senate. If passed, the proposal would add close to $4 trillion to the US debt ceiling over a decade, according to the Congressional Budget Office (CBO).

    It is worth noting that the US Dollar remains unreactive to Federal Reserve (Fed) speakers, who so far have said the US Treasury market is working orderly, adding that uncertainty about supply chains, inventory and inflation keeps business executives unaware of the future.

    The US economic docket featured US housing data in May, which was mixed as Building Permits fell, but New Home Sales improved in April.

    In the Eurozone, Germany’s Gross Domestic Product (GDP) improved yearly, though it remained in contractionary territory.

    In the meantime, the Euro shrugged off speculation that the European Central Bank (ECB) is expected to lower interest rates at the upcoming meeting. ECB’s Rehn and Stournaras favor a rate cut in June, with the latter supporting a pause after that meeting.

    EUR/USD daily market movers: the Euro favored by “sell America” trend

    • The Euro remains favored by overall US Dollar weakness. The US Dollar Index (DXY), which tracks the performance of six currencies against the American Dollar, tumbled 0.79% at 99.10, its lowest level since April 29.
    • The “sell America” trend continues with investors selling off bonds, US equities and the US Dollar. It was ignited by US President Donald Trump’s “trade war” and Moody’s downgrade of US government debt from AAA to AA1.
    • The US schedule featured Building Permits, which fell by 4% MoM in April, declining from 1.481 million to 1.422 million, signaling a slowdown in future construction activity.
    • New Home Sales surged 10.9% MoM, rising from 0.67 million to 0.743 million, according to the US Census Bureau. This reflects strong demand in the housing market despite tighter supply conditions.
    • Germany’s economy grew in Q1 2025, exceeding estimates due to exports and industry frontloading ahead of US tariffs. The Gross Domestic Product (GDP) improved from 0.2% to 0.4% QoQ.

    EUR/USD technical outlook: Set to challenge 1.1400 in the near term

    The EUR/USD uptrend resumed on Friday, with the pair reaching a two-week high of 1.1375 as traders brace for challenging 1.1400. Buyers are gathering steam as the pair registered the highest high and low during the last five days, and further confirmed by the Relative Strength Index (RSI), which trends up ahead of turning overbought.

    If EUR/USD clears 1.1400, it would pave the way for testing key resistance levels, like 1.1450, followed by the 1.1500 mark and the year-to-date (YTD) high at 1.1573.

    Conversely, if EUR/USD falls below 1.1300, the pair could test the May 22 low of 1.1255, ahead of 1.1200.

    ECB FAQs

    The European Central Bank (ECB) in Frankfurt, Germany, is the reserve bank for the Eurozone. The ECB sets interest rates and manages monetary policy for the region.
    The ECB primary mandate is to maintain price stability, which means keeping inflation at around 2%. Its primary tool for achieving this is by raising or lowering interest rates. Relatively high interest rates will usually result in a stronger Euro and vice versa.
    The ECB Governing Council makes monetary policy decisions at meetings held eight times a year. Decisions are made by heads of the Eurozone national banks and six permanent members, including the President of the ECB, Christine Lagarde.

    In extreme situations, the European Central Bank can enact a policy tool called Quantitative Easing. QE is the process by which the ECB prints Euros and uses them to buy assets – usually government or corporate bonds – from banks and other financial institutions. QE usually results in a weaker Euro.
    QE is a last resort when simply lowering interest rates is unlikely to achieve the objective of price stability. The ECB used it during the Great Financial Crisis in 2009-11, in 2015 when inflation remained stubbornly low, as well as during the covid pandemic.

    Quantitative tightening (QT) is the reverse of QE. It is undertaken after QE when an economic recovery is underway and inflation starts rising. Whilst in QE the European Central Bank (ECB) purchases government and corporate bonds from financial institutions to provide them with liquidity, in QT the ECB stops buying more bonds, and stops reinvesting the principal maturing on the bonds it already holds. It is usually positive (or bullish) for the Euro.


    Source link

  • Pound Sterling Price News and Forecast: GBP/USD surges past 1.3500

    Pound Sterling Price News and Forecast: GBP/USD surges past 1.3500


    GBP/USD surges past 1.3500 to a three-year high on strong UK Retail Sales, weak US Dollar


    Pound Sterling advances as UK Retail Sales data beats estimates

    GBP/USD rebounds above 1.3450 toward 39-month highs, UK Retail Sales eyed


    Information on these pages contains forward-looking statements that involve risks and uncertainties. Markets and instruments profiled on this page are for informational purposes only and should not in any way come across as a recommendation to buy or sell in these assets. You should do your own thorough research before making any investment decisions. FXStreet does not in any way guarantee that this information is free from mistakes, errors, or material misstatements. It also does not guarantee that this information is of a timely nature. Investing in Open Markets involves a great deal of risk, including the loss of all or a portion of your investment, as well as emotional distress. All risks, losses and costs associated with investing, including total loss of principal, are your responsibility. The views and opinions expressed in this article are those of the authors and do not necessarily reflect the official policy or position of FXStreet nor its advertisers. The author will not be held responsible for information that is found at the end of links posted on this page.

    If not otherwise explicitly mentioned in the body of the article, at the time of writing, the author has no position in any stock mentioned in this article and no business relationship with any company mentioned. The author has not received compensation for writing this article, other than from FXStreet.

    FXStreet and the author do not provide personalized recommendations. The author makes no representations as to the accuracy, completeness, or suitability of this information. FXStreet and the author will not be liable for any errors, omissions or any losses, injuries or damages arising from this information and its display or use. Errors and omissions excepted.

    The author and FXStreet are not registered investment advisors and nothing in this article is intended to be investment advice.


    Source link

  • Rebounds towards 144.00 after three-day slide

    Rebounds towards 144.00 after three-day slide


    • USD/JPY snaps losing streak, rises over 0.20% amid profit-taking before weekend.
    • RSI hints at bottoming, but buyers must clear 144.00 for bullish follow-through.
    • Downside risks remain if pair fails to hold above key 143.00 support.

    The USD/JPY pair snapped three straight days of losses and climbed over 0.20% on Thursday late during the North American session. The Yen’s recent depreciation, despite falling US Treasury yields and amid the lack of a catalyst, could be attributed to traders booking profits ahead of the weekend. At the time of writing, the pair trades at 143.96 after bouncing off daily lows of 142.80.

    USD/JPY Price Forecast: Technical outlook

    USD/JPY suggests buyers overcame sellers, pushing the pair above the 143.00 figure and poised to curtail the Greenback’s fall against the Yen. Momentum suggests the pair could be bottoming out, as depicted by the Relative Strength Index (RSI).

    Nevertheless, the RSI remains bearish, though it edges towards its 50-neutral line.

    That said, buyers will need USD/JPY to clear 144.00. A breach of the latter will expose key resistance levels, led by the Kijun-sen at 144.27 and the 20-day Simple Moving Average (SMA) at 144.65. If those levels are cleared, the Senkou Span A confluence and the psychological 145.00 figure will follow.

    The USD/JPY must remain below the Kijun-sen for a bearish continuation. If achieved, the first support would be 143.00, followed by the May 21 swing low of 142.80. Once hurdled, the next stop would be the previous cycle low seen at 142.35, the May 6 daily low.

    (This story was corrected on May 22 at 21:26 GMT to say in the headline and the first paragraph that USD/JPY slid for three consecutive days, not seven)

    USD/JPY Price Chart – Daily

    Japanese Yen PRICE This week

    The table below shows the percentage change of Japanese Yen (JPY) against listed major currencies this week. Japanese Yen was the strongest against the US Dollar.

    USD EUR GBP JPY CAD AUD NZD CHF
    USD -0.86% -0.99% -0.86% -0.84% -0.15% -0.30% -0.91%
    EUR 0.86% -0.17% 0.05% 0.09% 0.83% 0.62% -0.05%
    GBP 0.99% 0.17% -0.10% 0.23% 1.00% 0.78% 0.09%
    JPY 0.86% -0.05% 0.10% 0.02% 0.84% 0.76% -0.02%
    CAD 0.84% -0.09% -0.23% -0.02% 0.79% 0.55% -0.14%
    AUD 0.15% -0.83% -1.00% -0.84% -0.79% -0.21% -0.87%
    NZD 0.30% -0.62% -0.78% -0.76% -0.55% 0.21% -0.69%
    CHF 0.91% 0.05% -0.09% 0.02% 0.14% 0.87% 0.69%

    The heat map shows percentage changes of major currencies against each other. The base currency is picked from the left column, while the quote currency is picked from the top row. For example, if you pick the Japanese Yen from the left column and move along the horizontal line to the US Dollar, the percentage change displayed in the box will represent JPY (base)/USD (quote).


    Source link

  • USD/MXN breaks key support zone – Société Générale

    USD/MXN breaks key support zone – Société Générale


    USD/MXN has broken below a key consolidation range, forming a bearish rounding top pattern and signaling further downside risks toward multi-month lows, Société Générale’s FX analysts note.

    Rebound likely capped below 19.85

    “USD/MXN broke the lower limit of a multi-month consolidation and has formed a rounding top pattern which generally points towards potential downside. It is now challenging the trough of last week near 19.30.”

    “If a brief rebound develops, lower end of previous range at 19.67/19.85 could cap upside. Next objectives could be located at last September / October lows of 19.10/19.00 and 18.70.”


    Source link

  • Mexican Peso firms as US Dollar softens and Treasury yields climb

    Mexican Peso firms as US Dollar softens and Treasury yields climb


    • The Mexican Peso gains ground against the US Dollar as Moody’s downgrade of US sovereign debt weighs on the Greenback.
    • The Federal Reserve is set to review the discount rate on Monday, potentially influencing short-term funding conditions.
    • USD/MXN trades cautiously below the key psychological resistance at 19.50, reflecting broader Dollar weakness.

    The Mexican Peso (MXN) remains firm against the US Dollar (USD) as markets react to renewed uncertainty following Moody’s downgrade of the US credit rating. The decision to lower the sovereign rating to AA1 from AAA has prompted a reassessment of the US Dollar’s status. While the MXN slightly benefits from the USD’s weakness, the broader risk-off tone in the market causes the Mexican currency to fall against other peers such as the Euro (EUR), the Pound Sterling (GBP), or the Australian Dollar (AUD).

    While the Greenback has retained its global reserve status and safe-haven appeal, mounting concerns over trade tensions, tariff instability, and a deteriorating fiscal outlook are weighing on sentiment. Structural headwinds, including ballooning US debt and subdued growth prospects, have tempered interest rate expectations and contributed to the Greenback’s broad weakness.

    At the time of writing, USD/MXN is trading near 19.43, down 0.12% on the day. The former psychological support at 19.50 has now turned into a resistance barrier, with market participants watching to see whether the Peso can sustain its upward momentum.

    Mexican Peso daily digest: USD/MXN slides as cautious Fed tone and Moody’s downgrade weigh on the Dollar

    • Federal Reserve officials offered a cautious outlook, with Vice Chair for Supervision Philip N. Jefferson, New York Fed President John C. Williams, and Atlanta Fed President Raphael W. Bostic signaling policy vigilance amid fiscal concerns.
    • Dallas Fed President Lorie K. Logan and Minneapolis Fed President Neel Kashkari focused on market structure and broader economic risks, factors that continue to influence USD performance against emerging market peers like the Mexican Peso.
    • Moody’s became the latest major credit agency to downgrade the US sovereign rating, triggering a rise in Treasury yields and a slump in the DXY US Dollar Index.
    • As perceived credit risk rises, the US must offer higher interest rates to attract investors who might otherwise shift capital to alternative safe-haven assets. While rising yields tend to be supportive for the USD, the broader context of fiscal instability has the potential to weigh on the Greenback.
    • Comments from Fed speakers throughout the day may provide insights into the trajectory of US monetary policy, influencing the performance of the US Dollar against global counterparts, including USD/MXN. 
    • Persistent trade tensions between Mexico and the United States continue to create downside risks for the Peso. With roughly 80% of Mexican exports directed toward the US, any disruption or tariff-related uncertainty could magnify market volatility in the pair.

    Mexican Peso Technical Analysis: Peso holds gains as USD/MXN consolidates between key levels

    USD/MXN remains under pressure, extending its bearish trajectory beneath the descending trendline and the 20-day Simple Moving Average (SMA), currently at 19.55. The pair has failed to clear resistance near the 78.6% Fibonacci retracement level of the October–February rally at 19.578, reinforcing a weak technical outlook. 

    Price action continues to oscillate within a narrow range, with repeated failures to break higher indicating ongoing downside pressure.

    USD/MXN daily chart

    The consolidation zone between 19.30 (May low) and 19.72 (23.6% Fib) has acted as a containment range for several weeks. A breakdown below 19.30 could open the door toward the October 2024 low at 19.11, while a daily close above 19.72 would be needed to suggest a shift in sentiment and challenge the next key level at 19.98 (38.2% Fib).

    The Relative Strength Index (RSI) at 40.06 remains subdued, supporting the bearish bias while signaling a lack of upward momentum.

    US Dollar FAQs

    The US Dollar (USD) is the official currency of the United States of America, and the ‘de facto’ currency of a significant number of other countries where it is found in circulation alongside local notes. It is the most heavily traded currency in the world, accounting for over 88% of all global foreign exchange turnover, or an average of $6.6 trillion in transactions per day, according to data from 2022.
    Following the second world war, the USD took over from the British Pound as the world’s reserve currency. For most of its history, the US Dollar was backed by Gold, until the Bretton Woods Agreement in 1971 when the Gold Standard went away.

    The most important single factor impacting on the value of the US Dollar is monetary policy, which is shaped by the Federal Reserve (Fed). The Fed has two mandates: to achieve price stability (control inflation) and foster full employment. Its primary tool to achieve these two goals is by adjusting interest rates.
    When prices are rising too quickly and inflation is above the Fed’s 2% target, the Fed will raise rates, which helps the USD value. When inflation falls below 2% or the Unemployment Rate is too high, the Fed may lower interest rates, which weighs on the Greenback.

    In extreme situations, the Federal Reserve can also print more Dollars and enact quantitative easing (QE). QE is the process by which the Fed substantially increases the flow of credit in a stuck financial system.
    It is a non-standard policy measure used when credit has dried up because banks will not lend to each other (out of the fear of counterparty default). It is a last resort when simply lowering interest rates is unlikely to achieve the necessary result. It was the Fed’s weapon of choice to combat the credit crunch that occurred during the Great Financial Crisis in 2008. It involves the Fed printing more Dollars and using them to buy US government bonds predominantly from financial institutions. QE usually leads to a weaker US Dollar.

    Quantitative tightening (QT) is the reverse process whereby the Federal Reserve stops buying bonds from financial institutions and does not reinvest the principal from the bonds it holds maturing in new purchases. It is usually positive for the US Dollar.


    Source link