Tag: Technical Analysis

  • Dollar weakens against Swiss franc amid bearish pressures

    Dollar weakens against Swiss franc amid bearish pressures


    • USD/CHF trades near the lower end of its daily range on Monday after a notable decline.
    • Bearish signals dominate with downward pressure from key moving averages.
    • Technical levels point to support near 0.8210 and resistance around 0.8315.

    During Monday’s session, USD/CHF was seen trading near the lower end of its daily range, moving around the 0.82 area after dropping by nearly half a percent. The pair continues to face a bearish overall sentiment, reinforced by the performance of technical indicators. Despite the Relative Strength Index (RSI) standing neutral around 38 and the Moving Average Convergence Divergence (MACD) hinting at a mild buy signal, broader signals from the Simple Moving Averages (SMAs) and Exponential Moving Averages (EMAs) remain firmly tilted towards selling.

    The bearish tone is particularly emphasized by the 20-day SMA positioned around 0.8358, as well as the 100-day and 200-day SMAs hovering well above the current trading area at 0.8854 and 0.8750 respectively, all signaling a continued downside bias. Furthermore, short-term EMAs, with the 10-day at approximately 0.8259 and the 30-day near 0.8452, also strengthen the bearish outlook.

    Meanwhile, other momentum indicators such as the Williams Percent Range (14) at around -64 and the Stochastic RSI Fast hovering above 90 are sending more neutral signals, suggesting that while downside pressure is strong, short-term volatility could persist.

    On the levels front, immediate support lies close to the 0.8210 zone, with stronger layers of resistance aligned near 0.8259, 0.8302, and 0.8315. These levels could define the trading boundaries in the short term as the pair reacts to prevailing market forces.

    In conclusion, Monday’s action highlights a continuation of the bearish sentiment for USDCHF, driven largely by the weight of the moving averages, despite some neutral signs from oscillators. Traders will be keeping a close eye on whether the support around 0.8210 holds or if the pair stages a corrective rebound towards the resistance clusters identified above.

    Daily Chart


    Source link

  • Critical levels investors must watch

    Critical levels investors must watch


    Current market situation and fundamental drivers

    The technology sector is driving a notable rebound in equity markets despite ongoing tariff uncertainties between the US and China. Optimism around potential tariff reductions, strong earnings from major tech companies, and dovish signals from the Federal Reserve have collectively fueled recent gains. However, substantial risks remain, and investors need a cautious approach.

    Advantages (bullish factors)

    • Optimistic tariff developments: Recent signals from the US administration indicate a willingness to significantly reduce tariffs imposed on China, potentially dropping tariffs from 145% down to around 50-60%. Such actions would alleviate market pressures and stimulate investor confidence.
    • Strong earnings in the tech sector: Companies like Alphabet (GOOGL) and Nvidia (NVDA) reported impressive earnings, fueling optimism and significant share price increases, thereby driving broader sector gains.
    • Fed’s dovish monetary stance: The Federal Reserve hinted at potential interest rate cuts later in the year, improving liquidity prospects and supporting risk-on sentiment, crucial for growth-oriented tech stocks.

    Disadvantages (bearish factors)

    • Persistent tariff uncertainties: Despite recent optimism, no formal resolution has been reached in the US-China trade dispute, creating lingering uncertainty and potential volatility in tech stocks.
    • Economic slowdown concerns: Consumer confidence recently hit its lowest point since the 1990 recession, with inflation fears and economic uncertainty tied directly to tariff impacts.
    • Technical resistance ahead: Price structures indicate major resistance zones ahead, suggesting that recent gains might face significant selling pressure unless robust breakthroughs occur.

    Detailed technical outlook

    Nasdaq futures technical levels

    Nasdaq futures recovered about 50% of the losses from the collapse at 22400, closing Friday’s trades at 19554. Critical support lies at 19173, 18800, and 18530, while resistance is positioned at 19990, 20212, and, notably, 20458. A decisive breakout above 20458 could trigger moves to 20855 and 21100, whereas dropping below 19418 risks retesting lower supports.

    Tesla Inc. (TSLA)

    Tesla surged approximately 27% due to CEO Elon Musk’s planned focus shift back to Tesla, easing regulatory policies on autonomous vehicles, and anticipated robotaxi deployments. The stock reclaimed critical resistance at $244, breaking through $263 and $275. The next crucial resistance levels are $294 and $306. Failure to break these levels risks a reversal back to $275, $263, and potentially $244.

    Alphabet Inc. (GOOGL)

    Alphabet rallied over 9%, benefiting from better-than-expected Q1 earnings and revenue. It re-entered the critical $163-$169 support/resistance zone. Holding above $169 could propel the stock toward $175 and $178 while dropping below $163 risks declines to $158 and $154.

    Nvidia Corporation (NVDA)

    Nvidia posted a substantial 16% gain, driven by bullish sentiment in AI and data-centre markets. The recent breakout into the 109-111 resistance zone indicates confidence among traders. Successfully pushing beyond this critical resistance could target levels at 115 and 117. Falling below 109 would likely see a retracement towards supports at 105, 102, and potentially 98.

    Meta Platforms (META)

    Meta gained 13%, breaking out of a two-month descending channel. The current resistance is between $540 and $550. Breaking above this zone targets $565-$575, while dropping below $540 could lead to retracements towards $525, $515, and potentially $500.

    Microsoft Corporation (MSFT)

    Microsoft’s share price rose 10%, driven by optimistic sentiment ahead of Q1 earnings. Critical resistance is at $386-$393. A breakout above $393 targets $403, $410, and potentially $420, while failure could see a pullback to $376 and $369.

    Apple Inc. (AAPL)

    Apple rallied 10%, approaching resistance at $210. A breakout above $210 could target $217, $222, and $230, while failure risks pulling back to support levels at $204, $200, and, in the worst case, $190.

    Amazon.com Inc. (AMZN)

    Amazon posted a robust 14% gain, breaking through resistance levels as optimism builds ahead of earnings. Resistance is set at the $183-$187 zone. Breaking above $187 could target $193, $197, and $203. Failure to maintain above $183 might reverse the price to support levels at $177 and $173.

    Strategic outlook for traders and investors

    Investors and traders should closely monitor critical resistance and support levels detailed above. While fundamentals currently support bullish sentiment, unresolved tariffs and technical resistance suggest that traders and investors should be prepared for volatility, which is crucial. Position sizing and risk management remain essential in navigating this uncertain market landscape.


    Source link

  • GBP/USD slips despite strong UK Retail Sales as USD dominance prevails

    GBP/USD slips despite strong UK Retail Sales as USD dominance prevails


    GBP/USD slips despite strong UK Retail Sales as USD dominance prevails

    Pound Sterling gains on surprisingly positive UK Retail Sales data

    UK Retail Sales jump 0.4% MoM in March vs. -0.4% expected


    Information on these pages contains forward-looking statements that involve risks and uncertainties. Markets and instruments profiled on this page are for informational purposes only and should not in any way come across as a recommendation to buy or sell in these assets. You should do your own thorough research before making any investment decisions. FXStreet does not in any way guarantee that this information is free from mistakes, errors, or material misstatements. It also does not guarantee that this information is of a timely nature. Investing in Open Markets involves a great deal of risk, including the loss of all or a portion of your investment, as well as emotional distress. All risks, losses and costs associated with investing, including total loss of principal, are your responsibility. The views and opinions expressed in this article are those of the authors and do not necessarily reflect the official policy or position of FXStreet nor its advertisers. The author will not be held responsible for information that is found at the end of links posted on this page.

    If not otherwise explicitly mentioned in the body of the article, at the time of writing, the author has no position in any stock mentioned in this article and no business relationship with any company mentioned. The author has not received compensation for writing this article, other than from FXStreet.

    FXStreet and the author do not provide personalized recommendations. The author makes no representations as to the accuracy, completeness, or suitability of this information. FXStreet and the author will not be liable for any errors, omissions or any losses, injuries or damages arising from this information and its display or use. Errors and omissions excepted.

    The author and FXStreet are not registered investment advisors and nothing in this article is intended to be investment advice.


    Source link

  • Euro steadies near 1.1400 after soft pullback

    Euro steadies near 1.1400 after soft pullback


    • EURUSD trades near the 1.1400 area, slipping slightly after the European session.
    • The bullish bias persists despite mixed short-term momentum signals.
    • Resistance seen around 1.1378; support zones near 1.1335 and 1.1215.

    The EURUSD pair was seen hovering near the 1.1400 region on Friday after easing slightly in the aftermath of the European session. The pair is consolidating within a narrow range between 1.1315 and 1.1391, reflecting a pause in bullish momentum while still holding ground near recent highs.

    Technically, the broader picture remains constructive. The 20-day, 100-day, and 200-day simple moving averages all point higher, supporting the ongoing bullish trend. Shorter-term indicators like the 10-day EMA and 30-day EMA also reinforce this outlook, suggesting that pullbacks may find support.

    Momentum readings, however, are mixed. The Relative Strength Index is neutral, while the MACD continues to issue a buy signal. At the same time, the 10-period Momentum indicator flashes a mild sell, and Bull Bear Power remains flat, highlighting near-term indecision.

    Key support levels are located at 1.1369, 1.1335, and 1.1215. On the upside, resistance is expected at 1.1378, with further gains likely requiring stronger bullish conviction.


    Source link

  • Technical rebound is under way – OCBC

    Technical rebound is under way – OCBC


    Relative calm continues to be observed this week amid Trump’s de-escalation. Trump continued to speak about how his administration was talking to China about trade even as Beijing denied the existence of negotiations. Chinese Commerce Ministry spokesman He Yadong said that ‘any reports on development in talks are groundless’ and urged the US to ‘show sincerity’ if it wants to make a deal. DXY was last seen at 99.60 levels, OCBC’s FX analysts Frances Cheung and Christopher Wong note.

    Bearish momentum on daily chart fades

    “Separately, we also shared that the Ministry of Foreign Affairs spokesman Guo Jiakun said that China’s stance on the tariff war initiated by the US is clear: we do not wish to fight, nor are we afraid to fight. If it comes to a fight, we will see it through; if it comes to talks, our door is open. He emphasised that if the US truly wants to resolve issues through dialogue and negotiation, it should stop threatening and coercing and engage in dialogue with China on the basis of equality, respect, and mutual benefit.”

    “This morning, Bloomberg headlines reported that China was said to exempt some US goods from tariffs as costs rise. The case of a de-escalation narrative persisting for a while more should not be ruled out and can aid USD short covering (especially against safe haven proxies), following the >10% decline (at one point) since Jan peak. The broad USD bounce may also see some AxJs come under pressure in the interim, despite conciliatory tone towards a trade truce/deal.”

    “Bearish momentum on daily chart faded while RSI rose. Resistance at 100.10, 100.80/101.20 levels (23.6% fibo retracement of 2025 peak to trough, 21 DMA). Support at 99.10, 98.60 levels. Elsewhere, we caution that month-end USD rebalancing flows may risk distorting FX price action.”


    Source link

  • Gold price climbs past ,300 on uncertainty about trade and weak USD

    Gold price climbs past $3,300 on uncertainty about trade and weak USD


    • Gold snaps two-day losing streak, gaining 1.5% on fresh trade war fears.
    • Trump softens tariff talk, but China denies negotiations and demands full rollback.
    • Fed rate cut bets rise as yields drop and economic uncertainty builds.

    Gold price snapped two days of losses on Thursday and rose $50, or more than 1.50%, amid renewed concerns about the US-China trade war. Even though US President Donald Trump softened his stance on sticking to 145% tariffs on Beijing, the XAU/USD trades at $3,338 after jumping off daily lows of $3,287.

    Market mood remains upbeat with Wall Street posting gains. Although traders seem relieved by Trump’s willingness to reach a deal with Beijing, China plays hardball and asks to cancel all “unilateral” US tariffs, clarifying that they have not held talks with the US government.

    Bullion prices advance underpinned by the plunge in US Treasury bond yields. The US Dollar Index (DXY) is also feeling the pain after hitting four-day peaks against a basket of six currencies.

    US economic data witnessed the release of Initial Jobless Claims for the last week, which was aligned with estimates. Durable Goods Orders jumped sharply in March, sponsored by airplane orders.

    Meanwhile, a wave of Federal Reserve (Fed) officials grabbed the headlines. Cleveland Fed President Beth Hammack stated the Fed could act as soon as June if the data supports it but emphasized that uncertainty is weighing on business planning.

    Fed Governor Christopher Waller echoed a similar tone, noting that while action in June remains on the table, rate cuts may be driven by a weakening labor market. Waller said, “rate cuts could come from rising unemployment.”

    Regarding the chances of the Fed reducing interest rates at the upcoming meeting, traders see a 94% chance of keeping them unchanged, according to Prime Market Terminal. Nevertheless, traders expect the Fed funds rate to end at 3.45%, equal to 86 basis points of easing (bps).

    Source: Prime Market Terminal

    Daily digest market movers: Gold price climbs boosted by weak US Dollar

    • The yield on the US 10-year Treasury note has decreased by seven-and-a-half basis points, reaching 4.31%.
    • US real yields collapsed seven bps to 2.023%, as shown by the US 10-year Treasury Inflation-Protected Securities yields.
    • US Durable Goods Orders soared in March from 0.9% to 9.2%, sponsored by aircraft bookings. Initial Jobless Claims for the week ending April 19 rose by 222K as expected, up from 216K in the previous reading.

    XAU/USD technical outlook: Gold price uptrend resumes as buyers reclaim $3,300

    The Gold price uptrend resumed, yet buyers must clear the April 22 high of $3,386 to prevent sellers from dragging lower prices. The next key resistance level would be $3,400, followed by the $3,450 and the $3,500 figure.

    On the other hand, if XAU/USD tumbles below $3,300, this could open the door to test $3,200 ahead of the April 3 peak of $3,167. A breach of the latter will expose the 50-day Simple Moving Average (SMA) at $3,041.

    US-China Trade War FAQs

    Generally speaking, a trade war is an economic conflict between two or more countries due to extreme protectionism on one end. It implies the creation of trade barriers, such as tariffs, which result in counter-barriers, escalating import costs, and hence the cost of living.

    An economic conflict between the United States (US) and China began early in 2018, when President Donald Trump set trade barriers on China, claiming unfair commercial practices and intellectual property theft from the Asian giant. China took retaliatory action, imposing tariffs on multiple US goods, such as automobiles and soybeans. Tensions escalated until the two countries signed the US-China Phase One trade deal in January 2020. The agreement required structural reforms and other changes to China’s economic and trade regime and pretended to restore stability and trust between the two nations. However, the Coronavirus pandemic took the focus out of the conflict. Yet, it is worth mentioning that President Joe Biden, who took office after Trump, kept tariffs in place and even added some additional levies.

    The return of Donald Trump to the White House as the 47th US President has sparked a fresh wave of tensions between the two countries. During the 2024 election campaign, Trump pledged to impose 60% tariffs on China once he returned to office, which he did on January 20, 2025. With Trump back, the US-China trade war is meant to resume where it was left, with tit-for-tat policies affecting the global economic landscape amid disruptions in global supply chains, resulting in a reduction in spending, particularly investment, and directly feeding into the Consumer Price Index inflation.


    Source link

  • GBP/USD rebounds past 1.3300 as US-China tensions rattle US Dollar

    GBP/USD rebounds past 1.3300 as US-China tensions rattle US Dollar


    GBP/USD rebounds past 1.3300 as US-China tensions rattle US Dollar

    Pound Sterling recovers against US Dollar despite hopes on US-China trade deal

    GBP/USD Price Forecast: Bullish outlook remains in play above 1.3250


    Information on these pages contains forward-looking statements that involve risks and uncertainties. Markets and instruments profiled on this page are for informational purposes only and should not in any way come across as a recommendation to buy or sell in these assets. You should do your own thorough research before making any investment decisions. FXStreet does not in any way guarantee that this information is free from mistakes, errors, or material misstatements. It also does not guarantee that this information is of a timely nature. Investing in Open Markets involves a great deal of risk, including the loss of all or a portion of your investment, as well as emotional distress. All risks, losses and costs associated with investing, including total loss of principal, are your responsibility. The views and opinions expressed in this article are those of the authors and do not necessarily reflect the official policy or position of FXStreet nor its advertisers. The author will not be held responsible for information that is found at the end of links posted on this page.

    If not otherwise explicitly mentioned in the body of the article, at the time of writing, the author has no position in any stock mentioned in this article and no business relationship with any company mentioned. The author has not received compensation for writing this article, other than from FXStreet.

    FXStreet and the author do not provide personalized recommendations. The author makes no representations as to the accuracy, completeness, or suitability of this information. FXStreet and the author will not be liable for any errors, omissions or any losses, injuries or damages arising from this information and its display or use. Errors and omissions excepted.

    The author and FXStreet are not registered investment advisors and nothing in this article is intended to be investment advice.


    Source link

  • What Alphabet and Microsoft earnings could reveal about the future of AI and quantum

    What Alphabet and Microsoft earnings could reveal about the future of AI and quantum


    When two tech titans with a combined market cap of over $4 trillion prepare to reveal their Q1 earnings, the stakes stretch far beyond Wall Street. This isn’t just another earnings season – it’s a reality check on how big tech plans to handle the rising costs of AI, shifting alliances, and new threats from competitors and regulators.

    Alphabet and Microsoft aren’t just reporting numbers. They’re setting the tone for where tech investing is headed next – and whether AI’s billion-dollar promises are still on track.

    What if the next chapter of tech Investing Isn’t about who leads in AI – but who survives It?

    This week, Alphabet and Microsoft will reveal more than quarterly earnings. They’ll show us how two of the world’s most influential companies are navigating a high-stakes landscape of artificial intelligence, platform battles, and economic uncertainty.

    Forget the hype. What’s coming could decide who dominates – and who drifts – through the rest of 2025.

    Alphabet: AI expansion amid ad pressures and trade fears

    Alphabet reports earnings on April 24, and the stakes couldn’t be higher. Backed by a hefty $9 billion vote of confidence from Goldman Sachs, the Google parent is betting on AI – but it’s also juggling increasing headwinds.

    The recent $32 billion acquisition of cybersecurity firm Wiz hints at Alphabet’s ambitions to become indispensable across the cloud and security spectrum. Wiz’s cross-platform capabilities make Alphabet a more serious contender in the multi-cloud arena, where compatibility is king.

    Yet Alphabet’s journey is far from smooth. The ad business – its traditional powerhouse – is facing stiff competition. Amazon’s creative tie-ups with platforms like Pinterest and Snapchat threaten to siphon off young, ad-savvy audiences. In addition to the pressure from rising antitrust heat and fears of new tariffs under a potential Trump administration, the picture becomes more complicated.

    Analysts are still backing Alphabet to deliver forecasting:

    Still, not everyone’s bullish. Citi recently pulled back its price target to $195, citing risks in the ad sector that could dent Alphabet’s near-term upside.

    Microsoft: Riding quantum dreams but watching its AI ally

    Microsoft’s turn comes on April 30 – and the mood is cautious. The company’s long-standing alliance with OpenAI was once its ace card. Now, it’s a wildcard.

    OpenAI’s surprise $3 billion buyout of Windsurf, an elite AI coding platform, has rattled markets. Once seen as Microsoft’s AI extension, OpenAI now seems more independent – and potentially competitive. With $40 billion in fresh capital, OpenAI could go its way, prompting concerns over how Microsoft’s AI pipeline might be affected.

    Despite the AI shake-up, Microsoft remains a Wall Street darling. Azure continues to perform like a recession-proof machine, and Microsoft 365 remains a reliable revenue anchor. Mizuho’s Gregg Moskowitz keeps a $475 target on the stock, citing Microsoft’s scale and cloud infrastructure as key strengths.

    But the real buzz? Quantum computing. Microsoft recently unveiled the Majorana 1 chip – a leap in quantum tech enabled by a breakthrough “top conductor” material. While still in the early stages, the quantum computing market is forecast to balloon to $90–$170 billion by 2040, with strong government and private sector backing.

    That puts Microsoft in a prime spot. Its investment in future-proof technologies, from AI to quantum, could pay massive dividends – if it stays ahead of the curve.

    Quantum spending has also been growing steadily and is expected to stay on that trajectory in the foreseeable future. Fifty to 60 percent of the spending is expected to come from the public sector, 35 to 50 percent from the corporate sector, and the rest from supply chain spending.

    Source: Hyperion Research

    Technical outlook: The bottom line

    The upcoming earnings calls from Alphabet and Microsoft will be pivotal. They will clarify AI strategies, quantum computing potential, and how each company plans to tackle economic uncertainties. Investors now face a crucial decision: jump in early, banking on potential upside, or await further clarity from executive insights.

    Whichever approach investors choose, one thing is clear: Tech earnings season is shaping up to be exciting – and potentially lucrative – for those paying close attention.

    At the time of writing, Google stock is hovering around the $153.86 mark. Prices remain below the moving average, indicating that the trend is still downwards. However, RSI rising steadily indicates that some upside pressure is building. Should the downward trend continue, prices could find support around the $149.18 and $146.34 support levels.
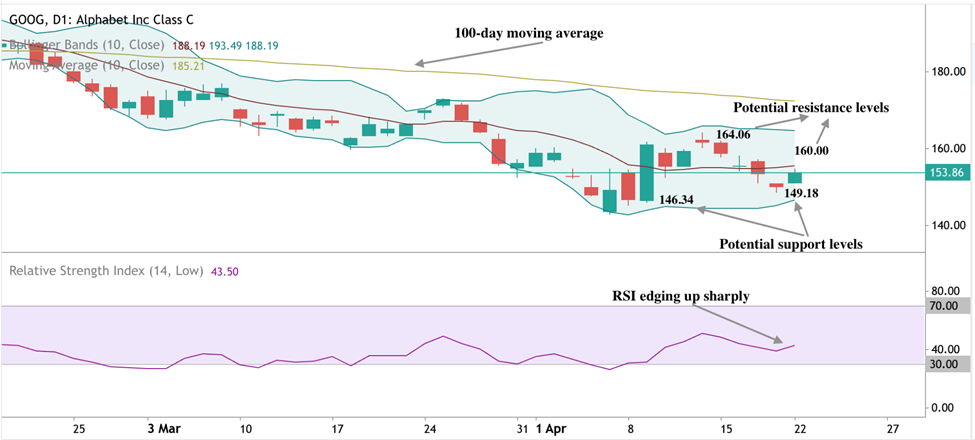
    Chart

    Source: Deriv MT5

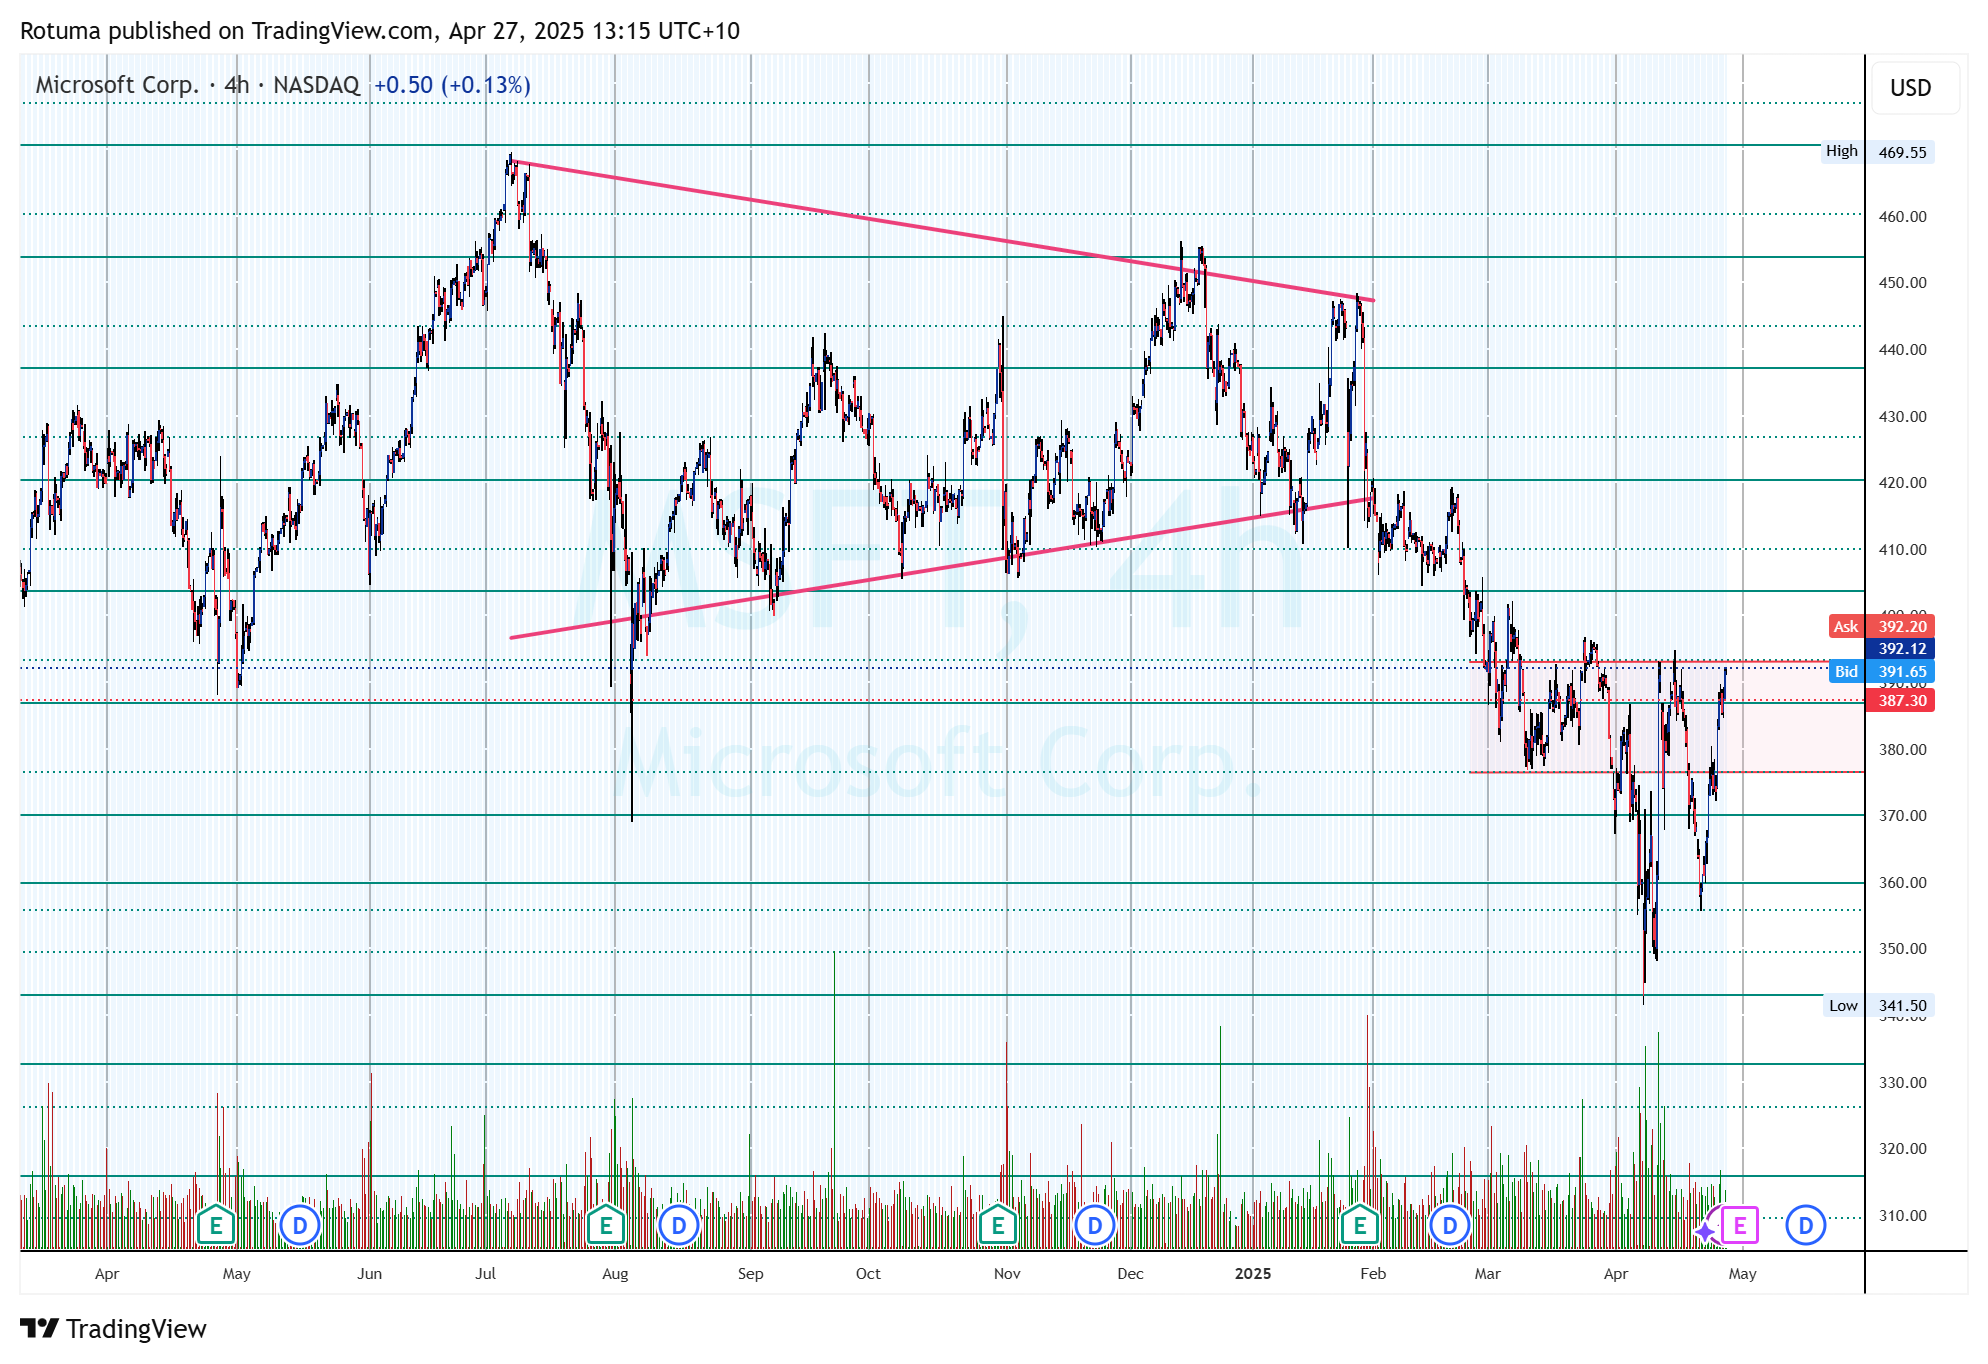
    Microsoft stock has also seen some downward movement over the past few days. The RSI pointing up suggests that some upward pressure is building. However, we recently saw a “death cross,” a tell-tale sign of a bearish trend. This is when the 200 SMA crosses over the 50 SMA.

    If the slump continues, prices could find a support floor at the $356.53 support level. Prices could find resistance barriers at the $380.00 and $395.00 resistance levels if we see a significant bounce.

    Chart

    Source: Deriv MT5


    Source link

  • Bearish bias holds despite intraday gains

    Bearish bias holds despite intraday gains


    • AUD/JPY trades near the 91.00 zone after bouncing within Wednesday’s range.
    • The broader trend remains bearish amid pressure from longer-term moving averages.
    • Key resistance is seen near the 91.20–91.80 zone, with support near 90.70.

    The AUD/JPY pair was seen around the 91.00 zone in Wednesday’s session, staging a modest intraday advance ahead of the Asian session. Despite the bounce from earlier lows, the pair retains a bearish overall tone, capped by key moving averages and a sluggish momentum backdrop. Technical indicators are mixed, with the Relative Strength Index hovering around neutral territory, the MACD suggesting upside potential, and moving averages still tilting south. Price action remains confined to the middle of today’s daily range, which points to indecision in the near term.

    From a technical perspective, the pair is gaining some ground but lacks the strength to break decisively higher. The RSI is neutral around the 47 mark, while the Stochastic %K and Commodity Channel Index also print neutral readings, reinforcing the lack of clear direction in short-term momentum. The MACD, however, offers a mild bullish signal, hinting at the possibility of further upside attempts.

    Despite this, the broader outlook remains tilted to the downside. The 20-day, 100-day, and 200-day Simple Moving Averages all slope downward, exerting resistance from above. Notably, the 30-day EMA and SMA, seen near the 91.80–92.20 region, act as dynamic barriers capping recent gains and validating the bearish bias.

    Immediate support lies in the 90.70–90.60 range, which has held earlier dips. Should sellers regain control, a break below this zone could expose deeper losses. On the upside, resistance clusters around 91.20, 91.25, and 91.85 — levels that coincide with key averages and recent swing highs.

    Overall, while AUD/JPY managed to claw back some ground during Wednesday’s trade, the prevailing trend remains bearish unless a firm break above the 91.80 zone materializes. Traders should watch for confirmation in the coming sessions as the pair continues to oscillate within a narrowing range.

    Daily chart


    Source link

  • Gold price explores past ,400 as Trump-Powell clash sparks Fed independence fears

    Gold price explores past $3,400 as Trump-Powell clash sparks Fed independence fears


    • Gold hits fresh all-time high as Trump attacks Powell, calling him “a major loser” for delaying rate cuts.
    • DXY plunges to 97.92 as Fed independence is questioned and stagflation risks remain in focus.
    • Traders brace for key Fed speeches this week from Jefferson, Harker, and Kashkari amid growing policy uncertainty.

    Gold price begins the week on a higher note, gaining over 2.56% and refreshing a previous record high as the precious metal hits $3,430 on uncertainty about comments that threat to curtail the Federal Reserve’s (Fed) independence. At the time of writing,  XAU/USD trades at $3,419 after hitting a daily low of $3,329.

    Demand for bullion has increased as United States (US) President Donald Trump continues to exert pressure on the Fed. Fed Chair Jerome Powell called him a “major loser” and said he is always too late to reduce borrowing costs.

    Last week, Powell said the US central bank is in wait-and-see mode and even flagged the chance of a stagflationary scenario, acknowledging, “We may find ourselves in the challenging scenario in which our dual-mandate goals are in tension.”

    Growing tensions between Trump and Powell, along with controversial trade policies, weighed on the Greenback, which, according to the US Dollar Index (DXY), has fallen to three-year lows of 97.92.

    Data-wise, the US economic docket is absent, though it would gather traction mainly supported by Fed speakers. Vice-Chair Philip Jefferson, Philadelphia Fed Patrick Harker, and Minneapolis Neel Kashkari are all set to deliver remarks on Tuesday.

    Daily digest market movers: Gold price soars to record high amid high US yields

    • The US 10-year Treasury yield rises four basis points to 4.373% yet fails to cap Bullion prices.
    • US real yields followed suit, climbing three and a half bps to 2.14%, as shown by the US 10-year Treasury Inflation-Protected Securities yields
    • In rates markets, money market traders have priced in 94.5 basis points of Fed rate cuts by the end of 2025, with the first cut expected in July.
    • Data-wise, this week the US economic docket will be packed by a flurry of Fed speakers, S&P Global Flash PMIs, Durable Goods Orders and the University of Michigan Consumer Sentiment final reading.

    XAU/USD technical outlook: Gold price poised to challenge $3,450 in the near term

    The uptrend in Gold prices remains in play, even with the chance of testing the $3,500  level touted by Citi to be reached in the next three months. The Relative Strength Index (RSI) turned overbought, an indication that the precious metal could be set for a pullback, but a breach of the latest peak suggests that bulls could reach $3,450 in the near term.

    Conversely, if XAU/USD tumbles below $3,400, the first support would be the April 17 high of $3,357, followed by $3,300.

    Gold FAQs

    Gold has played a key role in human’s history as it has been widely used as a store of value and medium of exchange. Currently, apart from its shine and usage for jewelry, the precious metal is widely seen as a safe-haven asset, meaning that it is considered a good investment during turbulent times. Gold is also widely seen as a hedge against inflation and against depreciating currencies as it doesn’t rely on any specific issuer or government.

    Central banks are the biggest Gold holders. In their aim to support their currencies in turbulent times, central banks tend to diversify their reserves and buy Gold to improve the perceived strength of the economy and the currency. High Gold reserves can be a source of trust for a country’s solvency. Central banks added 1,136 tonnes of Gold worth around $70 billion to their reserves in 2022, according to data from the World Gold Council. This is the highest yearly purchase since records began. Central banks from emerging economies such as China, India and Turkey are quickly increasing their Gold reserves.

    Gold has an inverse correlation with the US Dollar and US Treasuries, which are both major reserve and safe-haven assets. When the Dollar depreciates, Gold tends to rise, enabling investors and central banks to diversify their assets in turbulent times. Gold is also inversely correlated with risk assets. A rally in the stock market tends to weaken Gold price, while sell-offs in riskier markets tend to favor the precious metal.

    The price can move due to a wide range of factors. Geopolitical instability or fears of a deep recession can quickly make Gold price escalate due to its safe-haven status. As a yield-less asset, Gold tends to rise with lower interest rates, while higher cost of money usually weighs down on the yellow metal. Still, most moves depend on how the US Dollar (USD) behaves as the asset is priced in dollars (XAU/USD). A strong Dollar tends to keep the price of Gold controlled, whereas a weaker Dollar is likely to push Gold prices up.


    Source link

  • GBP/USD soars above 1.3400 [Video]

    GBP/USD soars above 1.3400 [Video]


    GBP/USD soars above 1.3400 as threat to Fed’s independence batters US Dollar

    The GBP/USD pair rallies to near 1.3400 during European trading hours on Monday, the highest level seen in seven months. The Cable strengthens as the US Dollar (USD) has been battered by the threat to the Federal Reserve’s (Fed) independence after United States (US) President Donald Trump.

    The US Dollar Index (DXY), which tracks the Greenback’s value against six major currencies, is down over 1% to a fresh three-year low near 98.00. Read more…

    GBP/USD Forecast: Pound Sterling could face next resistance at 1.3430

    GBP/USD extends its uptrend to start the week and trades at its highest level since September near 1.3400. The pair could face stiff resistance at 1.3430.

    Following the long weekend, the US Dollar (USD) comes under a strong selling pressure on Monday as the US-China trade conflict shows no signs of de-escalation anytime soon. Read more…

    GBP/USD Elliott Wave technical analysis [Video]

    The GBPUSD daily chart displays a clear trending pattern using the Elliott Wave theory. Currently, the currency pair is moving within navy blue wave 1, part of the broader gray wave 1. This positioning indicates the beginning of a new impulse wave, which could gain momentum in upcoming sessions. The structure suggests this is the first wave in what might develop into a complete five-wave impulse pattern across current and higher timeframes. Read more…


    Source link

  • Gold price explores past ,400 as Trump-Powell clash sparks Fed independence fears

    Gold ends week higher despite Powell’s pushback, trade uncertainty lingers


    • Gold rallies $90 this week as the US Dollar weakens amid rising trade tensions and geopolitical risks.
    • Fed’s Daly says policy is still restrictive; neutral rate may be rising, echoing Powell’s hawkish tone.
    • Traders focus on key US data next week: Flash PMIs, Durable Goods, and final Consumer Sentiment.

    Gold prices are set to end the week on a positive note, up by over 2.79% as the precious metal enjoyed a $90 US Dollar (USD) rally due to the latter weakness sponsored by uncertainty about global trade. At the time of writing, XAU/USD trades at $3,326.

    XAU/USD holds at $3,326 after hitting ATH of $3,358; real yields rise but long weekend profit-taking caps rally

    European and US markets are closed due to a long Easter weekend, so news flows are light. San Francisco Federal Reserve (Fed) President Mary Daly crossed the wires and said that the economy is in a good place, though some sectors are slowing down. She added that policy remains restrictive in good place, exerting downward pressure on inflation, and added that neutral rates “may be rising.”

    Bullion prices dropped after hitting an all-time high (ATH) of $3,358 as traders booked profits due to the long weekend. Wednesday’s hawkish speech by Fed Chair Jerome Powell capped the precious metal advance, even though uncertainty over US trade policies and geopolitical risks may underpin Gold prices.

    Yields rose, with the US 10-year T-note yield rising five basis points to 4.333%. US real yields, which are calculated by the yield of the nominal note minus inflation expectations, climb five bps to 2.163%, a headwind for Gold prices.

    Next week, the US economic docket will be packed by a flurry of Fed speakers, S&P Global Flash PMIs, Durable Goods Orders and the University of Michigan Consumer Sentiment final reading.

    XAU/USD Price Forecast: Technical outlook

    Gold’s uptrend remains intact despite Thursday’s pullback below the $3,330 mark. As prices recover some earlier losses, the lack of downside follow-through suggests limited acceptance of lower levels, keeping the door open for further gains.

    Momentum-wise, the Relative Strength Index (RSI) remains overbought but not yet at the extreme 80 level. However, a mean-reversion move could be on the horizon with the RSI turning lower.

    In that case, initial support lies at $3,300, followed by the April 16 low at $3,229. On the upside, a break above $3,350 could set up a test of the year-to-date (YTD) high, with the next target at $3,400.

    Gold FAQs

    Gold has played a key role in human’s history as it has been widely used as a store of value and medium of exchange. Currently, apart from its shine and usage for jewelry, the precious metal is widely seen as a safe-haven asset, meaning that it is considered a good investment during turbulent times. Gold is also widely seen as a hedge against inflation and against depreciating currencies as it doesn’t rely on any specific issuer or government.

    Central banks are the biggest Gold holders. In their aim to support their currencies in turbulent times, central banks tend to diversify their reserves and buy Gold to improve the perceived strength of the economy and the currency. High Gold reserves can be a source of trust for a country’s solvency. Central banks added 1,136 tonnes of Gold worth around $70 billion to their reserves in 2022, according to data from the World Gold Council. This is the highest yearly purchase since records began. Central banks from emerging economies such as China, India and Turkey are quickly increasing their Gold reserves.

    Gold has an inverse correlation with the US Dollar and US Treasuries, which are both major reserve and safe-haven assets. When the Dollar depreciates, Gold tends to rise, enabling investors and central banks to diversify their assets in turbulent times. Gold is also inversely correlated with risk assets. A rally in the stock market tends to weaken Gold price, while sell-offs in riskier markets tend to favor the precious metal.

    The price can move due to a wide range of factors. Geopolitical instability or fears of a deep recession can quickly make Gold price escalate due to its safe-haven status. As a yield-less asset, Gold tends to rise with lower interest rates, while higher cost of money usually weighs down on the yellow metal. Still, most moves depend on how the US Dollar (USD) behaves as the asset is priced in dollars (XAU/USD). A strong Dollar tends to keep the price of Gold controlled, whereas a weaker Dollar is likely to push Gold prices up.


    Source link

  • EUR/USD climbs as US Dollar weakens on trade tensions

    EUR/USD climbs as US Dollar weakens on trade tensions


    • Euro edges higher amid US Dollar pressure after the White House pushes tariffs on Chinese ships, fueling global trade risks.
    • Trump reportedly furious with Fed Chair Powell; adviser says President reviewing legality of dismissal.
    • ECB’s Muller says lower energy prices and tariffs justify rate cut, though warns fragmentation may fuel inflation ahead.

    The Euro (EUR) advances against the US Dollar (USD) in muted trading as financial markets are closed on Good Friday. At the time of writing, EUR/USD trades at 1.1385, up 0.21%, lacking the strength to break the elusive 1.14 mark.

    EUR/USD up 0.21% in holiday-thinned trading as markets digest US-China shipping levies and renewed Fed independence concerns

    The financial markets’ narrative remains focused on the United States’ (US) controversial trade policies, which drove prices to dump the Greenback in favor of other G8 FX peers, like the shared currency.

    Still, the White House is moving forward with applying levies on Chinese ships docking at US ports, which would threaten to shake up global shipping routes and escalate the trade war between China and the US.

    On Thursday, breaking news revealed that President Trump was angered at Federal Reserve (Fed) Chair Jerome Powell and considered ousting him. Although market participants did not react to the headline, recently, White House Senior Adviser Kevin Hassett insisted that “Trump is studying whether firing Fed’s Powell is an option.”

    In the meantime, the US Dollar Index (DXY), which tracks the buck’s performance against a basket of six other currencies, falls 0.09%, down to 99.31.

    With the news flow light, European Central Bank’s (ECB) Madis Müller revealed that the drop in energy prices and tariffs supported the rate cut. He added that police do not remain a constraint and that key indicators are moving in the right direction. He also pointed out that a more fragmented economy could push prices up.

    EUR/USD Price Forecast: Technical outlook

    EUR/USD trades near the current week’s peak near 1.1400, with price action showing the Euro is poised to extend its gains past that area, opening the door for further upside. Key resistance levels are at the April 11 high at 1.1473, followed by 1.1498, the February 2022 peak, ahead of the 1.1500 figure.

    Euro FAQs

    The Euro is the currency for the 19 European Union countries that belong to the Eurozone. It is the second most heavily traded currency in the world behind the US Dollar. In 2022, it accounted for 31% of all foreign exchange transactions, with an average daily turnover of over $2.2 trillion a day.
    EUR/USD is the most heavily traded currency pair in the world, accounting for an estimated 30% off all transactions, followed by EUR/JPY (4%), EUR/GBP (3%) and EUR/AUD (2%).

    The European Central Bank (ECB) in Frankfurt, Germany, is the reserve bank for the Eurozone. The ECB sets interest rates and manages monetary policy.
    The ECB’s primary mandate is to maintain price stability, which means either controlling inflation or stimulating growth. Its primary tool is the raising or lowering of interest rates. Relatively high interest rates – or the expectation of higher rates – will usually benefit the Euro and vice versa.
    The ECB Governing Council makes monetary policy decisions at meetings held eight times a year. Decisions are made by heads of the Eurozone national banks and six permanent members, including the President of the ECB, Christine Lagarde.

    Eurozone inflation data, measured by the Harmonized Index of Consumer Prices (HICP), is an important econometric for the Euro. If inflation rises more than expected, especially if above the ECB’s 2% target, it obliges the ECB to raise interest rates to bring it back under control.
    Relatively high interest rates compared to its counterparts will usually benefit the Euro, as it makes the region more attractive as a place for global investors to park their money.

    Data releases gauge the health of the economy and can impact on the Euro. Indicators such as GDP, Manufacturing and Services PMIs, employment, and consumer sentiment surveys can all influence the direction of the single currency.
    A strong economy is good for the Euro. Not only does it attract more foreign investment but it may encourage the ECB to put up interest rates, which will directly strengthen the Euro. Otherwise, if economic data is weak, the Euro is likely to fall.
    Economic data for the four largest economies in the euro area (Germany, France, Italy and Spain) are especially significant, as they account for 75% of the Eurozone’s economy.

    Another significant data release for the Euro is the Trade Balance. This indicator measures the difference between what a country earns from its exports and what it spends on imports over a given period.
    If a country produces highly sought after exports then its currency will gain in value purely from the extra demand created from foreign buyers seeking to purchase these goods. Therefore, a positive net Trade Balance strengthens a currency and vice versa for a negative balance.


    Source link

  • Gold price eases below ,330 after record high as Powell flags stagflation risk

    Gold price eases below $3,330 after record high as Powell flags stagflation risk


    • Gold pulls back from $3,357 all-time high as Powell warns Fed’s goals may conflict, raising stagflation concerns.
    • Market mixed: Dow dips on UnitedHealth crash while other indices see modest gains.
    • Trump signals trade progress with EU and China; ECB cuts rates 25 bps, widening global policy divergence.

    Gold retreated on Thursday ahead of the Good Friday Easter holiday, losing 0.60%, after enjoying a rally of close to $400 gains during the last seven trading days on uncertainty about the United States’ (US) trade policies. /USD trades at $3,319 after hitting a record high of $3,357 earlier in the session.

    Market mood closed the last trading day of the week mixed, with two of the three main US indices posting gains, while the UnitedHealth Group plunge hit the Dow Jones. Wednesday’s speech by the Federal Reserve (Fed) Chair Jerome Powell continues to be digested by the markets.

    Fed Chair Powell turned hawkish, revealing that a weak economy and high inflation could conflict with the central bank’s two goals, making a stagflationary scenario possible.

    “We may find ourselves in the challenging scenario in which our dual-mandate goals are in tension,” he said. “If that were to occur, we would consider how far the economy is from each goal, and the potentially different time horizons over which those respective gaps would be anticipated to close.”

    Regarding trade talks, Trump said they’re doing well and added that he is very confident about a trade deal with the European Union (EU) and China.

    Data-wise, the European Central Bank (ECB) reduced rates by 25 basis points earlier and the US economic docket revealed the US labor market remains solid, but not so housing, after printing strong Building Permits figures, but weak Housing Starts.

    Daily digest market movers: Gold price falls as US yields rise

    • The US 10-year Treasury yield rises five basis points to 4.333%. US real yields followed suit, climbing five bps to 2.163%, as shown by the US 10-year Treasury Inflation-Protected Securities yields failing to cap Gold prices.
    • US Initial Jobless Claims for the week ending April 12 came in at 215K, down from 224K and below the 225K forecast—highlighting continued strength in the labor market.
    • Building Permits rose 1.6% to 1.482 million, exceeding the 1.45 million estimates. In contrast, Housing Starts dropped sharply from 1.494 million to 1.324 million, indicating softness in residential construction.
    • In rates markets, money market traders have priced in 86 basis points of Fed rate cuts by the end of 2025, with the first cut expected in July.

    XAU/USD technical outlook: Gold price retraces, but remains poised to test new record highs

    The uptrend in Gold prices remains despite retreating somewhat on Thursday, below the $3,330 figure. As the precious metals trim some of their earlier losses, price action indicates the lack of acceptance of lower prices, opening the door for further upside.

    From a momentum standpoint, the Relative Strength Index (RSI) is overbought but not near the 80 extreme level. Nevertheless, as the RSI aims lower, it suggests that a mean reversion move is on the cards. In the event of that outcome, XAU/USD’s first support would be the $3,300 figure. A breach of the latter will expose the April 16 daily low of $3,229.

    If bulls push prices past $3,350, they could test the year-to-date (YTD) peak, followed by $3,400.

    Gold FAQs

    Gold has played a key role in human’s history as it has been widely used as a store of value and medium of exchange. Currently, apart from its shine and usage for jewelry, the precious metal is widely seen as a safe-haven asset, meaning that it is considered a good investment during turbulent times. Gold is also widely seen as a hedge against inflation and against depreciating currencies as it doesn’t rely on any specific issuer or government.

    Central banks are the biggest Gold holders. In their aim to support their currencies in turbulent times, central banks tend to diversify their reserves and buy Gold to improve the perceived strength of the economy and the currency. High Gold reserves can be a source of trust for a country’s solvency. Central banks added 1,136 tonnes of Gold worth around $70 billion to their reserves in 2022, according to data from the World Gold Council. This is the highest yearly purchase since records began. Central banks from emerging economies such as China, India and Turkey are quickly increasing their Gold reserves.

    Gold has an inverse correlation with the US Dollar and US Treasuries, which are both major reserve and safe-haven assets. When the Dollar depreciates, Gold tends to rise, enabling investors and central banks to diversify their assets in turbulent times. Gold is also inversely correlated with risk assets. A rally in the stock market tends to weaken Gold price, while sell-offs in riskier markets tend to favor the precious metal.

    The price can move due to a wide range of factors. Geopolitical instability or fears of a deep recession can quickly make Gold price escalate due to its safe-haven status. As a yield-less asset, Gold tends to rise with lower interest rates, while higher cost of money usually weighs down on the yellow metal. Still, most moves depend on how the US Dollar (USD) behaves as the asset is priced in dollars (XAU/USD). A strong Dollar tends to keep the price of Gold controlled, whereas a weaker Dollar is likely to push Gold prices up.


    Source link

  • NEE Elliott Wave technical analysis [Video]

    NEE Elliott Wave technical analysis [Video]


    NEE Elliott Wave technical analysis

    Function: Counter trend.

    Mode: Corrective.

    Structure: Flat.

    Position: Wave (C) of 2.

    Direction: Bottoming in Wave (C).

    Details: Intermediate wave (C) appears to be near completion within a broader Primary wave 2 structure. This setup shows a three-wave corrective pattern, indicating the potential for a reversal.

    NEE Elliott Wave technical analysis

    Function: Counter trend.

    Mode: Corrective.

    Structure: Flat.

    Position: Wave 4 of (C).

    Direction: Downward continuation into Wave 5.

    Details: The current chart suggests wave 4 of (C) is concluding. One more leg down is expected to complete wave 5 of (C). The upward movement from the April 9th low reflects a three-wave correction, reinforcing the wave 4 count.

    This Elliott Wave analysis highlights the current technical scenario for NextEra Energy Inc. (NEE), using both daily and intraday perspectives. The charts reveal a continuing corrective pattern, which may soon transition into a bullish move following the completion of the current wave sequence.

    NEE’s daily chart presents a flat correction nearing the end of Primary wave 2. The unfolding of Intermediate wave (C) suggests that the market is approaching a potential reversal zone. This wave structure supports the expectation of a return to the primary bullish trend once the correction finalizes.

    The 1H chart aligns with the broader analysis, showing wave 4 of (C) nearing its conclusion. A further downward move is anticipated in wave 5 of (C). The internal subdivision confirms the corrective nature of this segment, making this a key area to watch for a potential pivot.

    Technical analyst: Alessio Barretta.

    NEE Elliott Wave technical analysis [Video]


    Source link

  • VanEck Rare Earth & Strategic Metals ETF (REMX) Elliott Wave technical analysis [Video]

    VanEck Rare Earth & Strategic Metals ETF (REMX) Elliott Wave technical analysis [Video]


    VanEck Rare Earth & Strategic Metals ETF – REMX (one-day) Elliott Wave technical analysis

    • Function: Countertrend.

    • Mode: Corrective.

    • Structure: Zigzag.

    • Position: Wave [c] of 4.

    • Direction: Bear Market Rally.

    • Invalidation Level: $32.36.

    Analysis summary

    The REMX ETF is currently in wave 4, which appears to be in its final subwave before completing the correction. This countertrend rally is anticipated to retrace between 38.2% to 50% of the previous wave 3 decline. A key confirmation of this expanded flat pattern will be breaking above the $51.10 high.

    Wave 4 is likely to terminate around the $57.12 level. Once completed, a new impulsive decline in wave 5 is expected to follow, taking prices below the origin of wave 4. Traders should monitor the structure carefully as the current pattern nears its conclusion.

    VanEck Rare Earth & Strategic Metals ETF – REMX (four-hour) Elliott Wave technical analysis

    • Function: Major Trend (Minor Degree).

    • Mode: Motive.

    • Structure: Impulse.

    • Position: Wave [c] (navy) of 4 (grey).

    • Direction: Rally.

    • Invalidation level: $32.35.

    Short-term outlook

    The intraday setup points to a fast-developing impulsive rally in wave [c], which is the final segment of wave 4. This leg is expected to take out the previous $51.10 high and extend toward the wave [a] high. A strong upward push is anticipated in the coming sessions, marking the end of this corrective phase.

    Conclusion

    REMX is positioned for a bullish move in the short to medium term. The target zone lies between $51.10 and $57.12, driven by the final stages of wave 4. This offers a potential opportunity for bullish ETF positions, with close monitoring of the invalidation levels to manage risk effectively.

    VanEck Rare Earth & Strategic Metals ETF (REMX) Elliott Wave technical analysis [Video]


    Source link

  • Mexican Peso slips as USD/MXN reclaims 20 despite tariff exemption hopes

    Mexican Peso slips as USD/MXN reclaims 20 despite tariff exemption hopes


    • Mexican Peso pares gains late in session as traders digest Trump’s shifting tariff stance and looming US tomato duties.
    • Sheinbaum continues talks to avoid steep tariffs; US to impose 20.91% duty on Mexican tomatoes from July 14.
    • Traders eye Mexico’s inflation and retail data, while US Retail Sales and Jobless Claims remain i

    The Mexican Peso reversed its course and dropped against the US Dollar late in the North American session, with no catalyst behind the latter move as market participants digest Trump’s tariff rhetoric, which of late hinted at making exemptions on semiconductors and electronics. At the time of writing, the USD/MXN climbs back above the 20.00 figure and gains over 0.12%.

    Mexico’s President Claudia Sheinbaum continued negotiating with her US counterpart to avoid Trump’s higher tariffs. At the same time, the US Commerce Department announced that tomatoes imported from Mexico to the US would be subject to 20.91% tariffs from July 14.

    Meanwhile, Reuters revealed that a report suggested Japan’s Honda is considering relocating some car production to the US to avoid tariffs.

    Across the border, the economic docket revealed that US import prices fell in March due to decreasing energy prices, as the US Labor Department showed on Tuesday.  According to analysts quoted by Reuters, the effects of tariffs have not been felt.

    Ahead in the docket, Mexico will feature Retail Sales, mid-month inflation for April, and Economic Activity for February. In the US, Retail Sales would also be featured on Wednesday, followed by housing and Initial Jobless Claims data.

    Daily digest market movers: Mexican Peso hurt by tariffs, retreats

    Mexico’s Retail Sales in January were 0.6% MoM and 2.7% YoY. If Wednesday’s data falls below those figures, it would be another signal that the economy is slowing down, as Banco de Mexico (Banxico) Governor Victoria Rodriguez Ceja mentioned.

    Before the Senate, Victoria Rodriguez Ceja said the Governing Board is still unsatisfied with the inflation rate, which stood at 3.8% YoY in March, though far from the 3% target. She added that the disinflation process and the economic slowdown justify Banxico’s dovish approach and hinted that the central bank might continue easing policy.

    This would keep the USD/MXN underpinned as the interest rate differential between Mexico and the United States will reduce. For the upcoming meetings, Banxico is expected to lower rates by 50 basis points (bps) while the Federal Reserve (Fed) hinted they will keep rates unchanged.

    Money market players had priced in 85 bps of easing toward the end of 2025. The first cut is expected in July.

    US Retail Sales in March are expected to rise 1.3% Month over Month, up from 0.2% in February. Meanwhile, Industrial Production is projected to contract by 0.2% Month over Month, down from 0.7% expansion for the same period.

    USD/MXN technical outlook: Mexican Peso depreciates as USD/MXN surpasses 20.00

    The USD/MXN uptrend stays alive, yet the exotic pair fell briefly below 20.00, near the 200-day Simple Moving Average (SMA) at 19.86. However, it seems poised to close the day above 20.00, paving the way for buyers to push prices higher.

    If buyers drive the exotic pair past April 14’s high of 20.29, the next resistance would be the confluence of the 50-day and 100-day Simple Moving Averages (SMAs) near 20.30 /36, followed by the 20.50 figure. Once hurdle, the next stop would be the April 9 daily peak of 21.07. Conversely, if USD/MXN tumbles below 20.00, look for a test of the 200-day SMA at 19.86.

    Mexican Peso FAQs

    The Mexican Peso (MXN) is the most traded currency among its Latin American peers. Its value is broadly determined by the performance of the Mexican economy, the country’s central bank’s policy, the amount of foreign investment in the country and even the levels of remittances sent by Mexicans who live abroad, particularly in the United States. Geopolitical trends can also move MXN: for example, the process of nearshoring – or the decision by some firms to relocate manufacturing capacity and supply chains closer to their home countries – is also seen as a catalyst for the Mexican currency as the country is considered a key manufacturing hub in the American continent. Another catalyst for MXN is Oil prices as Mexico is a key exporter of the commodity.

    The main objective of Mexico’s central bank, also known as Banxico, is to maintain inflation at low and stable levels (at or close to its target of 3%, the midpoint in a tolerance band of between 2% and 4%). To this end, the bank sets an appropriate level of interest rates. When inflation is too high, Banxico will attempt to tame it by raising interest rates, making it more expensive for households and businesses to borrow money, thus cooling demand and the overall economy. Higher interest rates are generally positive for the Mexican Peso (MXN) as they lead to higher yields, making the country a more attractive place for investors. On the contrary, lower interest rates tend to weaken MXN.

    Macroeconomic data releases are key to assess the state of the economy and can have an impact on the Mexican Peso (MXN) valuation. A strong Mexican economy, based on high economic growth, low unemployment and high confidence is good for MXN. Not only does it attract more foreign investment but it may encourage the Bank of Mexico (Banxico) to increase interest rates, particularly if this strength comes together with elevated inflation. However, if economic data is weak, MXN is likely to depreciate.

    As an emerging-market currency, the Mexican Peso (MXN) tends to strive during risk-on periods, or when investors perceive that broader market risks are low and thus are eager to engage with investments that carry a higher risk. Conversely, MXN tends to weaken at times of market turbulence or economic uncertainty as investors tend to sell higher-risk assets and flee to the more-stable safe havens.


    Source link