Global markets have entered a fragile calmness as investors await the next major catalyst. With only second-tier data scheduled and Fed officials in their pre-meeting blackout period, the usual policy signals that guide markets are temporarily absent. Barring any dramatic geopolitical development, this vacuum has shifted the spotlight entirely onto technical levels.
The first critical area to watch lies in the U.S. equity market. While the broader indexes have shown some resilience, the weakness in U.S. futures suggests a cautious hand-off to the regular trading session. The key to watch is this week’s low of 46,615.52 in DOW. While a breach of this level seems unlikely within the next few hours, a move in that direction would signal that the “buy the dip” sentiment is fading. Such a development could quickly shift market psychology toward defensive positioning, especially given the heightened geopolitical risks surrounding the Iran war.
Meanwhile, the bond market is delivering its own warning signal through the sharp rise in Treasury yields. 10-year yield surged above 4.2% handle yesterday, highlighting persistent concerns that the energy shock caused by the conflict could reignite inflation pressures. Remaining above 4.2% suggests that markets are beginning to price in a scenario where inflation proves more persistent than expected. In that case, the Fed may be forced to turn to a more hawkish stance despite broader concerns about global growth.
If yields extend toward the 4.3% level, it would reinforce the view that investors expect the Fed to signal stronger inflation vigilance at next week’s meeting. The market would effectively be preparing for a shift away from the earlier narrative of steady policy easing in 2026.
Oil markets are the third and most volatile piece of the current puzzle. Brent crude’s return to the 100 level represents a major psychological barrier for traders and a critical threshold for global inflation expectations. What makes the move particularly striking is that it comes despite the IEA’s unprecedented 400-million-barrel reserve release. Rather than suppressing prices, the intervention has highlighted the scale of the supply disruption currently facing global energy markets.
These three forces—equities, bond yields and oil prices—are now closely interconnected. A sustained break above $100 in oil would likely push Treasury yields higher as inflation expectations rise, which in turn could place additional pressure on equity markets.
In the currency market, Aussie remains the strongest currency for the week so far as markets continue to price in aggressive RBA tightening. Dollar follows, while Kiwi ranks third. Swiss Franc sits at the bottom of the table, followed by Euro and Yen, with Sterling and the Canadian Dollar trading closer to the middle of the performance spectrum.
In Europe, at the time of writing, FTSE is down -0.40%. DAX is down -0.35%. CAC is down -0.55%. UK 10-year yield is up 0.067 at 4.691. Germany 10-year yield is up 0.009 at 2.949. Earlier in Asia, Nikkei fell -1.04%. Hong Kong HSI fell -0.70%. China Shanghai SSE fell -0.10%. Singapore Strait Times fell -0.17%. Japan 10-year JGB yield rose 0.022 to 2.188.
US initial jobless claims fall to 213k, vs exp 215k
US initial jobless claims fell -1k to 213k in the week ending March 7, below expectation of 215k. Four-week moving average of initial claims fell -4k to 212k.
Continuing claims fell -21k to 1,850k in the week ending February 28. Four-week moving average of continuing claims fell -500 to 1,852k.
USD/JPY Mid-Day Outlook
Daily Pivots: (S1) 158.23; (P) 158.60; (R1) 159.34; More…
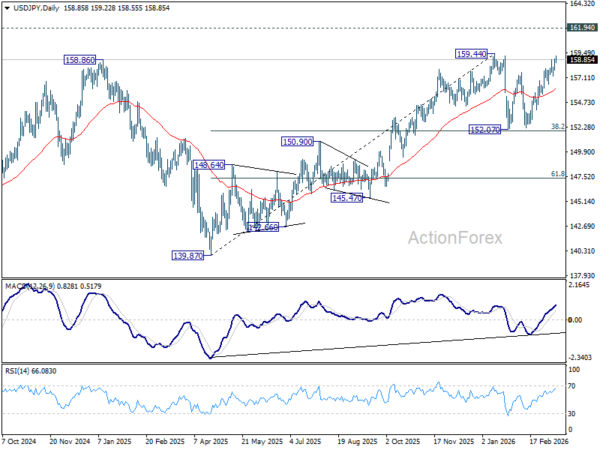
Intraday bias in USD/JPY remains on the upside as rise from 152.07 is still in progress. Firm break of 159.44 will target 161.94 high next. On the downside, below 157.26 support will turn intraday bias neutral again. Overall, price actions from 159.44 are viewed as a near term consolidation pattern. Outlook will remain bullish as long as 38.2% retracement of 139.87 to 159.44 at 151.96 holds.
In the bigger picture, outlook is unchanged that corrective pattern from 161.94 (2024 high) should have completed with three waves at 139.87. Larger up trend from 102.58 (2021 low) could be ready to resume through 161.94. This will remain the favored case as long as 55 W EMA (now at 152.16) holds. However, sustained break of 55 W EMA will argue that the pattern from 161.94 is extending with another falling leg.