Global PMI data for April paints a clear picture: the Iran war shock is now feeding through the world economy, but not in a uniform way. Rising energy costs and supply disruptions are hitting all major regions, yet the transmission differs sharply depending on economic structure, demand conditions, and policy constraints. What emerges is not synchronized slowdown, but fragmented stagflation.
The common thread is unmistakable. Across Australia, Japan, the Eurozone and the UK, businesses are reporting surging input costs, longer delivery times, and a growing need to secure supplies ahead of further disruptions. Energy, shipping, and raw materials are the key drivers, with the Strait of Hormuz disruption acting as the central transmission channel. The result is a broad-based cost shock now pushing through supply chains globally.
Nowhere is the impact clearer than in the Eurozone. The Flash Composite PMI fell into contraction, driven by a sharp collapse in services, the weakest since the pandemic period. The region’s heavy reliance on imported energy makes it particularly vulnerable to the “Hormuz gap,” where supply disruption translates quickly into both higher prices and weaker demand. While manufacturing remains in expansion, this strength is largely artificial, driven by stockpiling rather than genuine demand. The Eurozone is already slipping into a stagflationary phase—falling growth alongside rising prices.
The UK is showing a different pattern, but one that may prove equally fragile. PMI data rebounded, With Manufacturing reaching a multi-year high. However, this strength is being driven by front-loaded demand, as firms rush to secure inputs before costs rise further. Price pressures have surged at rates not seen outside the pandemic, and supply delays are intensifying. Growth is being pulled forward, suggesting that the current expansion may not be sustainable.
Australia presents a classic policy trap. The Composite PMI returned to expansion, but manufacturing output remains in contraction, pointing to underlying weakness. At the same time, cost pressures have surged to the highest level in nearly four years. This creates a “nightmare scenario” for the Reserve Bank of Australia: growth is fragile, yet inflation is being pushed higher by external shocks, leaving limited room for policy flexibility.
Japan’s case is more nuanced but no less challenging. Manufacturing is surging, with PMI at 54.9 and output at multi-year highs, supported by export demand and precautionary production. However, services are slowing, and input costs are rising rapidly. The weak Yen is acting as a double-edged sword—boosting exports while sharply increasing the cost of imported energy and raw materials. Rather than broad inflation, Japan is experiencing a margin squeeze, with companies struggling to pass through rising costs.
| Economy | Growth Impact | Inflation Impact | Overall Risk |
|---|---|---|---|
| Eurozone | Sharp slowdown | Strong | Stagflation 🔴 |
| UK | Temporary rebound | Very strong | Delayed slowdown 🟠 |
| Australia | Fragile | Rising | Policy trap 🟠 |
| Japan | Mixed (exports up) | Imported inflation | Margin squeeze 🟡 |
Across all regions, a key feature is the role of stockpiling. Firms are accelerating purchases and building inventories in anticipation of further supply disruptions and price increases. This behavior is temporarily boosting manufacturing activity but is unlikely to be sustained. Once inventories are rebuilt or demand weakens, production could slow sharply.
Inflation dynamics are also shifting. This is no longer just an energy story. While oil remains the initial trigger, price increases are spreading across goods and services, reflecting both supply constraints and precautionary pricing behavior. The risk of second-round effects is rising, particularly in Europe and the UK, where cost pass-through is more immediate.
Central banks are now facing increasingly complex trade-offs. The European Central Bank is confronted with contraction and inflation simultaneously, limiting its policy options. The Bank of England and Reserve Bank of Australia are facing pressure to tighten policy even as growth shows signs of fragility. The Bank of Japan remains more cautious but is not immune to rising cost pressures.
The broader takeaway is clear. The oil shock from the Iran war is not producing a synchronized global slowdown, but a fragmented and uneven adjustment. Europe is already contracting, the UK is front-loading growth, Australia is caught in a policy trap, and Japan is absorbing the shock through costs.
Ultimately, this divergence is likely to define the next phase of the global cycle. Markets will increasingly differentiate between regions based on how they absorb the shock. The common factor remains oil—and as long as supply risks persist, the inflationary pressure will continue to shape both policy and market direction.
US Initial Unemployment Claims Edge Higher to 214k
UK PMI Composite rises to 52.0 and Manufacturing Surges to 47-Month High
Eurozone PMI Composite Falls to 48.6, Signals -0.1% GDP Contraction in Q2
Japan PMI Composite Falls to Four-Month Low, Out Prices Hit Record
Australia Composite PMI Back in Expansion, Price Pressures Highest in Nearly Four Years
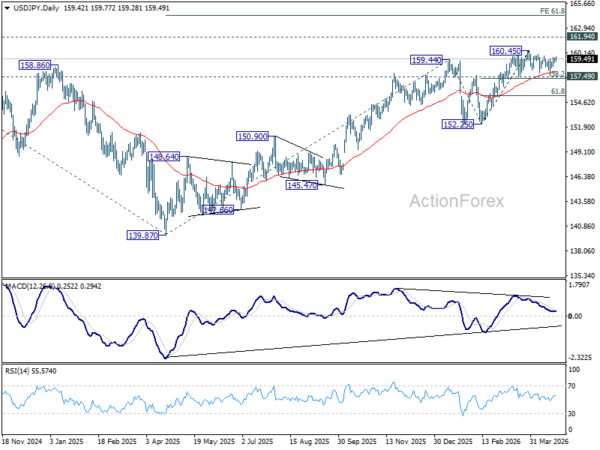
USD/JPY Mid-Day Outlook
Daily Pivots: (S1) 159.20; (P) 159.38; (R1) 159.66; More…
USD/JPY edged higher today, but remains bounded in established range below 160.45. Intraday bias remains neutral and more consolidations could still be seen. Further rise is expected with 157.49 cluster support (38.2% retracement of 152.25 to 160.45 at 157.31) intact. On the upside break of 160.45 will target a retest on 161.94 high. However, firm break of 157.31/49 will bring deeper fall back to 61.8% retracement at 155.38 next.
In the bigger picture, outlook is unchanged that corrective pattern from 161.94 (2024 high) should have completed with three waves at 139.87. Larger up trend from 102.58 (2021 low) could be ready to resume through 161.94. This will remain the favored case as long as 55 W EMA (now at 153.80) holds. Firm break of 161.94 will pave the way to 61.8% projection of 102.58 to 161.94 from 139.87 at 176.75.