For the first time since the US-Iran conflict erupted in late February, financial markets can plausibly see a genuine path toward peace. Reports throughout the week indicated that the United States and Iran are closer than at any point since hostilities began to signing the Islamabad Memorandum of Understanding, a framework that would pause fighting, reopen the Strait of Hormuz and allow Iranian oil exports to resume. Oil traders responded decisively. Brent crude plunged from above $98 earlier in the week to $86 by Friday as geopolitical risk premium evaporated.
The relief was felt across global markets. US stocks staged a powerful rebound after appearing headed for another week of heavy losses, while safe-haven demand faded and Dollar weakened against most major currencies. Yet the reaction outside oil markets was noticeably restrained. Major US equity indexes remained well below the record highs posted earlier in the month. Dollar held comfortably above the previous week’s lows against all major peers. Meanwhile, US 10-year Treasury yield stayed anchored near the 4.5% mark despite the sharp decline in crude prices.
That divergence reveals what investors are really focused on now. The market is no longer asking whether the conflict will end. Instead, it is beginning to assess the economic consequences of more than three months of elevated energy prices, disrupted supply chains and rising inflation pressures. While peace in the Middle East would remove an important source of uncertainty, it cannot undo the inflation shock that has already worked its way into producer prices, consumer prices and central bank thinking. The war risk premium may be disappearing, but the inflation premium is proving far more persistent.
Peace Is Near: Why Oil Suddenly Collapsed
The biggest move of the week was not in stocks, bonds or currencies. It was in oil. Brent crude plunged from above $98 to below $86 as traders aggressively dismantled the geopolitical risk premium that had accumulated over more than three months of conflict. The speed of the decline reflected a dramatic reassessment of the probability of a diplomatic breakthrough between the United States and Iran. For the first time since the war began, markets are treating peace as the base case rather than merely a possibility.
At the center of the optimism is the proposed Islamabad Memorandum of Understanding. According to officials and media reports from both sides, negotiators have largely agreed on a framework that would establish a 60-day cooling-off period while postponing the most difficult disputes, including Iran’s nuclear program and frozen financial assets, to future negotiations. Pakistani Prime Minister Shehbaz Sharif, who has played a key mediating role, announced that an agreed text has been reached, while Iranian Foreign Minister Abbas Araghchi said a deal “has never been closer.” US officials have reportedly assessed that negotiations are roughly 80% to 85% complete.
The framework carries significant implications for global energy markets because it directly addresses the Strait of Hormuz, the world’s most important oil shipping route. Under the reported terms, Iran would halt hostilities, clear naval mines deployed during the conflict and restore shipping volumes to pre-war levels within 30 days. In exchange, the United States would remove the naval blockade imposed on Iranian ports and allow Iranian oil exports to return to global markets. Together, these measures would dramatically reduce concerns over supply disruptions and effectively reverse some of the most inflationary consequences of the conflict.
Of course, the agreement is not signed yet, and negotiations remain vulnerable to last-minute setbacks. But markets are increasingly behaving as though a deal will eventually emerge. The collapse in oil prices reflects a growing belief that the worst-case scenario for global energy supplies is fading. The focus is no longer on whether Hormuz will remain closed. It is on how quickly normal shipping and oil flows can be restored once a deal is finalized.
Technically, near-term bearishness in Brent crude is increasing after prices were rejected by the falling 55 D EMA (now at 96.80). As long as the 55 D EMA caps upside attempts, further decline is favored toward 61.8% retracement of 58.72 to 119.50 at 82.04. Notably, this level also coincides with the lower boundary of the medium-term falling channel that has guided price action since March, making it a key test zone for the current downtrend.
Selling momentum could begin to slow around the 82 area as even under a signed US-Iran agreement, the physical normalization of oil flows through the Strait of Hormuz will be gradual rather than immediate. Nevertheless, a decisive break below 82.04 would suggest traders are looking beyond diplomatic promises and beginning to price actual supply normalization.
Markets Cheer, But Not Wholeheartedly
The progress toward a US-Iran agreement sparked a powerful relief rally in the stock markets, but investors stopped well short of embracing a full risk-on narrative. Beneath the surface, markets were noticeably more cautious than the moves in oil prices might suggest. Major US stock indexes remained well below the record highs reached earlier this month.
The reason is straightforward. Investors understand that reopening Hormuz and restoring Iranian oil exports may prevent extending the inflation shock, but it cannot erase the damage already done. The global economy has spent more than three months dealing with elevated energy costs, disrupted shipping routes and rising input prices.
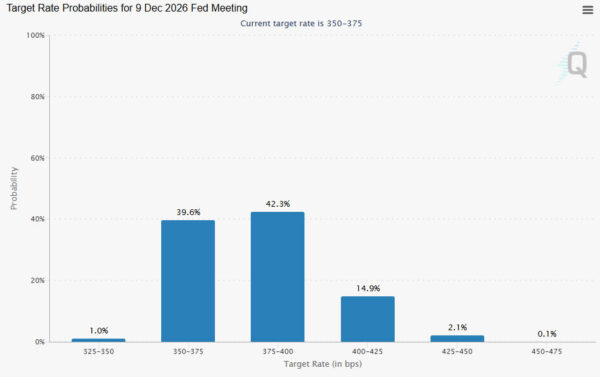
This week’s US inflation data reinforced that reality. Headline CPI accelerated to a three-year high of 4.2%, while producer prices climbed 6.5% yoy, highest since 2022. That inflation backdrop is keeping Fed risks alive. Fed funds futures are pricing in around a 60% chance of another rate hike by year-end, reflecting concerns that the central bank may need to respond if inflation proves more persistent than expected. The prospect of tighter monetary policy is likely to limit valuation expansion and prevent equities from fully embracing the peace narrative.
In other words, even if the geopolitical situation improves significantly, investors still need to contend with the possibility of higher-for-longer interest rates.
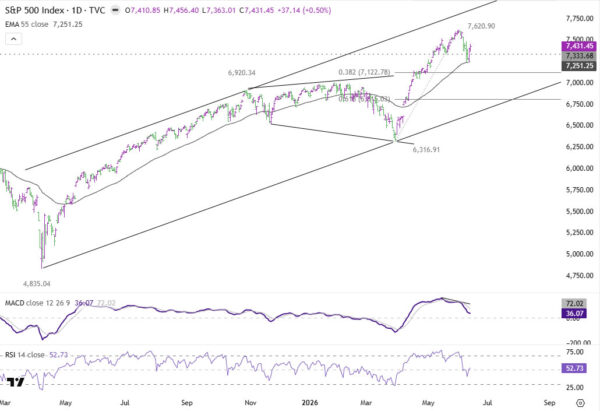
For S&P 500, the technical outlook has become more cautious. The break of 7,333.68 support suggests that the rally from 6,316.91 has already completed at 7,620.90, with bearish divergence visible on daily MACD. Initial support emerged from 55 D EMA (now at 7,251.25), helping stabilize the pullback.
However, any rebound is likely to remain capped by the 7,620.90 record high. Another decline toward 38.2% retracement of 6,316.91 to 7,620.90 at 7,122.78 is expected as the correction extends, with risk of a deeper correction toward 61.8% retracement at 6,815.03 if inflation and Fed concerns intensify.
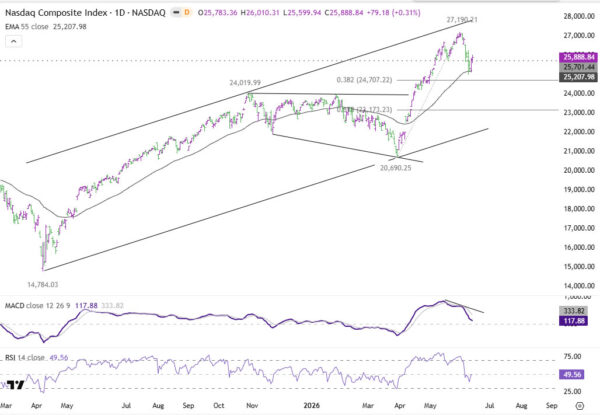
For NASDAQ, the picture has turned more corrective too. The break of 25,888.84 support suggests that the advance from 20690.25 has already completed at 27,190.21. While support emerged from 55 D EMA (now at 25207.98), any rebound should remain capped by the 27,190.21 peak.
As the corrective phase develops, another decline toward the 38.2% retracement of 20,690.25 to 27,190.21 at 24,707.22 is expected. Risk also remains for a deeper pullback toward the 61.8% retracement at 23,173.13 if inflation concerns continue to dominate the narrative.
Oil Says Peace, Yields Say Inflation
One of the most important developments this week was not what Treasury yields did, but what they failed to do. Given the collapse in oil prices and the growing prospect of a US-Iran agreement, bond markets had every reason to rally aggressively. Instead, the benchmark US 10-year yield merely edged lower and remained firmly anchored near the psychologically important 4.5% level. The contrast with oil could hardly have been sharper. While crude markets are increasingly pricing peace, bond markets continue to price inflation persistence.
In addition to elevated inflation prints, the US labor market continues to show remarkable resilience. Non-farm payrolls increased by 172k in May, more than double market expectations, while unemployment held steady at 4.3%. For bond traders, these are not the ingredients of a rapidly cooling economy.
In other words, lower oil prices may help reduce future inflation risks, but they do not erase inflation already embedded in wages, services and business costs. The market increasingly believes that Fed will have to keep policy restrictive for longer, even if it ultimately avoids another rate hike. That explains why Treasury yields have remained stubbornly elevated despite improving geopolitical conditions.
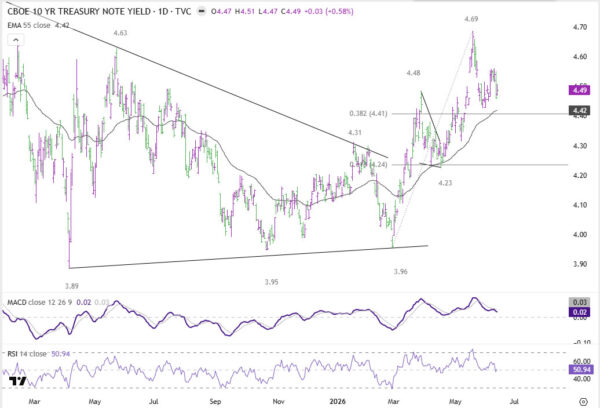
Technically, current development suggests that the price actions from 4.69 short term top are developing into a sideway pattern. The range is set between 38.2% retracement of 3.96 to 4.69 at 4.41, and 4.69 high. The rising 55 D EMA (now at 4.42) could push 10-year yield for a rebound later to retest 4.69.
Only a decisive break below 4.41 would argue that yields are undergoing a more meaningful reversal, opening the way toward 61.8% retracement at 4.24 and potentially signaling a broader shift in the inflation and interest-rate outlook.
Dollar’s Next Move Depends More on Fed Than Iran
Dollar Index spent most of the week in range as easing geopolitical tensions reduced demand for safe-haven assets. However, despite ending lower against most major peers, the greenback comfortably held above last week’s lows, indicating that investors remain reluctant to establish aggressive bearish positions.
That hesitation reflects an important shift in market thinking. The greenback is increasingly looking at a different source of support: the US economy itself. Inflation remains well above target, producer prices continue to accelerate and labor market conditions remain firm. The prospect of a peace agreement may reduce one risk, but it does not eliminate the possibility that Fed will need to maintain restrictive policy for longer than many central banks elsewhere.
In this regard, Dollar is entering a new phase. If inflation continues to surprise on the upside and Treasury yields remain elevated, the narrative could shift fully toward Fed tightening risk. That would likely support Dollar even in an environment of improving global risk sentiment.
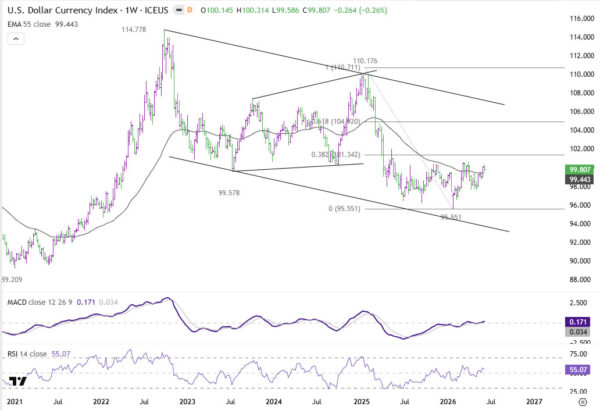
Technically, further rise is expected as long as 98.75 support holds. Retest of 100.64 resistance should be seen next. And break will target 38.2% retracement of 110.71 to 95.55 at 101.34.
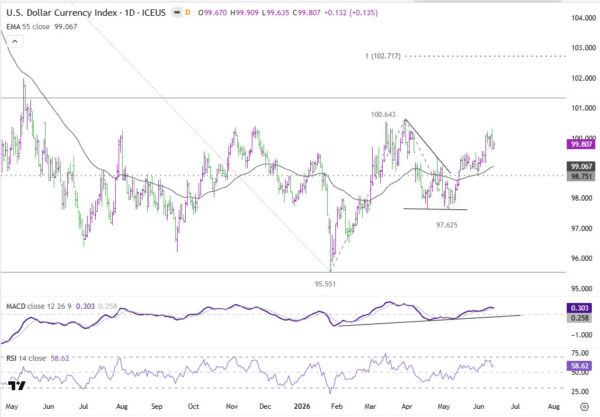
However, with oil prices collapsing and Middle East tensions easing, a decisive break through 101.34 may prove more difficult. Such a move would likely require a deeper correction in equities or a more complete transition toward a Fed-driven narrative centered on persistent inflation and higher-for-longer interest rates.
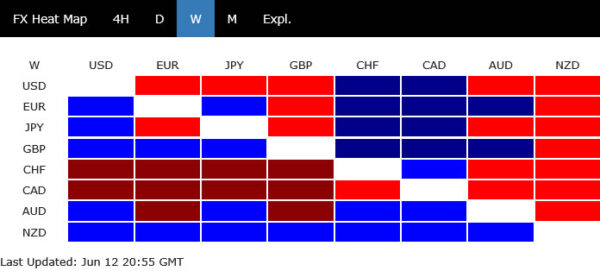
Weekly Currency Performance: Central Banks Regain Control of Markets
The strongest currencies of the week all shared a common feature: they retained some degree of tightening optionality. Kiwi led the rankings, followed by Sterling and Euro. In Sterling’s case, resilient economic data and lingering expectations for a possible BoE hike later this year continued to provide support. Euro benefited from ECB’s quarter-point rate increase and the message from hawks such as Joachim Nagel that additional tightening cannot be ruled out entirely. Kiwi’s gains were less convincing from a technical perspective, however, as the currency remained capped below recent highs and appeared to be consolidating losses rather than establishing a fresh uptrend.
Meanwhile, the weakest currencies were generally associated with central banks that are firmly on hold. The collapse in oil prices directly undermined one of CAD’s most important sources of support. Yet Loonie’s challenges extend beyond energy markets. BoC left rates unchanged this week and reiterated its preference to look through the temporary inflation effects of higher oil prices where possible. Swiss Franc also struggled as markets continued to price SNB remaining at 0% throughout the remainder of 2026.
Dollar ranked third from the bottom, but its performance was more encouraging than the ranking suggests. The greenback finished above the previous week’s lows against every major peer, reinforcing the view that recent weakness was merely a correction within a broader recovery. Yen and Aussie ended in the middle of the pack.
EUR/USD Weekly Outlook
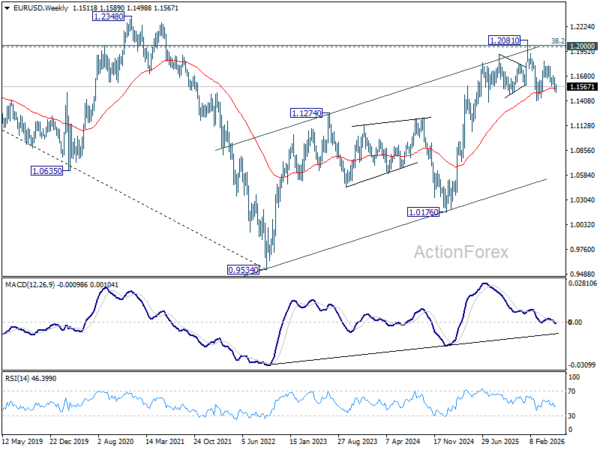
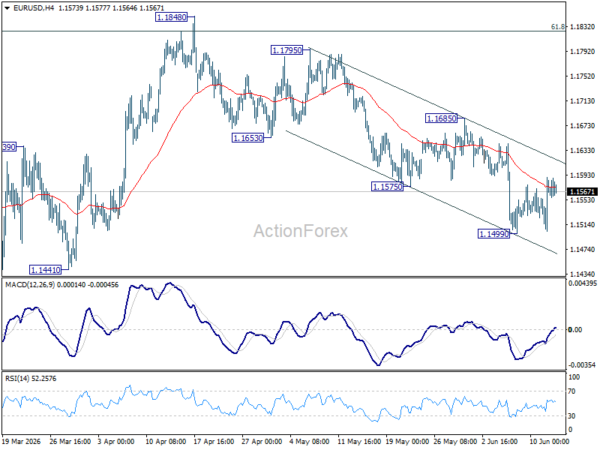
EUR/USD edged lower to 1.1499 last week but recovered since then. Initial bias remains neutral this week for consolidations. Risk will stay on the downside as long as 1.1685 resistance holds. Break of 1.1499 will resume the fall from 1.1848 towards 1.1408 support. However, firm break of 1.1685 will argue that fall from 1.1848 has completed, and bring stronger rally.
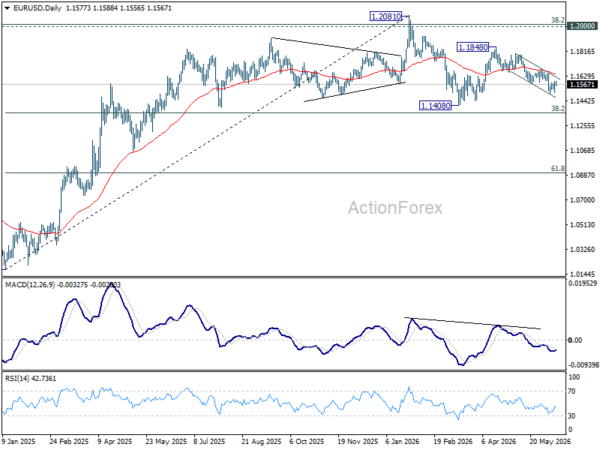
In the bigger picture, the strong support from 38.2% retracement of 1.0176 to 1.2081 at 1.1353 suggests that the pullback from 1.2081 is more likely a corrective move. Strong support was also found in 55 W EMA (now at 1.1548). Focus is back on 1.2 key cluster resistance level. Decisive break there will carry long term bullish implications. Nevertheless, break of 1.1408 support will revive the case of medium term bearish trend reversal.
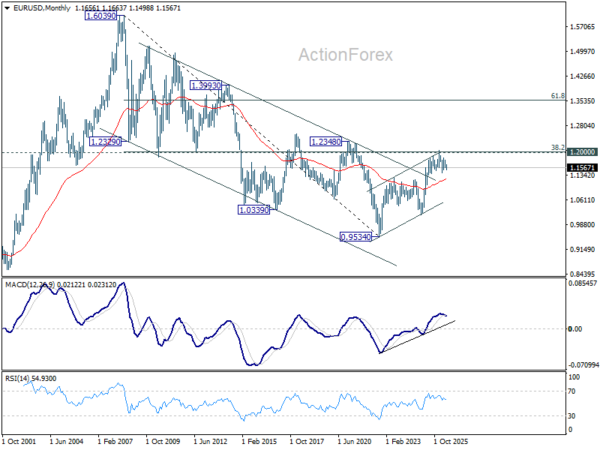
In the long term picture, 38.2% retracement of 1.6039 to 0.9534 at 1.2019, which is close to 1.2000 psychological level is the key for the outlook. Rejection by this level will keep the multi decade down trend from 1.6039 (2008 high) intact, and keep outlook neutral at best. However, decisive break of 1.2000/19, will suggest long term bullish trend reversal, and target 61.8% retracement at 1.3554.