
Gold and Silver came under renewed pressure after the Federal Reserve delivered a more hawkish-than-expected set of projections, prompting investors to quickly price in another rate hike later this year. While the Fed left rates unchanged at 3.50%-3.75%, the updated dot plot showed that policymakers have become increasingly concerned about inflation persistence. The median projection now implies one additional hike before year-end, a significant shift from expectations just a few months ago.
However, the bigger story may lie beneath the median. Markets have focused on the fact that nine policymakers now project at least one hike this year. Less attention has been paid to the six members who already see two or more hikes as appropriate, including one official projecting three increases. That means one-third of the Committee believes inflation risks could require considerably tighter policy than markets currently anticipate. If core CPI or PCE data remain elevated through the summer, it would take only a modest shift in projections for the median outlook to move from one hike to two.
That possibility matters greatly for precious metals. For now, markets are pricing one additional move, with September increasingly viewed as the most likely window given the release of a new Summary of Economic Projections. But if investors begin to contemplate a second hike, expectations for higher real yields and a stronger Dollar could intensify. In that scenario, Gold’s 4,000 psychological support and Silver’s 60 level may come under much greater pressure than they do today.
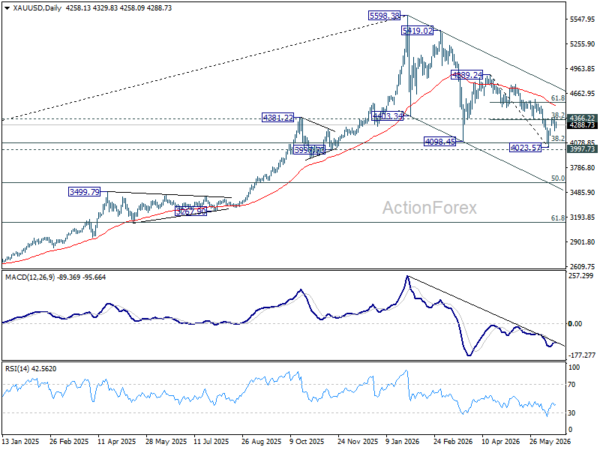
Technically, Gold’s rally have stalled at exactly the wrong place. The spike to 4,382.84 looks like a bull trap after prices quickly fell back below the 4,354.25-4,366.22 cluster resistance zone, which includes 38.2% retracement of 4,889.24 to 4,023.57. The failure to establish a foothold above that barrier suggests the rebound from 4,023.57 may already be complete. Near-term bias has turned mildly bearish for a retest of that low, while the broader decline from 4,889.24 and the larger downtrend from 5,598.38 remain intact.
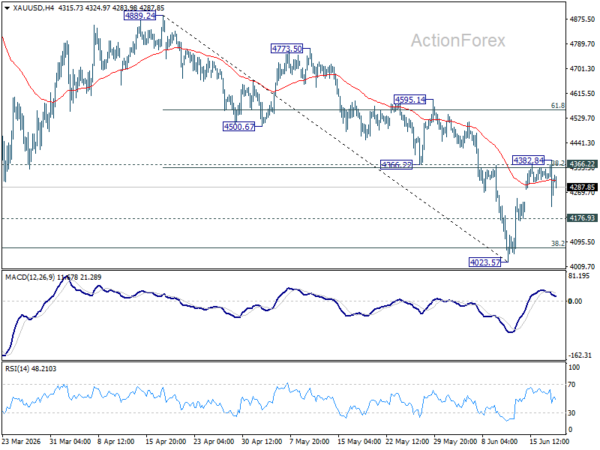
The technical backdrop remains challenging. Gold continues to trade comfortably below its falling 55 D EMA, now at 4,517.79, while remaining inside the medium-term descending channel that has guided price action throughout this year. These conditions favor an eventual break below the 4,000 psychological level. Nevertheless, a decisive move back above the 4,354-4,366 resistance zone would force a reassessment and raise the probability that a more durable bullish reversal is underway.
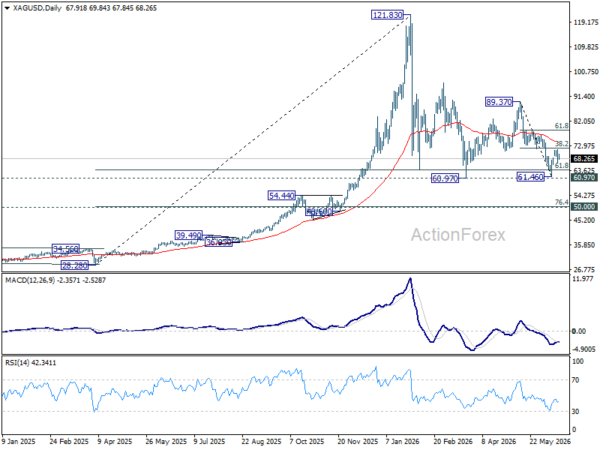
Silver is telling a similar story. The rebound from 61.46 appears to have completed at 71.54, just ahead of a key resistance cluster around 71.75 and 38.2% retracement of 89.37 to 61.46 at 72.12. The rejection there suggests the recovery was corrective rather than the start of a new uptrend. As a result, deeper losses toward a retest of 61.46 are favored.
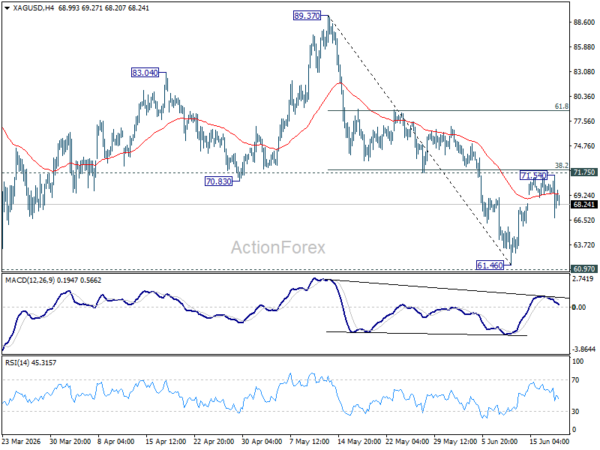
Silver also remains capped well below its falling 55 D EMA at 74.30, preserving the broader bearish structure. While 60.97 remains important support, the balance of risks still points toward an eventual break if Fed tightening expectations continue to build.
For now, range trading may dominate as investors wait for more clarity on the inflation outlook and the Fed’s next move. But the message from both the charts and the dot plot is aligned. One hike is now the base case, and that would keep Gold and Silver in range. If the market starts to believe there could be two, Gold and Silver may face a much tougher second half of the year.