
TL;DR: Gold and Silver kept falling Friday even as US Treasury yields and the Dollar both declined—a break from the usual macro playbook. With tech stocks pressured by AI-spending concerns and crypto unsettled by the Binance breach, position-cutting across volatile assets is a plausible explanation, though not yet a confirmed one. Gold’s 3,942.71 and Silver’s $50 level are the next tests.
Why This Matters
Gold and Silver continued falling on Friday despite lower US Treasury yields and a weaker Dollar. Gold briefly broke below 3,975 before recovering toward 4,000, while Silver dropped more than 2% to around 50.90 and Platinum lost approximately 3%.
The weakness came as technology stocks remained under pressure from concerns over AI investment spending, while cryptocurrencies were unsettled by the major security incident at Binance. That overlap raises an important question: are investors reducing positions across volatile assets rather than responding primarily to conventional interest-rate signals?
The price action is consistent with that interpretation, but does not yet establish it. What makes the current sell-off unusual is that precious metals are declining even as two of their traditional macro headwinds—Treasury yields and Dollar—are moving lower.
Falling Yields and Dollar Fail to Support Precious Metals
The US 10-year Treasury yield retreated toward 4.93%, while the 2-year yield traded around 4.59%. Dollar Index also weakened toward 101.67.
Under more conventional circumstances, falling yields and a softer Dollar would offer some support to non-yielding precious metals. Lower yields reduce the opportunity cost of holding Gold, while Dollar weakness makes dollar-denominated metals less expensive for buyers using other currencies.
Yet neither development has been sufficient to halt the selling.
Persistent US inflation and expectations for further Fed tightening remain potential headwinds. September’s headline PCE inflation accelerated to 3.6%, and markets continued to price a high probability of another rate increase in December.
But the decline in yields and Dollar suggests that the usual monetary-policy explanation does not fully account for the latest metals weakness. Other forces appear to be influencing short-term price behaviour.
The divergence is particularly striking in Silver and Platinum, which have suffered substantially larger percentage losses than Gold. That shows selling pressure is uneven across precious metals, although the available evidence does not establish whether positioning, liquidity or other market-specific factors are responsible.
Technology and Crypto Selling Point to Broader Positioning Pressure
One possible explanation lies in the simultaneous weakness across technology equities and cryptocurrencies.
Alphabet’s 12.64% plunge on Thursday intensified concerns about whether the enormous capital expenditure associated with AI infrastructure can generate sufficient financial returns. Disappointing developments at Amazon and Intel added to the pressure, while Asian semiconductor stocks suffered substantial losses on Friday.
Separately, Binance disclosed a major security incident with an estimated financial impact of approximately $6.3B, introducing another source of uncertainty into cryptocurrency markets. Bitcoin traded near $78,000 after extending its recent decline.
These are independent developments. The AI-related equity sell-off reflects concerns about investment returns and valuations, while the Binance incident raises questions about exchange security and confidence.
But the two shocks occurred within the same period, alongside weakness in precious metals.
That pattern is consistent with investors reducing exposure across several volatile markets, potentially selling assets that might otherwise attract defensive demand.
The Treasury rally adds another dimension. Investors appear willing to seek protection in government bonds, yet Gold and Silver have not benefited from comparable safe-haven demand.
This does not necessarily mean Gold has lost its defensive characteristics. Rather, short-term portfolio adjustments may be outweighing the factors that would ordinarily support it.
There are important limits to that interpretation.
The simultaneous decline across several asset classes does not prove that investors are facing margin calls or engaging in forced liquidation. Direct evidence from open interest, trading volumes, ETF flows or positioning reports would be needed to establish whether speculative holdings are being reduced.
Friday’s scheduled CFTC report may provide useful background, although it covers positions only through October 27 and will not capture the latest selling directly.
For now, position-cutting is a plausible explanation for the unusual cross-asset behaviour, rather than a confirmed cause of the metals decline.
ActionForex’s Technical View: Gold, Can 3,942 Support Hold?
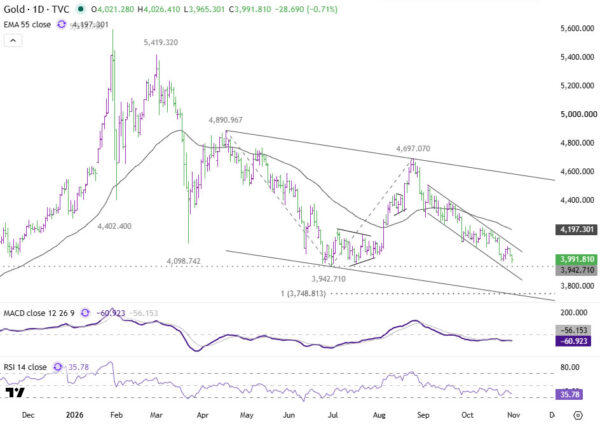
Gold’s decline from 4,697.07 resumed with an intraday break below 3,975.49 on Friday. Although the metal subsequently recovered above that level, the near-term outlook remains bearish as long as 4,083.41 resistance holds.
The more important question is whether the selling has sufficient momentum to push Gold through 3,942.71 support.
A firm break below that low would confirm resumption of the larger downtrend from 5,598.75. That would bring the 100% projection of 4,890.96 to 3,942.71 from 4,697.07 at 3,748.81 into focus.
But the downside scenario is not yet confirmed.
Gold’s 4-hour MACD has previously shown bullish divergence, indicating that downward momentum has not strengthened consistently throughout the decline. That leaves room for another recovery attempt, particularly if selling pressure begins to ease around the previous low.
Such a recovery would not, by itself, reverse the bearish outlook. As long as 4,083.41 holds, the immediate downside risk remains.
The distinction is between breaking 3,975.49 intraday and generating enough follow-through to decisively clear 3,942.71. The latter would carry considerably greater technical significance.
ActionForex’s Technical View: Silver, $50 Is the Next Battleground
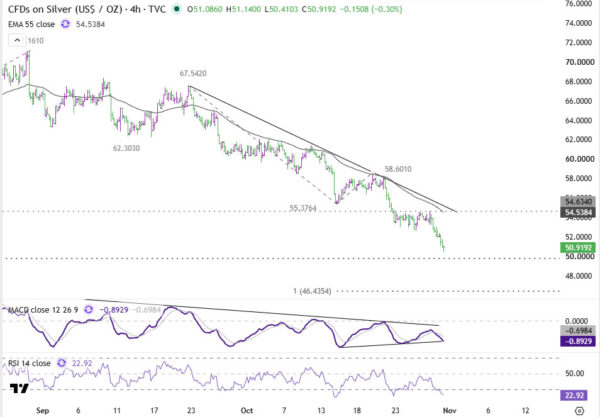
Silver’s decline has been more persistent, bringing the metal toward an important support area around the psychological $50 level.
That level sits close to the 61.8% projection of 89.36 to 54.77 from 71.16 at 49.77, creating a potential support zone between 49.77 and 50.00.
Some recovery could develop from this area. Daily RSI has fallen toward 26.7, while the 4-hour reading is near 22.9, indicating deeply oversold conditions across both timeframes.
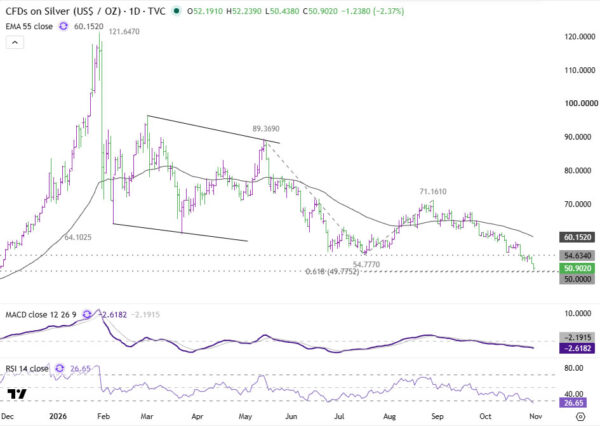
However, oversold readings alone are not sufficient to establish a bottom.
Silver’s near-term outlook remains bearish while 54.63 resistance holds. Even if support around 50.00 produces a rebound, the broader decline would remain intact unless that resistance is overcome.
On the downside, a firm break of the 49.77–50.00 support zone would signal continuation of the downtrend.
The next objective would be the 100% projection of 67.54 to 55.37 from 58.60 at 46.43.
Silver is therefore approaching an area where some stabilization is possible, but failure to defend support would expose it to another substantial downward leg.
ActionForex’s Technical View: Gold/Silver Ratio Signals More Silver Underperformance
The Gold/Silver ratio provides another indication that selling pressure within precious metals is becoming increasingly uneven.
The ratio surged to around 78.48 on Friday, breaking above the 61.8% projection at 76.95 and extending its advance from September’s low near 64.65.
That breakout reinforces the view that Silver is underperforming Gold, rather than both metals simply weakening at the same pace.
Further upside is expected as long as 74.90 support holds, with the next objective at the 100% projection near 84.53.
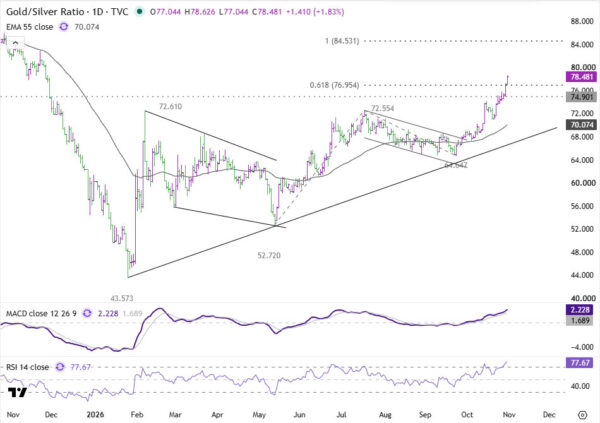
There is some risk of a temporary pullback. Daily RSI has risen to approximately 77.7, indicating overbought conditions that could lead to consolidation.
Nevertheless, the near-term bullish structure of the ratio remains intact while 74.90 holds.
This is not a direct signal that Gold must continue falling. The ratio could rise even if both metals rebound, provided Gold recovers more strongly than Silver.
Instead, the breakout suggests that Silver’s relative weakness may persist, adding another dimension to the broader precious-metals sell-off.
Gold and Silver Approach Their Next Decision Levels
The immediate question is whether the decline in precious metals can continue without support from the conventional Dollar and Treasury-yield channels.
The simultaneous weakness in technology stocks and cryptocurrencies makes position-cutting a plausible explanation. But the available market evidence does not yet establish that investors are being forced to sell, or that the same mechanism is driving all three markets.
That makes the next technical tests particularly important.
For Gold, a firm break of 3,942.71 would confirm renewed downside momentum and open the way toward 3,748.81. For Silver, a sustained move below 49.77–50.00 would increase the risk of a deeper decline toward 46.43.
Meanwhile, the Gold/Silver ratio’s break above 76.95 suggests that Silver could remain the weaker metal even if both eventually stabilize.
The upcoming US trading session and subsequent positioning evidence may help clarify whether the unusual cross-asset selling reflects a temporary adjustment or a more persistent reduction in exposure.
For now, Gold and Silver remain under pressure, but the next support breaks—not the position-cutting hypothesis alone—will determine whether the sell-off develops into a deeper technical decline.
Key Takeaways
- Gold and Silver fell even as the 10-year yield eased to 4.93% and Dollar Index slipped to 101.67—a break from the usual macro relationship that points to position-cutting rather than rate-driven selling.
- Silver and Platinum have lost substantially more than Gold percentage-wise, and the Gold/Silver ratio’s breakout to 78.48 (above 76.95 resistance) suggests Silver’s relative underperformance could persist even if both metals stabilize.
- The selling coincides with Alphabet’s 12.64% earnings-driven plunge and a $6.3B Binance security breach—two unrelated shocks that, taken together, are consistent with broad de-risking across volatile assets.
- Gold’s key level is 3,942.71: an intraday break below 3,975.49 hasn’t yet been confirmed by a decisive close below 3,942.71, which would open 3,748.81.
- Silver’s key level is the 49.77–50.00 zone: deeply oversold RSI readings (26.7 daily, 22.9 four-hour) leave room for a bounce, but a firm break exposes 46.43 next.