
TL;DR: Friday’s 2.86% Nasdaq plunge and an 8.24% semiconductor-ETF drop extended a two-week AI-driven selloff that’s now reaching corporate credit assessments—S&P Global cut Meta’s outlook to negative. With Gold, Silver and Bitcoin all falling alongside tech even as Treasury yields drop, Nasdaq’s 25,036.33, S&P 500’s 7,507.77 and the 10-year yield’s 4.815% are the critical tests for whether this becomes a broader correction.
Why This Matters
The sell-off in AI-related stocks is becoming harder to dismiss as another temporary setback. Three episodes of selling over the past two weeks have progressively weakened market sentiment, culminating in Friday’s 2.86% plunge in Nasdaq Composite and an 8.24% decline in the iShares Semiconductor ETF. More importantly, concerns about the financial returns from massive AI infrastructure spending are beginning to extend beyond equity valuations into corporate credit assessments.
The deterioration is also becoming visible across asset classes. Treasury yields have fallen sharply as markets scale back expectations for Fed tightening, while Gold, Silver and cryptocurrencies have come under renewed selling pressure. Yet the Dollar has held within its bullish consolidation, and S&P 500 has not suffered the same technical breakdown as Nasdaq.
The risk of a deeper, more persistent market correction has increased, but a generalized breakdown is not yet confirmed. The coming week could be particularly important, with US midterm elections and renewed Middle East tensions adding uncertainty to markets already questioning the sustainability of the AI investment boom.
AI Concerns Move Beyond Valuations Into Credit
The central concern has shifted from whether AI-related stocks are expensive to whether companies can generate sufficient returns to justify their enormous investment commitments.
Alphabet’s 12.64% plunge on Thursday highlighted that tension. Despite strong cloud revenue growth, the company reported negative quarterly free cash flow of $9.07B as capital expenditure reached $51.4B. Amazon subsequently added to investor concerns with disappointing earnings and continued heavy capital spending, while Intel’s weaker guidance intensified selling across semiconductor stocks.
The pressure became more pronounced on Friday:
- Nasdaq Composite: −2.86% to 25,437.00, its worst session since June
- S&P 500: −1.82% to 7,580.07
- iShares Semiconductor ETF: −8.24%, now ~29% below its previous high
- Intel: −28.58%, though company-specific operating problems also contributed
The broader message from the sector is that investors are becoming less willing to overlook the financial costs of AI expansion, even when the underlying demand outlook remains constructive.
The more significant development came from the credit market.
S&P Global Ratings revised Meta’s credit outlook from stable to negative, citing uncertainty surrounding elevated capital expenditure and future cash generation. Meta’s planned 2026 capital spending of $135B–$145B and its $2.12B quarterly free cash flow deficit have brought greater attention to how the company intends to finance and monetize its AI investments.
The rating itself was not downgraded, and Meta disputed the assessment. Nevertheless, the outlook revision shows that concerns about AI spending are beginning to influence judgments about corporate financial strength, not merely the prices investors are willing to pay for technology shares.
That distinction matters because a further deterioration in credit conditions could have consequences beyond a correction in richly valued stocks.
There are still important counterweights. US Q3 GDP expanded 3.4% annualized, while Microsoft Azure and Google Cloud continued reporting substantial revenue growth. Defensive sectors also showed resilience on Friday, and S&P 500 was still relatively close to its record despite Nasdaq’s sharper retreat.
The evidence therefore does not establish that the AI investment cycle is collapsing. Rather, the market is increasingly questioning whether the financial returns and funding arrangements behind that expansion can justify the scale of spending already committed.
Treasury Rally Reflects a More Cautious Fed Outlook
The technology sell-off has coincided with a substantial reassessment of US interest-rate expectations.
The Fed held its policy rate at 3.75–4.00% during the week, with two policymakers dissenting in favour of an increase. Chair Kevin Warsh avoided committing to a predetermined tightening path, leaving investors to reassess how much further the central bank could raise rates as financial-market conditions deteriorated.
The repricing has been substantial and consistent in direction:
- December hike probability: 89.5% a month ago → 76.2% a week ago → 70.7% as of Saturday
- 12-month implied tightening (OIS): 74.3bps on October 28 → ~55.5bps now—a reduction of almost a full quarter-point hike
Another increase remains the base case, but conviction has weakened.
Part of the reassessment reflects concern that sustained weakness in technology shares could tighten financial conditions and eventually weigh on economic activity. September’s headline PCE inflation of 3.6% was also slightly below the cited 3.7% expectation, although inflation remains elevated and the latest GDP figures continue to show economic resilience.
Treasury yields have adjusted accordingly. The 2-year yield closed around 4.594%, extending its decline from 4.960%, while the 10-year yield finished near 4.933%, substantially below its October peak of 5.365%.
But the Treasury rally presents an important question that goes beyond Fed pricing.
Lower yields may reflect expectations for a shallower tightening cycle. They may also reflect investors seeking protection against a deterioration in equities, credit conditions and economic growth. Both influences could be operating simultaneously.
An orderly correction in yields would be consistent with markets adjusting to a less aggressive Fed outlook. A much deeper decline, particularly alongside worsening equity and credit conditions, would raise concerns that investors are preparing for more serious financial stress.
Dollar Holds Firm as Selling Spreads Across Risk Assets
The Dollar’s performance illustrates the conflicting forces now influencing markets.
Dollar Index recovered from Friday’s earlier weakness to close at 101.963, gaining 0.11% on the day and approximately 0.39% over the week. The weekly FX heat map showed Canadian Dollar and Sterling among the strongest currencies, while New Zealand Dollar and Euro underperformed.
Lower Treasury yields and reduced Fed tightening expectations are weighing on Dollar’s interest-rate advantage. At the same time, worsening risk appetite can support the currency through defensive demand and liquidity preferences.
Neither influence has decisively prevailed, leaving Dollar broadly range-bound despite significant volatility elsewhere.
The weakness in other assets is more pronounced:
- Gold: −3.6% on Friday, to around 3,875
- Silver: −5.8%, to 49.11
- Bitcoin: ~77,300 in Saturday’s snapshot, well below its recent high near 87,354
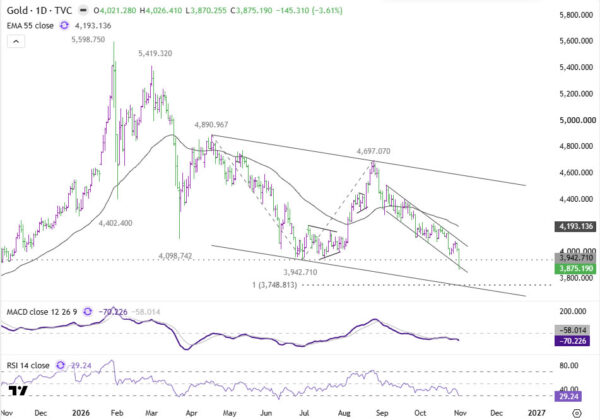
The simultaneous decline in technology equities, precious metals and cryptocurrencies is consistent with investors reducing exposure across volatile assets. However, it does not establish forced liquidation or a common selling mechanism. Positioning, open interest and fund-flow evidence would be needed before reaching that conclusion.
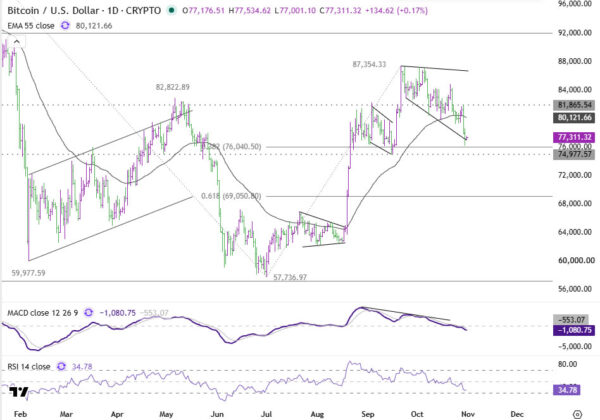
For now, the important development is that selling pressure has spread beyond AI-related equities, even though the broader financial system has not shown evidence of a generalized breakdown.
Midterms and Iran Add Two Different Risks for Next Week
Markets now face additional uncertainty from the November 3 US midterm elections and the possibility of renewed military confrontation involving Iran.
A Democratic takeover of the House has been widely anticipated in the investor surveys cited during the week, suggesting that such an outcome may already be partly reflected in market expectations. Greater surprises could come from the Senate result or uncertainty surrounding the vote count.
The geopolitical outlook carries a different set of risks.
Reports that Washington has discussed preparations for a possible military campaign against Iran after the elections have raised concerns about further escalation. No final decision to launch an operation has been established, but the possibility matters because oil and European natural gas prices have already risen sharply.
A further energy-price shock could intensify inflation pressures precisely as financial markets are becoming more concerned about growth.
This creates two potentially competing risk-off scenarios.
If AI-related financial stress dominates, investors could continue reducing expectations for Fed tightening, pulling Treasury yields lower and weighing on Dollar through a narrower expected interest-rate advantage.
If energy-related inflation risks dominate, Treasury yields could face renewed upward pressure, while Dollar might receive support from both inflation-driven rate expectations and defensive demand.
The outcomes are not predetermined. A severe geopolitical shock could also trigger strong Treasury buying despite higher energy prices.
The distinction matters because the direction of Treasury yields and Dollar will help reveal which risks investors are prioritizing.
Nasdaq Leads the Correction, S&P 500 Faces Confirmation Test
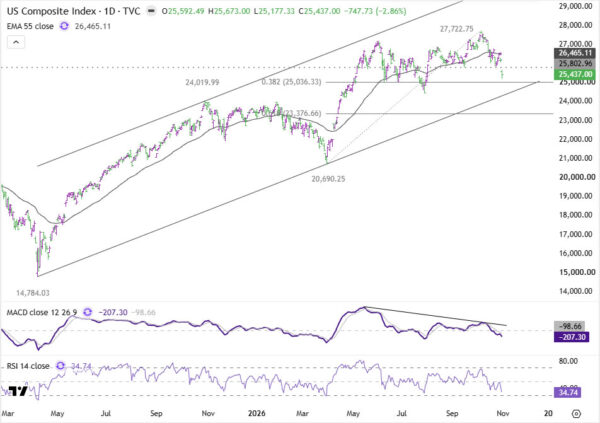
Nasdaq’s technical deterioration is now more significant than at the beginning of the week.
The firm break below 25,802.96 support, following an earlier rejection by the 55-day EMA, indicates that the decline from 27,722.75 is at least correcting the advance from 20,690.25.
Immediate focus turns to the 38.2% retracement at 25,036.33. A firm break would bring 24,019.99 resistance turned support into view, where the larger question would be whether Nasdaq is developing a more substantial correction within the uptrend from 14,784.03.
For now, downside risk persists as long as the 55-day EMA, currently around 26,465.11, holds during any recovery.
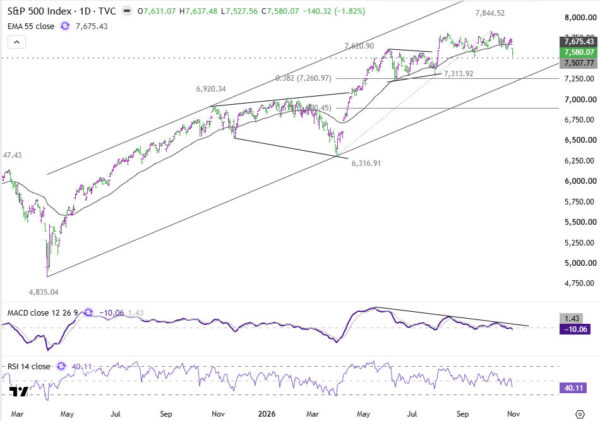
S&P 500 has not yet confirmed the same technical breakdown.
The immediate focus is 7,507.77 support, whose corresponding structural level in Nasdaq has already been broken. A firm break would align the outlooks of the two indices and indicate that the decline from 7,844.52 is at least correcting the advance from 6,316.91.
That would bring the 38.2% retracement at 7,260.97 into focus. On the upside, the near-term bearish bias persists while the 55-day EMA around 7,675.43 holds.
The distinction between these indices is important. Nasdaq has already confirmed a correction of its recent advance, while S&P 500 is approaching the level that could establish a broader equity-market deterioration.
Treasury Yields Approach Levels That Could Signal Greater Stress
The Treasury charts offer another way to assess whether the correction is becoming more serious.
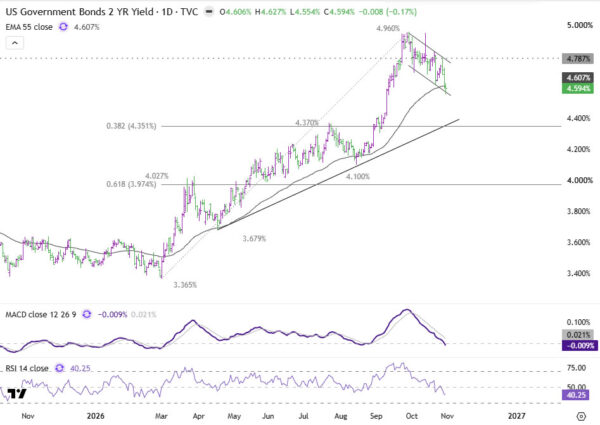
The 2-year yield extended its decline from 4.960% to close around 4.594%. For now, this can still be interpreted as a correction of the rise from 4.100%, with a break above 4.787% resistance indicating that the pullback has completed.
However, a sustained move below the 55-day EMA near 4.607%, together with a break of the falling channel floor, would raise the possibility that the yield is correcting the entire advance from 3.365%.
That would bring the 4.351–4.370% support area into focus, including the 38.2% retracement at 4.351%.
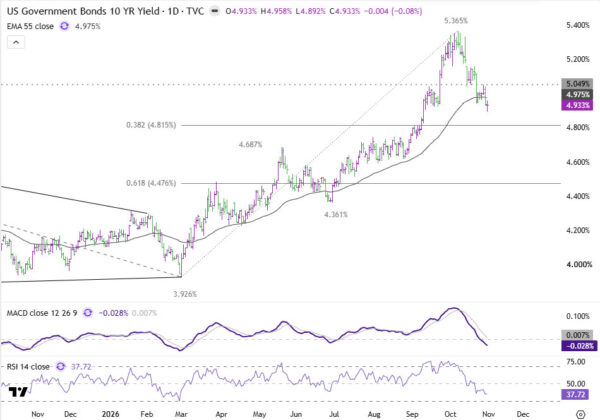
The 10-year yield has already broken below its 55-day EMA, suggesting that the fall from 5.365% may be correcting the broader rise from 3.926%.
Further weakness is expected while 5.049% resistance holds. The next important support is the 38.2% retracement at 4.815%, where some buying interest in yield terms could stabilize the decline and produce a rebound.
A decisive break below 4.815%, however, would open the way toward the 61.8% retracement at 4.476%.
Such a move, particularly if accompanied by further equity losses and worsening credit conditions, would raise the possibility that Treasury demand reflects more substantial financial stress rather than merely a moderate adjustment in Fed expectations.
Dollar Index Retains Its Bullish Structure
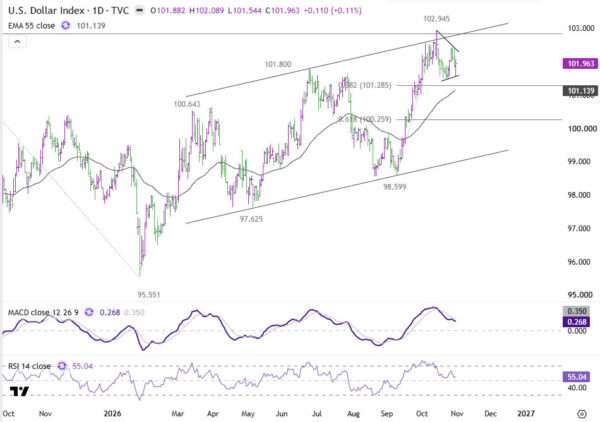
Despite volatility during the week, Dollar Index has stayed comfortably within its established near-term consolidation range.
The 38.2% retracement of 98.59 to 102.94 at 101.28, together with the rising 55-day EMA around 101.13, remains intact. There is therefore no confirmed change to the broader bullish trend.
A break above 102.49 resistance would provide the first indication that consolidation from 102.94 has completed, bringing a retest of that high into focus. A firm break above 102.94 would resume the larger uptrend from 95.55.
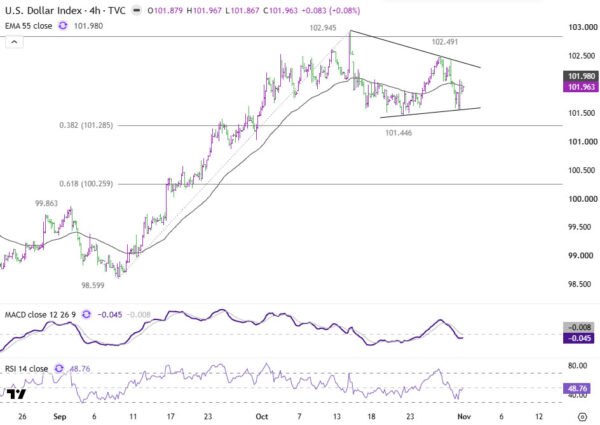
Another downward leg within the consolidation remains possible. However, the bullish interpretation should hold while the 101.13–101.28 support zone is defended.
A sustained and decisive break below that zone would instead raise the possibility of a near-term bearish reversal toward the 61.8% retracement at 100.25.
Dollar’s ability to preserve its bullish structure despite lower Treasury yields reinforces the importance of distinguishing between interest-rate repricing and defensive currency demand.
Next Week Could Determine Whether the Correction Broadens
The AI-related sell-off has developed beyond a straightforward reassessment of technology valuations. Questions about investment returns are reaching corporate credit assessments, while selling pressure has extended into semiconductors, precious metals and cryptocurrencies.
Yet important areas of resilience remain. The broader S&P 500 has not matched Nasdaq’s technical deterioration, the Fed’s tightening outlook has moderated rather than reversed, and Dollar continues to consolidate within its bullish trend.
The critical tests are now Nasdaq’s 25,036.33, S&P 500’s 7,507.77 and the US 10-year yield’s 4.815%.
A break below these levels, particularly alongside additional credit deterioration, would strengthen the case for a deeper and more persistent market correction. Successful defenses would leave room for the recent selling to stabilize without threatening the broader market structure.
The midterms and possible Iran escalation add new sources of uncertainty, potentially pulling yields and Dollar in different directions.
For now, the warning signs are becoming more substantial. The question is no longer simply whether the AI trade can recover, but whether the financial pressure developing around it can remain contained before it spreads more decisively into the broader market.
Key Takeaways
- Friday’s selloff hit a new intensity: Nasdaq fell 2.86% (worst since June), the semiconductor ETF dropped 8.24% (29% below its high), and Intel plunged 28.58%.
- S&P Global cut Meta’s credit outlook to negative over its $135B–$145B 2026 capex plan and $2.12B quarterly free cash flow deficit—the clearest sign AI spending concerns have reached credit markets, not just equity valuations.
- Fed tightening conviction is fading fast: December hike odds fell from 89.5% a month ago to 70.7% now, with 12-month implied tightening dropping from 74.3bps to ~55.5bps.
- Selling has spread well beyond tech: Gold fell 3.6%, Silver 5.8%, and Bitcoin sits near 77,300, down sharply from its ~87,354 high—even as Dollar holds its bullish consolidation.
- The decisive levels for next week are Nasdaq’s 25,036.33, S&P 500’s 7,507.77, and the 10-year yield’s 4.815%, with US midterm elections and Iran escalation risk adding two more variables that could pull yields and Dollar in opposite directions.