
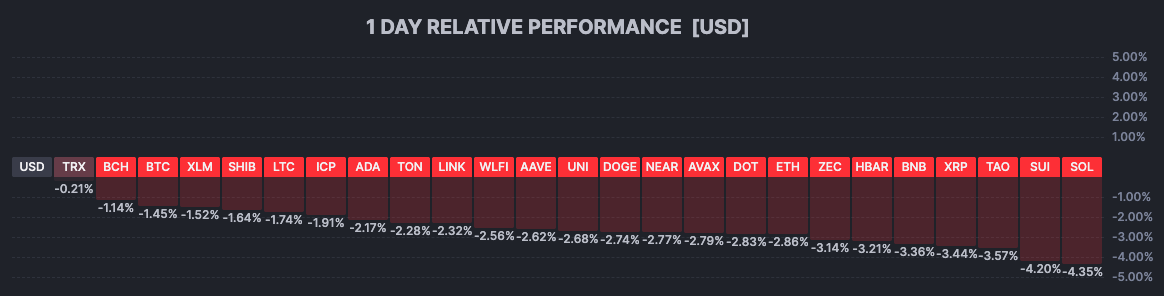
- With Bitcoin remaining below $70,000, altcoins struggle to find momentum
- Drifting lower, the Cryptocurrency market is still awaiting for a meaningful bounce
- Observing technical analysis for Bitcoin, Ethereum and Solana
Cryptos have bounced back quite swiftly since their rout last week.
Nevertheless, the price action and sentiment around the digital assets class remain weak, looking for a spot to consolidate in peace.
Indeed, when such dramatic outflows occur, even in traditional asset classes such as equities, bonds, or metals, participants take their time before regaining confidence and actually show meaningful buying interest.
A crisis of belief often translates into slow, gradual drifts lower, the time required for participants to get flat, retire algorithms, and, overall, for market sentiment to return to a more neutral level.
Does it mean we won’t see any more flash crashes or value halvings? It is tough to say in such unpredictable times.
What is certain is that the most leveraged classes of investors are backing off, allowing funding spreads to narrow and open interest to return to non-speculative levels, where movement can be more stable.
An argument could be that, despite being back to Liberation day Open interest levels, longs and shorts can still correct further – Currently at around $20B, the action looks poised for further deleveraging ahead. Open interests at $10B would be considered low.
While big players reduce their positions amid high volatility and lower performance, it can be interesting to spot projects that can be accumulated slowly as valuations correct from their relative extremes.
For a guide on gradually accumulating cryptocurrencies, I invite you to check out our DCA investing guide.
It is never wise to call for a bottom while the Market still doesn’t know where to head, but in such times, planning and taking calculated risks help investors and traders to reduce the uncertainty to find opportunities.
By the way, before Markets form absolute bottoms, it is common to see a very harsh catalyst that isn’t followed with much selling, indicating that participants are turning the page on a bear trend.
We haven’t had this catalyst yet; keep a close eye on fresh developments, news, and how they interact with Crypto sentiment to stay ahead of headlines and fear.
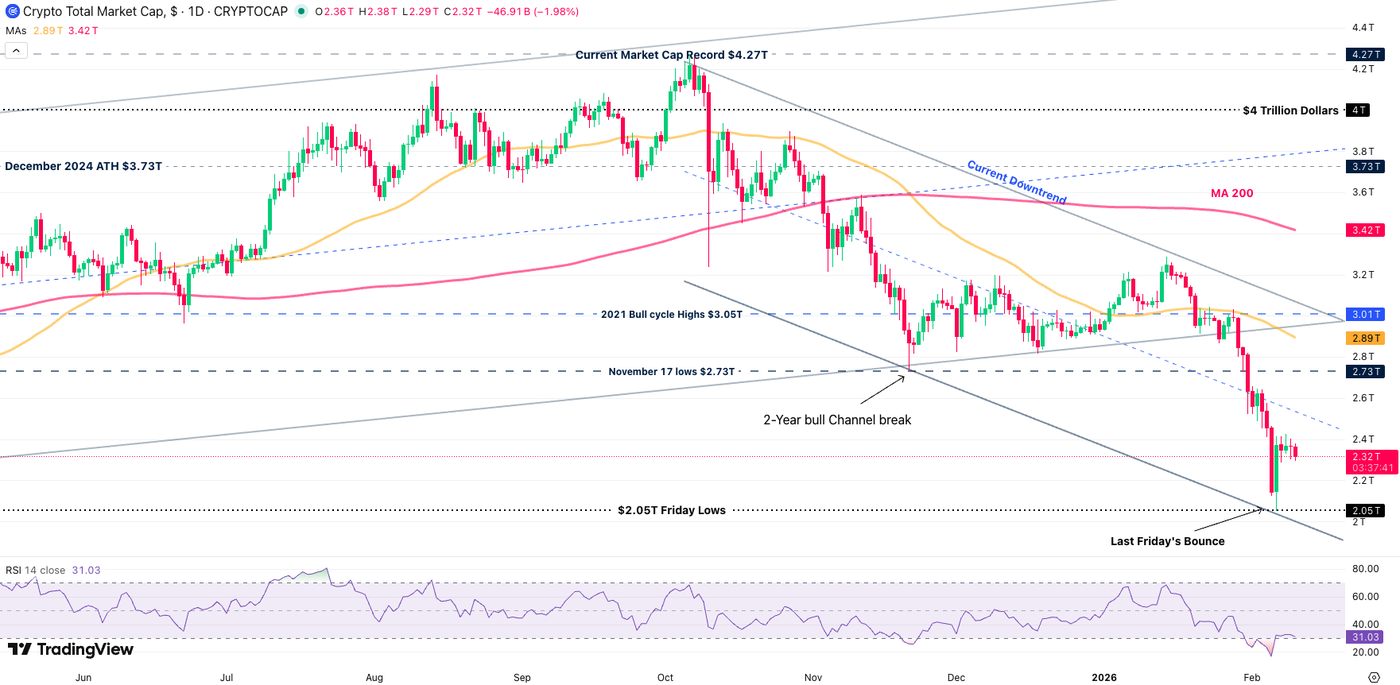
The total Market Cap is still stuck in a downward channel – Bouncing from its lows last Friday still the action looks very timid.
Let’s dive right into the Daily Charts and technical levels for Ethereum (ETH), Ripple (XRP) and Solana (SOL).
Read More:
- Silver (XAG/USD) tests $80 ahead of NFP – What’s next?
- The Oil Tug-of-War: Geopolitics vs. Global glut continues. Will bulls or bears prevail?
- NFP Preview: Benchmark revisions, fate of the March rate cut & implications for the DXY and Dow Jones
- Tech hasn’t said its last word – Dow Jones and US Index Outlook
The Current Session in Cryptos
Ethereum (ETH) Daily Chart and Technical Levels
Ethereum is attempting to find an equilibrium price after bouncing at its $1,750 Major 2025 support.
Now below its $2,100 to $2,300 support, the key level now acts as an important momentum pivot level. Without many signs of life, the action can consolidate between $1,385 to $2,100 for the period to come.
However, any session close above the Pivot zone could trigger a renewed interest in the Crypto.
And as always, when you see interest in ETH, expect interest to follow across the entire crypto space (particularly in the project altcoins – memecoins have their own, more erratic, signals of rallying).
Levels of interest for ETH trading:
Support Levels:
- $1,650 to $1,750 Pre-Bounce 2025 Key Support
- 2025 Bottom Support $1,380 to $1,500
- 2025 Lows $1,384
Resistance Levels:
- $2,100 to $2,300 June War support now Key Pivot
- $2,500 to $2,700 June 2025 Key Support now minor Resistance
- $3,000 to $3,200 December resistance
- $3,500 (+/- $50) Key Resistance
- $4,950 Current new All-time highs
Ripple (XRP) 4H Chart and Technical Levels
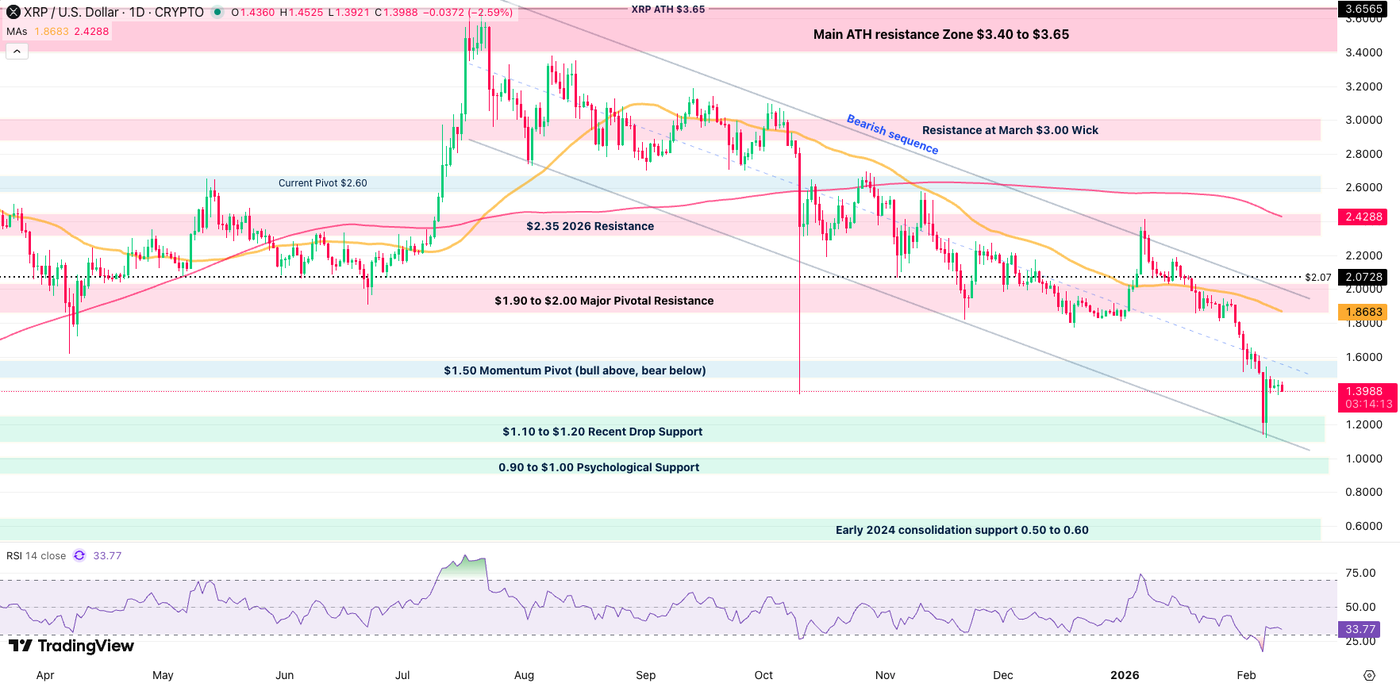
Ripple got sold off harshly in the past week, reaching $1.10 lows as liquidations accelerated in the Top 4 Market Cap.
Since, XRP recovered well but is poised for a similar destiny as its older brother Ether.
Bulls will need to push above $1.50 to assume that better days are indeed ahead.
Failing to breach the level should see a progressive drift lower towards last Friday’s levels – A break of the lows scenario is not out of the picture!
Levels of interest for XRP trading:
Support Levels:
- $1.10 to $1.20 Recent Drop Support
- $0.90 to $1.00 Psychological Support
- Early 2024 consolidation support $0.50 to $0.60
Resistance Levels:
- $1.50 Momentum Pivot (bull above, bear below)
- $1.90 to $2.00 Major Pivotal Resistance
- $2.35 2026 Resistance
- Resistance at March 2025 $3.00 Wick
- Main ATH resistance Zone $3.40 to $3.65
Solana (SOL) Daily Chart and Technical Levels
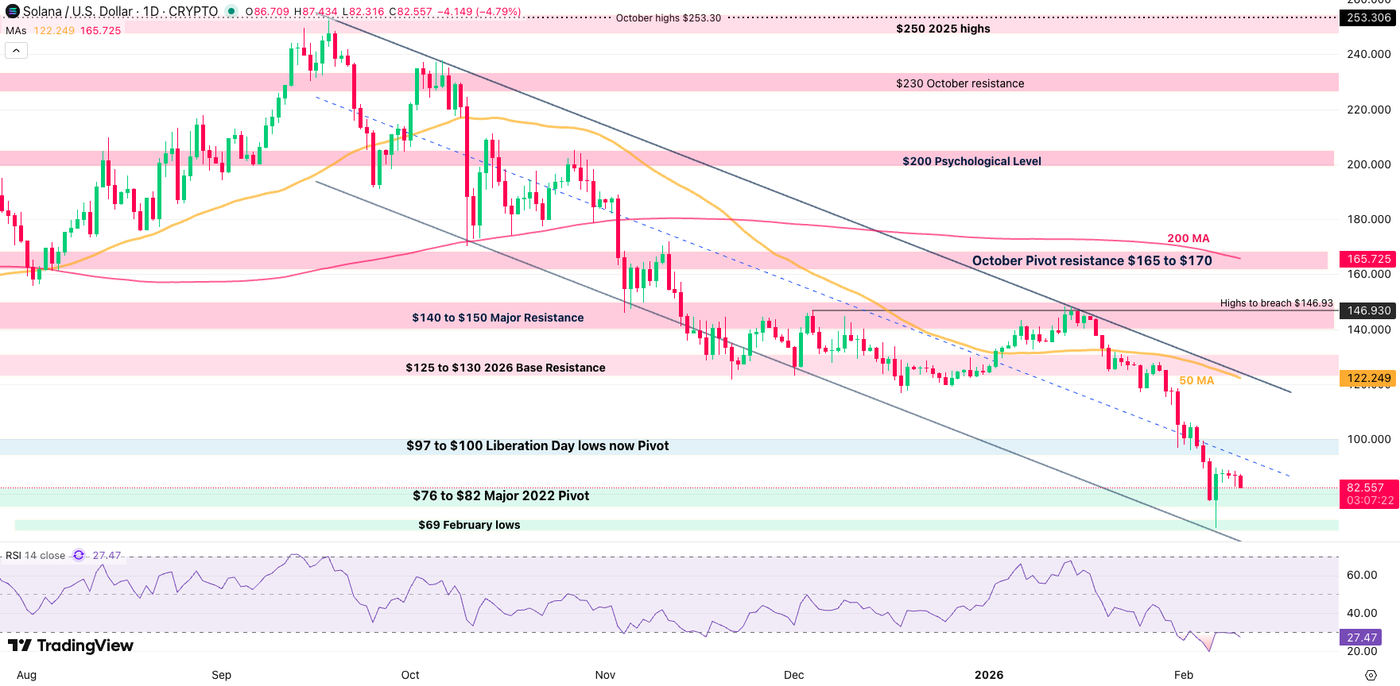
Solana was subject to intense competition and accumulation in late 2024 and early 2025 but has since largely overshot to the downside.
Back to its 2022 consolidation support ($76 to $82), it remains one of the most undersold cryptocurrencies when looking at previous cycles and its competitors.
It could of course continue to drift lower but it will be interesting to see if there is still much downside left for the Crypto.
Any further break could see interest at around $50.
Levels to keep on your SOL Charts:
Support Levels:
- $76 to $82 Major 2022 Pivot
- $69 February lows
- $50 Psychological level
Resistance Levels:
- Major Momentum Pivot $115 to $120
- $125 to $130 2026 Base Resistance
- $140 to $150 Major Resistance
- $253 Cycle highs
Safe Trades and Happy 10th of February (it’s my birthday)!
Follow Elior on Twitter/X for Additional Market News, interactions and Insights @EliorManier
Opinions are the authors’; not necessarily that of OANDA Business Information & Services, Inc. or any of its affiliates, subsidiaries, officers or directors. The provided publication is for informational and educational purposes only.
If you would like to reproduce or redistribute any of the content found on MarketPulse, an award winning forex, commodities and global indices analysis and news site service produced by OANDA Business Information & Services, Inc., please refer to the MarketPulse Terms of Use.
Visit https://www.marketpulse.com/ to find out more about the beat of the global markets.
© 2026 OANDA Business Information & Services Inc.