
- The Dow Jones Industrial Average achieved a third consecutive record high, while the S&P 500 and Nasdaq closed in the red
- Market anxiety increased due to flat US retail sales data and massive projected capital expenditures for AI infrastructure
- The S&P 500 shows signs of a potential breakout above 7000
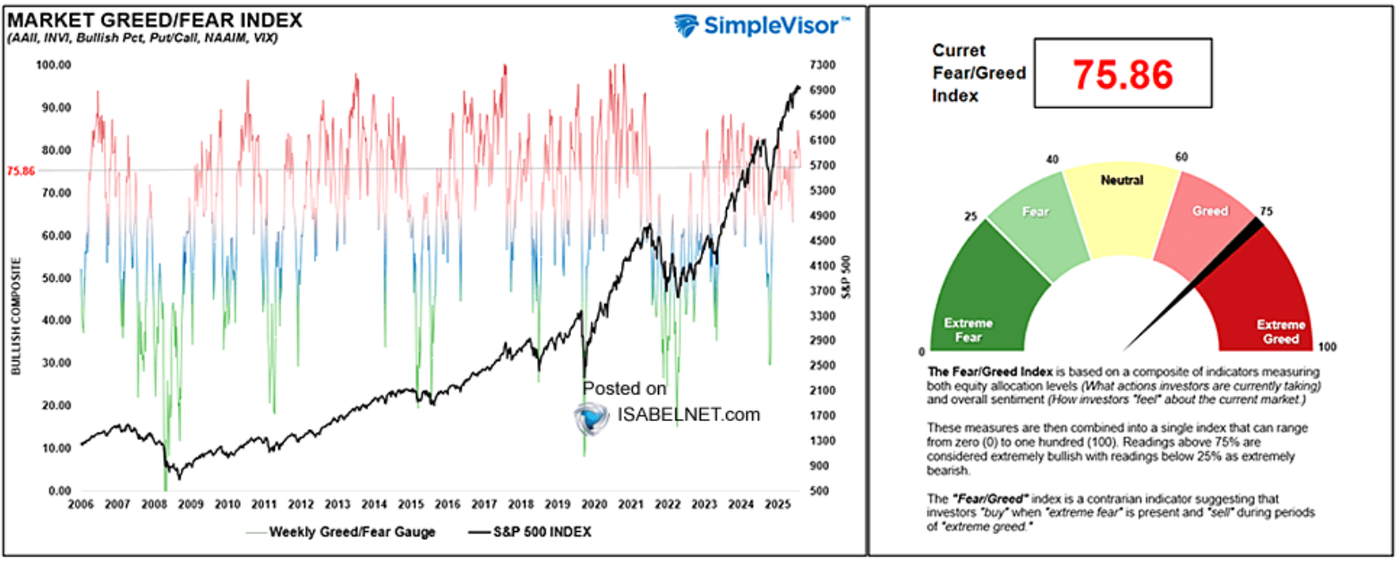
- Caution is advised in the near term, with the Fear and Greed Index in “extreme greed” territory and significant volatility expected from upcoming US jobs and CPI data
Most Read: The Oil Tug-of-War: Geopolitics vs. Global glut continues. Will bulls or bears prevail?
Market performance was mixed on Tuesday as the Dow Jones Industrial Average secured its third consecutive record high, while the S&P 500 and Nasdaq ended the session in the red.
Market participants were primarily focused on flat retail sales data and the anticipation of an upcoming labor market report.
The communication services sector suffered the most significant decline, largely due to a 1.8% drop in Alphabet shares following the company’s $20 billion bond sale. This move intensified broader market anxieties regarding the massive capital expenditures required for AI infrastructure, with industry giants like Amazon, Alphabet, Meta, and Microsoft projected to spend hundreds of billions of dollars collectively throughout 2026.
S&P 500 Heatmap
Economic indicators added to the cautious sentiment, as US retail sales remained stagnant in December, missing the 0.4% growth forecasted by economists. This lack of growth, driven by reduced spending on big-ticket items like vehicles, suggests a cooling economy as the new year begins. Despite the sluggish data, expectations for a dovish shift from the Federal Reserve increased, with the probability of an April rate cut rising to 36.9% from Monday’s 32.2%.
Nevertheless, the consensus remains that rates will hold steady until June, coinciding with the potential leadership transition to Fed chair nominee Kevin Warsh, pending Senate approval.
The Dow Jones Industrial Average rose to 50609, an intraday record high earlier in the day before a pullback to close the session around the 50348 handle..
Is the S&P 500 poised for a breakout beyond 7000?
The S&P 500 has all but recovered from the selloff which began on February 3 and culminated in a low print of 6735 on February 5.
There are signs from both a technical and fundamental perspective which hint at a potential upside breakout.
First we have the technical picture where we have a golden cross pattern which hints at further upside.
The period-14 RSI remains above the 50 handle, hinting at the bullish momentum still in play.
Price does need to hold above the swing low at 6905 to keep the bullish structure intact. A four-hour candle close below this level could open up a deeper correction.
SP 500 Four-Hour Chart, February 10, 2026

Looking at other factors that hint at more upside and Goldman Sachs’ US Equity Sentiment Indicator is stuck at 0.0, a neutral reading that in the past has tended to precede gains in the S&P 500 over the following month.
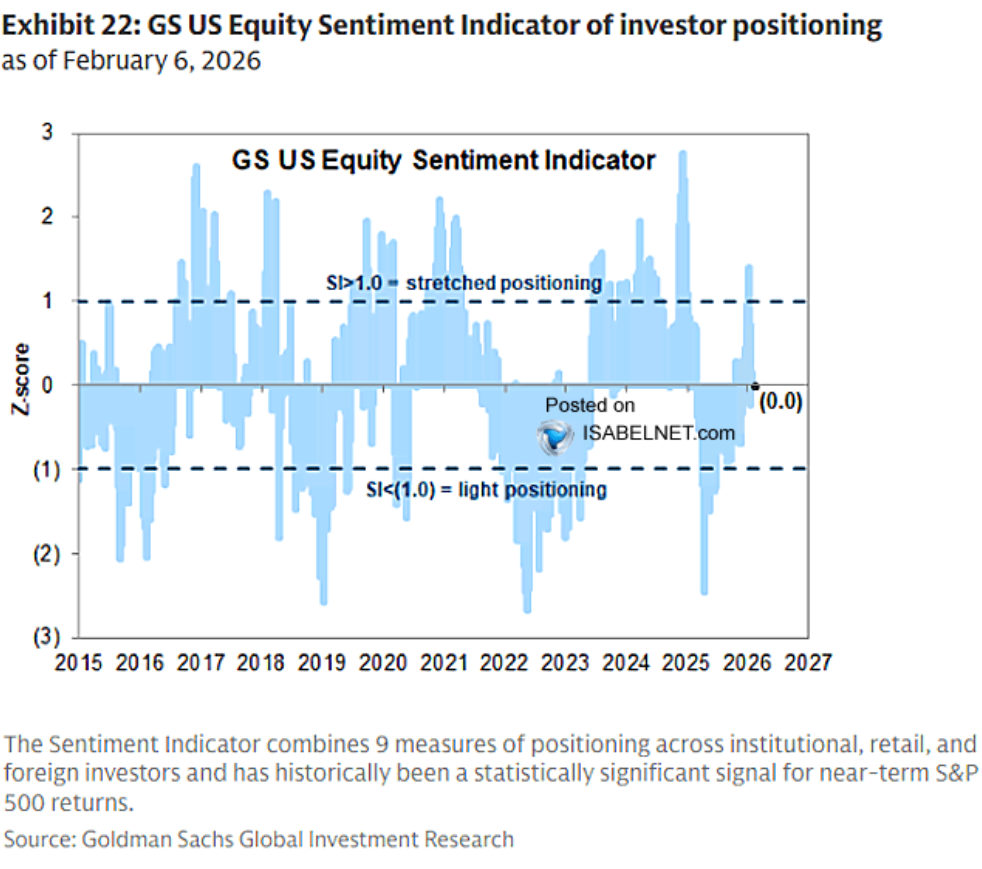
If history is to repeat itself, the S&P 500 could be setting up for another rally with hopes of consolidation above the 7000 handle.
In the near-term though there could be a temporary pause. The fear and greed index is currently in extreme greed territory, around the 75.86 mark. The bulls appear to be holding their ground as it looks like the rally still has its fans.
Up next we have US data which could have significant implications for US equity markets. The jobs data and CPI print could both influence rate cut expectations and thus drive significant volatility.
For more on the Jobs report due tomorrow, please read NFP Preview: Benchmark revisions, fate of the March rate cut & implications for the DXY and Dow Jones
Follow Zain on Twitter/X for Additional Market News and Insights @zvawda
Opinions are the authors’; not necessarily that of OANDA Business Information & Services, Inc. or any of its affiliates, subsidiaries, officers or directors. The provided publication is for informational and educational purposes only.
If you would like to reproduce or redistribute any of the content found on MarketPulse, an award winning forex, commodities and global indices analysis and news site service produced by OANDA Business Information & Services, Inc., please refer to the MarketPulse Terms of Use.
Visit https://www.marketpulse.com/ to find out more about the beat of the global markets.
© 2026 OANDA Business Information & Services Inc.