
- META plunges 7% on layoffs and landmark court verdict.
- Alphabet down 2% as overall sentiment weighs on risk assets as well.
- Both stocks broke key support levels, shifting their outlook to distinctly bearish, as geopolitical fears (US-Iran war) also weigh on broader market sentiment.
- Until Alphabet can stabilize and form a higher low, the path of least resistance remains to the downside.
Most Read: AUD/USD: The technical squeeze between 0.6980 and 0.7070
The technology sector faced a turbulent trading session as two of its largest titans, Meta Platforms and Alphabet (Google), saw their share prices under pressure.
A combination of legal setbacks, internal restructuring, and shifting investor sentiment toward “AI fatigue” weighed heavily on their performance.
The Nasdaq 100 index was down around 1.1% at the time of writing with Meta platforms trading down around 7% on the day.
Overall sentiment has taken a hit today on fears that the US-Iran war will not come to an end as the two sides appear some ways off from a deal.
This has weighed on market sentiment as Oil prices are also up around 5%.
However, both Meta and Google are also facing their own challenges. Let us take a look at these challenges individually and see what the technical picture for both companies tells us.
Meta Platforms (META): Legal blows and workforce reshuffling
META is under pressure which is largely being fueled by a landmark legal verdict and news of further internal job cuts.
The Social Media Addiction Verdict: A jury found Meta (and YouTube) liable in a high-profile case involving social media addiction. The jury ruled that Meta’s platform designs—specifically Instagram—contributed to harmful, addictive behavior in minors and that the company failed to warn users of these risks. Meta was assigned 70% of the responsibility, resulting in $6 million in damages ($3 million compensatory and $3 million punitive). While the dollar amount is nominal for a company of Meta’s size, investors fear the legal precedent could open the floodgates for thousands of similar pending lawsuits.
Ongoing Layoffs: Meta confirmed it is laying off several hundred more employees across divisions including Facebook, Instagram, Reality Labs, and its sales units. While CEO Mark Zuckerberg’s “Year of Efficiency” was initially cheered by Wall Street in 2023-2024, the continued cuts in 2026 suggest a more painful transition as the company redirects capital away from traditional social media operations toward intensive AI development.
META Platforms Daily Chart, March 26, 2026
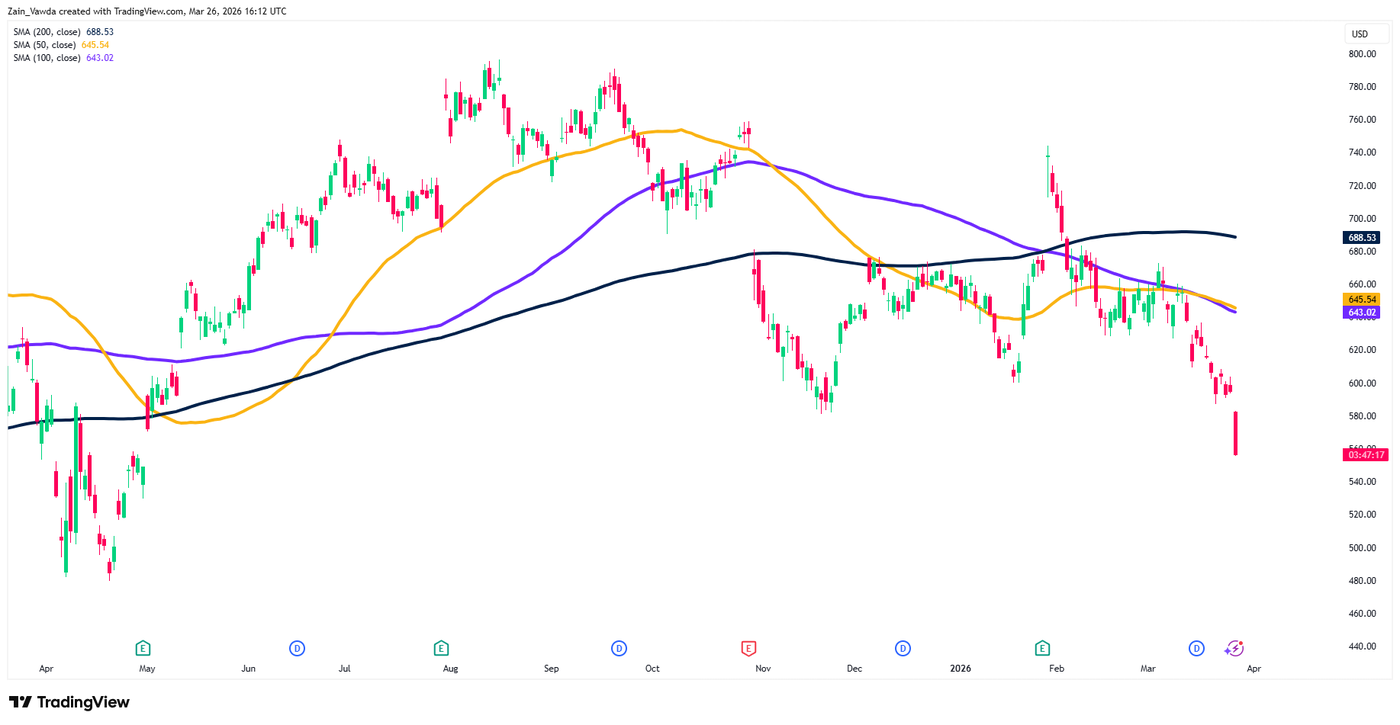
The technical outlook for META has shifted from a period of consolidation into a distinctly bearish phase as the stock has broken the November 2025 swing low.
This leaves META trading at levels last seen in April/May 2025.
The stock price is now trading below all the key moving averages like the 50, 100 and 200 SMAs.
SMA 200 (Dark Blue – $688.53): The stock is now trading well below its long-term trendline. This often signals a transition from a bull market to a structural downtrend.
SMA 50 (Orange – $645.54) & SMA 100 (Purple – $643.02): The price failed to find support at these intermediate levels. Crucially, the 50-day SMA is beginning to curl downward, suggesting that short-term momentum is now firmly in favor of the bears.
The stock is currently testing a psychological support zone around the $560–$580 mark. If it fails to hold here, the next major historical support sits near the $520–$540 level (the lows seen in May 2025).
Any relief rally will face heavy “confluence” resistance at $645, where the 50 and 100-day SMAs converge. This area, which acted as support in February, will now likely act as a “ceiling” for the price.
Alphabet (GOOGL/GOOG): Bear market whispers and spending anxiety
Alphabet’s stock performance was similarly sluggish, with shares hovering near $289.59. Despite beating earnings estimates earlier in the quarter, the stock has struggled to maintain momentum, sliding toward what technical analysts are calling “bear market territory.”
AI Capex Concerns: The primary weight on Alphabet is the staggering cost of its AI infrastructure. Investors are growing wary of the “Capex Trap”—the massive capital expenditure required to stay competitive in generative AI without a clear, immediate timeline for a massive return on investment.
Institutional Selling: SEC filings revealed that several institutional players, including Threadgill Financial LLC, have begun trimming their positions. Threadgill cut its Alphabet holdings by nearly 35%, a move that mirrors a broader trend of “profit-taking” as funds rotate out of Big Tech and into energy or value stocks.
Secondary Legal Pressure: Like Meta, Alphabet’s YouTube was also named in the addiction verdict (assigned 30% liability). This adds to Alphabet’s existing mountain of antitrust challenges globally, creating a “regulatory overhang” that limits the stock’s multiple.
Alphabet (Google) Daily Chart, March 26, 2026
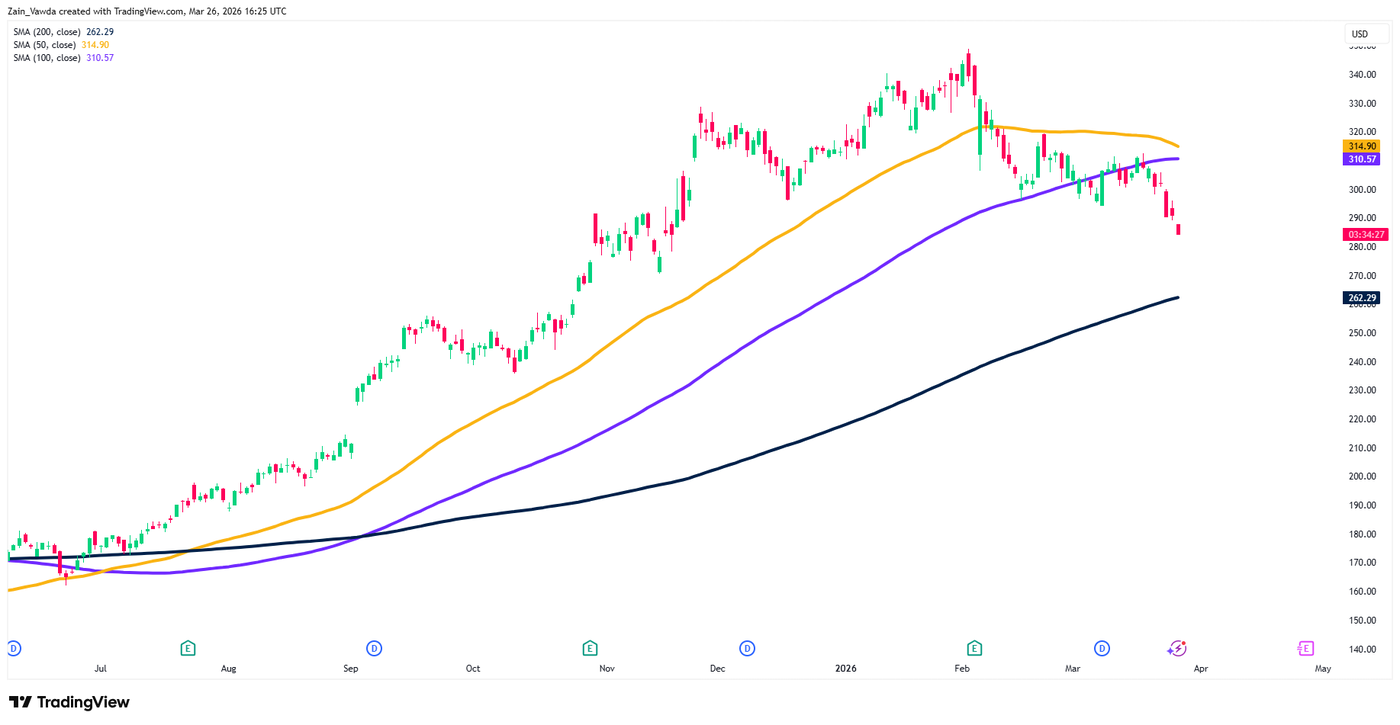
The technical picture for Google is quite similar with the stock now trading at November 2025 levels.
The stock remains in a long-term uptrend relative to its 200-day average, the short-to-medium-term outlook has deteriorated sharply following a failure at key resistance levels.
The price has decisively fallen below both the 50 and 100-day MAs. In early March, the 100-day SMA acted as support, but today’s aggressive sell-off has turned these moving averages into major overhead resistance.
The 200-day MA is the ultimate “line in the sand.” While the stock is still above this long-term trendline, the trajectory is sloping toward it. A drop to this level would represent a 10% correction from current prices.
The stock is approaching the $280–$285 zone. This was a previous consolidation area in late 2025. If this fails to hold, the next stop is the 200-day SMA near $262.
Any recovery attempts will likely be capped at the $310–$315 level. The stock would need to reclaim this zone on high volume to negate the current bearish thesis.
The road ahead
Moving forward the immediate future of global stocks in the short-term will hinge on the Middle East. if oil prices remain elevated markets could remain cautious and risk-off sentiment may prevail. This would not bode well for stocks as a whole.
Earlier today, we heard from JPMorgan who said investors are shifting back to cash, similar to 2022. This is a sign of the uncertainty prevalent at the minute and the situation continues to fluctuate on a daily basis as news filters through.
Short-term trading may be the best option at the minute with the broader picture unclear.
Follow Zain on Twitter/X for Additional Market News and Insights @zvawda
Opinions are the authors’; not necessarily that of OANDA Business Information & Services, Inc. or any of its affiliates, subsidiaries, officers or directors. The provided publication is for informational and educational purposes only.
If you would like to reproduce or redistribute any of the content found on MarketPulse, an award winning forex, commodities and global indices analysis and news site service produced by OANDA Business Information & Services, Inc., please refer to the MarketPulse Terms of Use.
Visit https://www.marketpulse.com/ to find out more about the beat of the global markets.
© 2026 OANDA Business Information & Services Inc.