Global markets are frozen as traders grapple with conflicting interpretations of U.S. President Donald Trump’s latest post on the Iran war, leaving oil prices rangebound near 110 and broader price action lacking conviction. The message introduces competing scenarios with sharply different implications for supply, creating pricing paralysis across assets. While European recovered along with US futures, there was not clear momentum for a genuine reversal. Dollar’s retreat today looked more like a consolidation than a turnaround.
In the post, Trump declared that Iran has been “essentially decimated” and that “the hard part is done,” while telling allies to “go to the Strait, and just TAKE IT” and warning that “the U.S.A. won’t be there to help you anymore.” The language suggests a redefinition of success, where achieving military objectives no longer requires reopening the Strait of Hormuz.
One interpretation is that this signals a shift toward containment. Under this view, the U.S. is preparing to step back even if no deal is reached by April 6, leaving affected countries to manage the reopening of shipping lanes. This aligns with earlier reporting of an exit strategy and would likely place a ceiling on oil prices, with Brent potentially easing toward 100 as risks stabilize rather than escalate.
However, an opposing scenario remains equally plausible. Trump’s comments can also be read as insulating the U.S. from the consequences of further escalation. By telling allies to “go get your own oil,” Washington creates political cover if massive infrastructure strikes on Iran proceed and the Strait remains closed. In this case, supply disruptions would intensify sharply, pushing oil prices significantly higher.
A third risk lies in inaction. If the April 6 deadline passes without either a deal or escalation, the “Maximum Pressure” strategy risks losing credibility, weakening U.S. leverage in upcoming negotiations, including the U.S.-China summit in particular. At the same time, Iran’s move toward selective access to the Strait raises the prospect of a structural bottleneck in global energy flows.
These competing scenarios—containment, escalation, or policy erosion—are leaving markets unable to form a dominant narrative. Oil’s tight range around 110 reflects a balance between downside caps and upside risks, while equities and gold show similarly subdued, directionless moves.
In currency markets, Dollar is easing mildly but the move lacks follow-through, consistent with consolidation rather than reversal. Elevated energy prices and inflation risks continue to provide an underlying bid, even as near-term momentum softens.
Euro is holding steady following March CPI data, where headline inflation rose to 2.5% while core inflation edged lower. The divergence complicates the ECB’s outlook, with an April rate hike still likely but not certain. Much will depend on how persistent energy costs prove and how quickly they feed into core inflation.
Yen failed to extend gains despite recent intervention rhetoric, as USD/JPY is no longer pressing the 160 threshold. Without that trigger, demand for Yen has faded. For the week so far, Yen remains the strongest performer, followed by Aussie and Dollar, while Kiwi lags, reflecting a market driven more by positioning than conviction.
In Europe, at the time of writing, FTSE is up 1.01%. DAX is up 1.03%. CAC is up 0.82%. UK 10-year yield is down -0.049 at 4.829. Germany 10-year yield is down -0.024 at 3.011. Earlier in Asia, Nikkei fell -1.58%. Hong Kong HSI rose 0.15%. China Shanghai SSE fell -0.80%. Singapore Strait Times fell -0.24%. Japan 10-year JGB yield closed flat at 2.359.
Silver Price Gains “Oxygen” from Yield Pullback; Break Above 74.52 to Confirm Momentum
Canada GDP Edges Higher as Resource Sector Offsets Manufacturing Weakness
Eurozone CPI Jumps to 2.5% as Energy Drives Rebound, Core Inflation Eases Slightly
RBA Minutes Highlight Excess Demand and Oil Shock as Case for Further Tightening
China PMIs Return to Expansion as Output and Orders Rebound, but Cost Pressures Surge
NZ ANZ Business Confidence Tumbles to 32.5 as Cost Pressures Surge to Highest Since 2023
Japan Tokyo CPI Core Weakens to 1.7% as Energy Subsidies Drag Inflation Lower
Japan Factory Output Contracts as Auto Weakness Weighs, Outlook Remains Uncertain
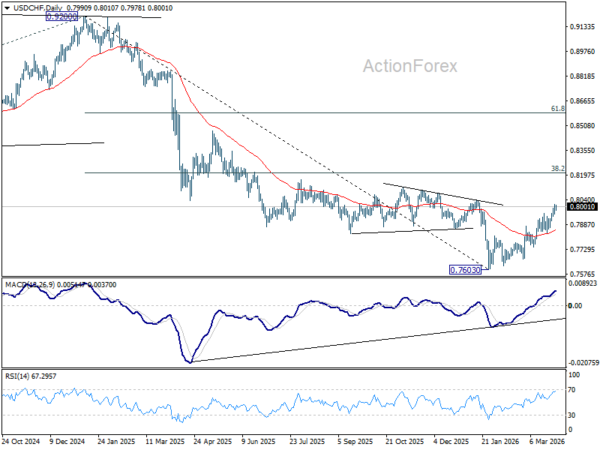
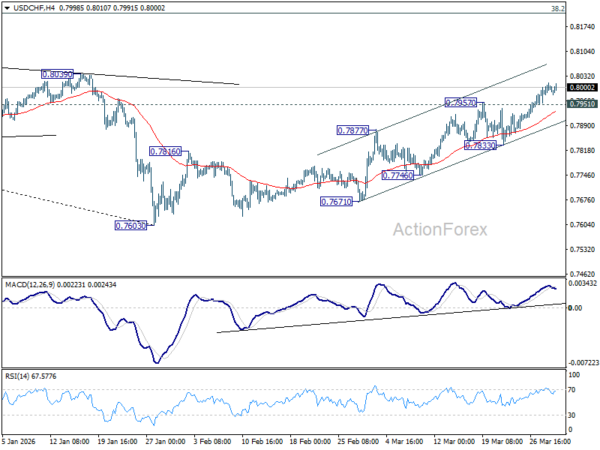
USD/CHF Mid-Day Outlook
Daily Pivots: (S1) 0.7969; (P) 0.7991; (R1) 0.8019; More….
With 0.7951 minor support intact, intraday bias in USD/CHF stays mildly on the upside despite some loss of momentum. Current rally from 0.7603 should target 38.2% retracement of 0.9200 to 0.7603 at 0.8213. On the downside, below 0.7951 minor support will turn intraday bias neutral first. But further rally is expected as long as 0.7833 support holds, in case of retreat.
In the bigger picture, a medium term bottom should be in place at 0.7603 on bullish convergence condition in D MACD. Rebound from there is seen as correcting the fall from 0.9200 only. However, decisive break of 55 W EMA (now at 0.8088) will suggest that it’s probably correcting the larger scale down trend from 1.0146 (2022 high). On the other hand, rejection by the 55 W EMA will setup down trend resumption to 100% projection of 1.0146 (2022 high) to 0.8332 from 0.9200 at 0.7382 at a later stage.