The dominant story across financial markets last week was not artificial intelligence, central banks, or economic data. It was a dramatic shift in expectations regarding the future of the US-Iran conflict. Investors increasingly embraced the view that the three-month war is moving toward a diplomatic resolution after reports emerged that negotiators had drafted a 60-day Memorandum of Understanding to extend the current ceasefire and establish a framework for broader de-escalation.
At the heart of the proposal is the Strait of Hormuz, the vital energy corridor that became the focal point of market fears throughout the conflict. According to reports, Iran would remove all restrictions on commercial shipping, clear underwater mines, and abandon plans to impose transit charges on passing vessels. In return, the United States would gradually dismantle its naval blockade and ease restrictions on Iranian oil exports. The framework effectively addresses the issue that posed the greatest threat to the global economy: a prolonged disruption to energy supplies.
Financial markets reacted immediately. Brent crude extended its steep retreat from earlier highs above $110 and breached $90 as traders priced in the prospect of normalized oil flows. The move represented a sharp reversal from the stagflation fears that dominated earlier in the past three months, when investors worried that a sustained closure of Hormuz could trigger another global inflation shock.
Bond markets reinforced the same message. The U.S. 10-year Treasury yield, which surged to 4.70% earlier in the month amid inflation concerns, reversed sharply lower and closed near 4.45%. The decline reflected growing confidence that the energy shock may not be severe enough to force another round of Federal Reserve tightening. Bond investors effectively voted against the worst-case inflation scenarios that had driven yields higher.
Equity investors were quick to embrace the improved backdrop. The removal of a major geopolitical risk arrived just as technology earnings and AI-related optimism remained exceptionally strong. Instead of worrying about oil prices and inflation, investors refocused on growth, productivity, and technology spending. The result was another powerful rally across global stock markets.
The biggest winners were once again technology-heavy markets. NASDAQ climbed to fresh records, while Nikkei and KOSPI surged to new highs. The synchronized advance reflected both relief over geopolitical developments and confidence that the AI investment cycle remains intact. European markets participated in the rally but continued to trail their U.S. and Asian counterparts.
Foreign exchange markets painted a more cautious picture. Kiwi and Aussie led gains as risk sentiment improved, while Dollar and Yen underperformed. Yet compared with the dramatic moves in stocks, oil, and bonds, currencies appeared far less convinced. Investors may be optimistic, but they are also aware that the agreement remains unsigned and politically fragile. The market is pricing peace, but the next phase depends on whether diplomacy can deliver what investors have already started to assume.
Brent Breakdown Signals Markets Are Pricing Oil Normalization
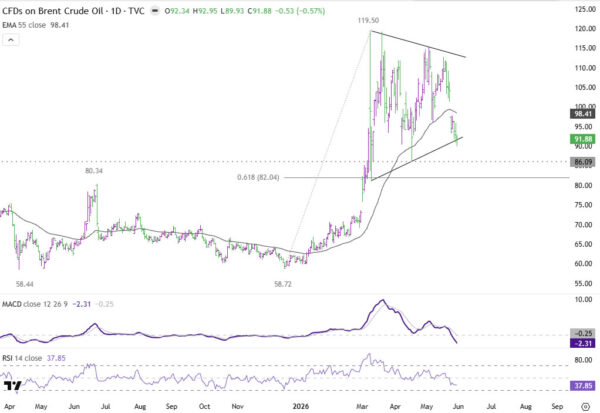
The most important chart in global markets is still Brent crude. Last week’s extension of the decline from 112.72 provided the strongest evidence yet that investors are increasingly pricing a diplomatic resolution to the US-Iran conflict and a gradual normalization of energy flows through the Strait of Hormuz. The selloff accelerated after the market gapped lower at the start of the week, reflecting growing confidence that the tentative ceasefire framework could ultimately evolve into a broader agreement.
Technically, the break below 55 D EMA (now 98.41), is a significant bearish development for the near term. More importantly, Brent has remained firmly below the moving average, suggesting the breakdown is not merely a temporary overshoot. While downward momentum has slowed as prices hit the lower trend line, there is still little evidence of bottoming. As long as resistance at 97.81 remains intact, the path of least resistance continues to point lower.
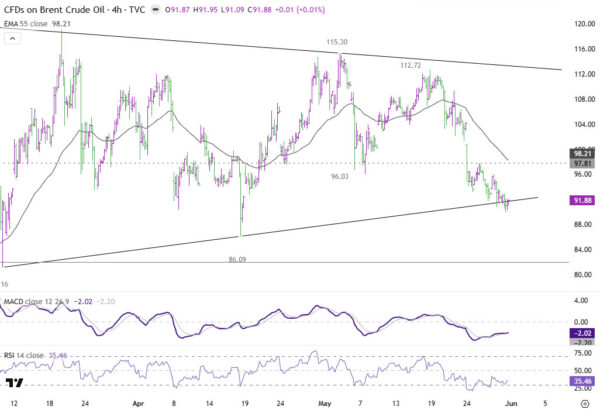
Attention is now turning to the lower trend line support (now at 92.0 area). Sustained trading below that support would open the way toward 61.8% retracement of 58.72 to 119.50 at 82.04. Some stabilization could emerge around that 82.04 zone as short-covering activity develops. However, if global oil supply continues normalizing and geopolitical risks continue fading, any rebound is likely to be capped below the 55 D EMA, setting the stage for a deeper decline through 82.04 at a later stage.
NASDAQ Surges as AI Optimism Reclaims the Narrative, 30,000 Next?
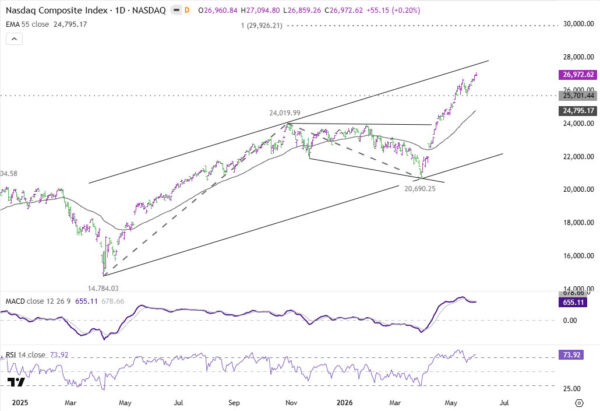
NASDAQ’s powerful up trend extended further last week, with the index closing at a fresh record high of 26,972. The rally has now fully shaken off concerns surrounding the US-Iran conflict that dominated market sentiment earlier in the month. As fears of a prolonged disruption to global energy supplies faded and oil prices retreated sharply, investors quickly returned their focus to the theme that has driven equities for much of the past two years: artificial intelligence. Strong technology earnings and continued enthusiasm over AI-related capital spending have provided a powerful foundation for further gains.
Technically, upside momentum is showing some signs of moderation as NASDAQ approaches the upper boundary of its medium-term rising channel, currently near 27,600. However, there are no meaningful signs of a top forming yet. The index continues to register higher highs and higher lows, while pullbacks remain shallow and well supported by buyers. As long as this structure remains intact, the path of least resistance continues to point higher.
A decisive break above channel resistance could trigger another phase of upside acceleration. In that scenario, the next major target would be 100% projection of 14,784 to 24,019 from 20,690.25 at 29,926. That places the psychologically important 30,000 level firmly within reach.
On the downside, break of 25,701 support would be the first indication of short-term topping and suggest a deeper pullback toward 55 D EMA (now at 24,795) before the broader up trend resumes.
Bond Market Prices Out Worst-Case Inflation Scenario
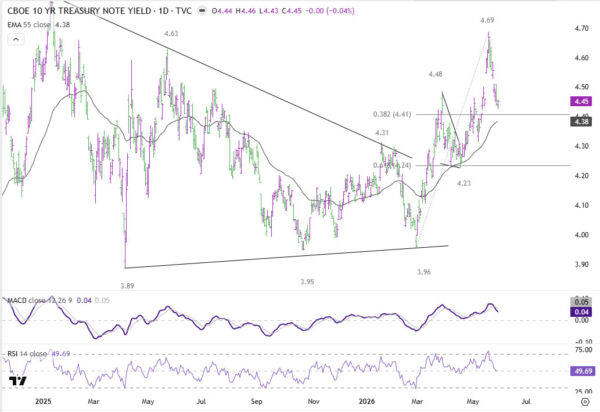
The sharp reversal in U.S. Treasury yields last week may have been one of the clearest signals that markets are embracing a diplomatic resolution to the US-Iran conflict. After reaching a 16-month high clear to 4.70% on May 19 amid fears of a prolonged energy shock, the benchmark 10-year yield retreated aggressively and ended the week around 4.45%. The decline suggests bond investors are pricing out the most extreme inflation scenarios that dominated sentiment earlier in the month.
Technically, the break below 4.48 support-turned-resistance confirms that a short-term top is in place at 4.69. However, downside momentum has not yet become decisive. The initial decline stalled ahead of 38.2% retracement of 3.96 to 4.69 at 4.41%. That leaves the yield trapped in what could become a near-term consolidation range between 4.41 and 4.69 as markets await further clarity on both inflation and the progress of US-Iran negotiations.
The next directional move may depend heavily on geopolitics. A renewed escalation in the conflict or a resurgence in inflation pressures would likely be required to push yields back above 4.69. Conversely, a formal ceasefire agreement and continued decline in oil prices should trigger a decisive break below 4.41, signaling that the entire rise from 3.96 has already completed. In that scenario, deeper fall should be seen to 61.8% retracement at 4.24, with scope for an even deeper decline if inflation fears continue to fade.
Dollar Downtrend Back in Focus as Peace Trade Gains Momentum
One of the more interesting developments last week was the contrast between Dollar resilience and broader market trends. On one hand, the greenback did not suffer the kind of collapse typically associated with falling oil prices, easing geopolitical tensions, and surging equity markets. On the other hand, it also failed to generate any meaningful recovery despite lingering uncertainty surrounding the final approval of the US-Iran ceasefire framework. The result was a relatively subdued performance that left Dollar among the week’s weaker currencies without triggering outright capitulation.
Technically, Dollar Index remains vulnerable after failing to sustain gains above 99.50. The retreat from 99.54 shifts immediate focus back to 55 D EMA (now at 98.77). Decisive break below that moving average would suggest the rebound from 97.63 was merely corrective and has already run its course. Such a development would likely encourage fresh selling pressure and place the January support zone at 95.55 back into focus.
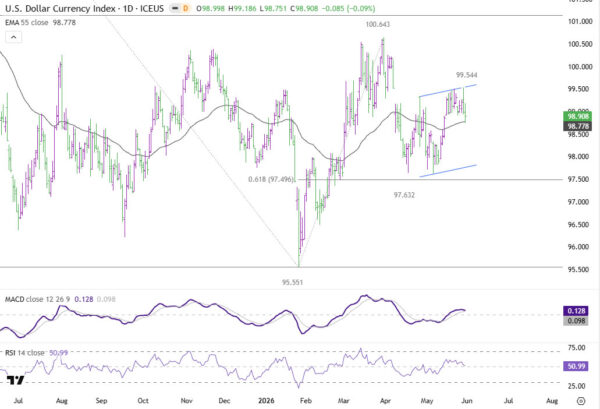
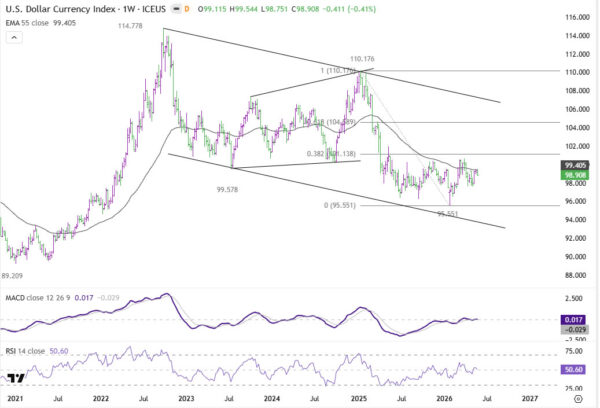
The larger trend continues to favor Dollar weakness. The rebound from 95.55 earlier this year never managed to challenge the key 38.2% retracement of 110.17 (2025 high) to 95.55 (Jan low) at 101.13, leaving the broader sequence of lower highs intact. A break of above mentioned 97.63 support could be interpreted as indication that the decline from 110.17 (2025 high) is resuming.
NZD/JPY Breakout Reflects RBNZ Hawkish Shift and Yen Weakness
NZD/JPY rallied strongly to become the week’s top mover, gaining 2.45%, supported by a powerful combination of risk-on sentiment, a resurgent Nikkei, and growing expectations that the Reserve Bank of New Zealand may soon start its tightening cycle. While many currencies participated in the broader improvement in sentiment, NZD/JPY stood out because both sides of the pair moved decisively in its favor.
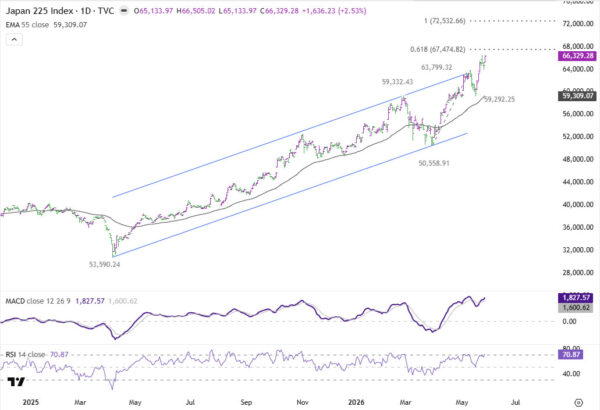
The Yen side of the equation was heavily influenced by developments in Japanese equities. Nikkei’s decisive break above its medium-term rising channel resistance is a powerful technical signal that the rally is accelerating rather than exhausting itself. The index has become one of the world’s strongest equity markets as investors aggressively rotate back into technology and AI-related themes. For Japanese investors, strong domestic equity performance continues to reduce demand for defensive Yen holdings.
Technically, further rally is expected in Nikkei as long as 63,799 resistance turned support holds. Firm break of 61.8% projection of 50,558 to 63,799 from 59,292 at 67,474 will pave the way through 70k psychological level to 100% projection at 72,532.
Such strength is likely to keep Yen under pressure. Although intervention concerns continue to discourage aggressive buying of USD/JPY near 160, they do little to prevent strength in Yen crosses where Dollar is not involved. As a result, NZD/JPY would be one of the cleanest vehicles for expressing bearish Yen views.
At the same time, New Zealand Dollar received substantial support from a dramatic shift in RBNZ expectations. The central bank maintained rates last week, but only after a 3-3 split vote that required Governor Anna Breman’s casting vote to keep policy unchanged. More importantly, officials spent the rest of the week reinforcing the message that tightening is likely to come sooner rather than later, and perhaps more aggressively.
Several top policymakers effectively confirmed that July is now a live meeting for a rate hike. Even more striking was the refusal to rule out a larger move if inflation risks continue to build. Officials made clear they do not need to wait for the Q2 inflation report before acting. As a result, markets have shifted from debating whether the RBNZ will hike to debating whether a 25bps or 50bps move could ultimately be delivered at the next meeting.
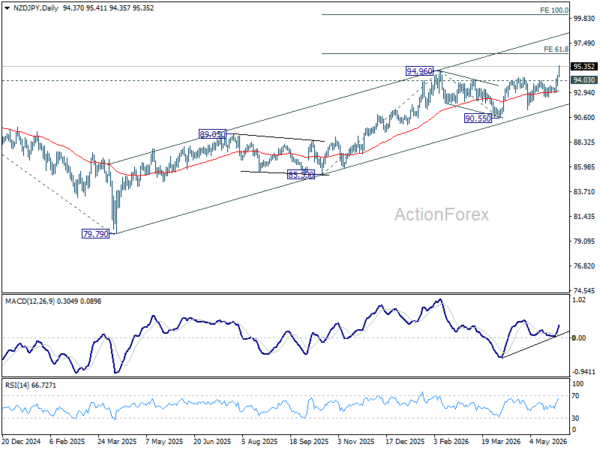
NZD/JPY’s medium term up trend resumed by breaking through 94.96 resistance last week. Further rise is now expected as long as 94.03 resistance turned support holds. Next target is 61.8% projection of 85.33 to 94.96 from 90.55 at 96.50. Decisive break there could trigger upward acceleration to 100% projection at 100.18, which is slightly above 100 psychological level.
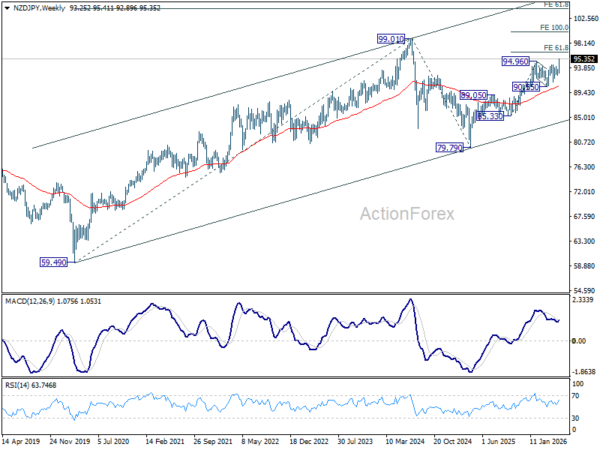
In the bigger picture, NZD/JPY’s rise from 79.79 (2025 low) is now looking more likely a five-wave impulse. That is, the correction from 99.01 (2024 high) could be totally completed with three waves down to 79.79. Up trend from 59.49 (2020 low) might be ready to resume. Firm break of above mentioned 96.50 projection level will solidify this long term bullish case.
USD/CHF Weekly Outlook
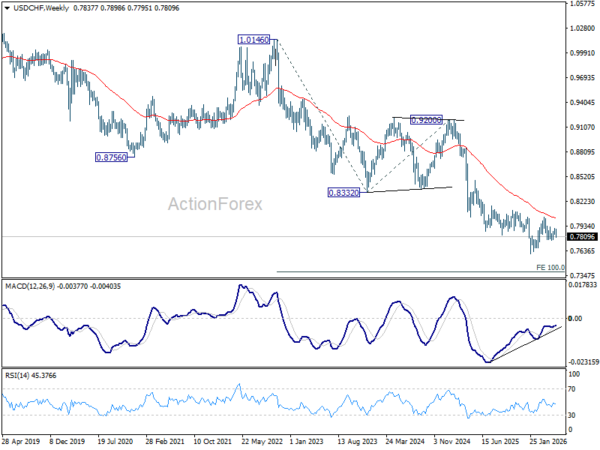
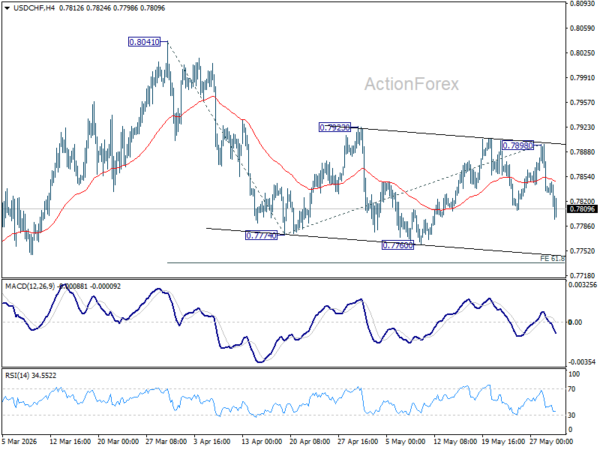
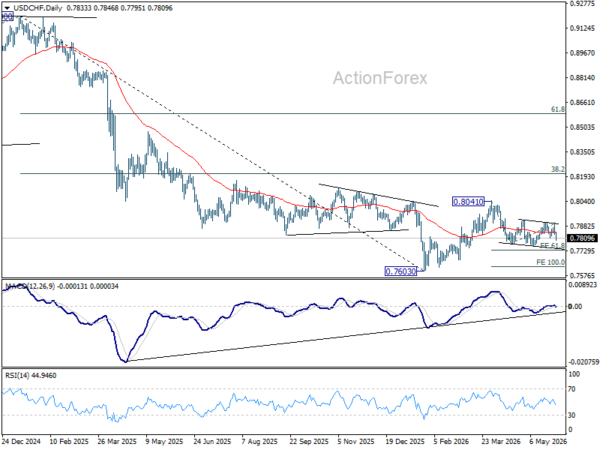
The late break of 0.7807 support suggests that USD/CHF’s corrective rebound has completed. Initial bias is back on the downside this week for retesting 0.7760 first. Firm break there will resume the fall from 0.8041. Next target will be 61.8% projection of 0.8041 to 0.7774 from 0.7898 at 0.7733. Risk will now stay on the downside as long as 0.7898 resistance holds, in case of recovery.
In the bigger picture, as long as 55 W EMA (now at 0.8028) holds, fall from 0.9200 is expected to continue, as part of the larger down trend. Firm break of 0.7603 will target 100% projection of 1.0146 (2022 high) to 0.8332 from 0.9200 at 0.7382.
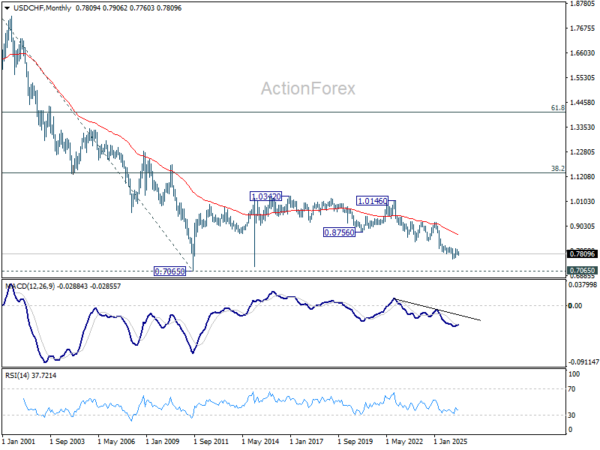
In the long term picture, price action from 0.7065 (2011 low) are seen as a corrective pattern to the multi-decade down trend from 1.8305 (2000 high). It’s uncertain if the fall from 1.0342 is the second leg of the pattern, or resumption of the downtrend. But in either case, outlook will stay bearish as long as 0.8756 support turned resistance holds (2021 low). Retest of 0.7065 should be seen next.