
TL;DR: The Nikkei 225 is closing in on a fresh record near 72,831.73, but unlike June’s rally—when USD/JPY ran alongside it to 163.97—a faster BoJ tightening cadence, a more patient Fed, credible intervention risk and the absence of a fresh oil shock mean USD/JPY is unlikely to follow through the 160 zone this time.
Why This Matters
Japan’s equity rally is again approaching the point where the Nikkei’s strength and Yen weakness were closely linked earlier this year. But the comparison only goes so far. The equity breakout looks genuine, and the question that matters for traders isn’t whether the Nikkei can retest its record—it’s whether USD/JPY has to follow the same script it did in July. Four specific differences argue it doesn’t, at least not yet, and each one has a clear condition that would reverse it.
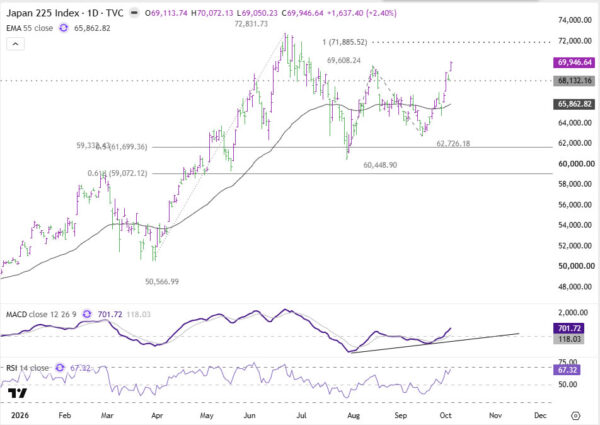
The Nikkei 225 surged 2.40% to 69,946.64 today, clearing the 69,608.24 August swing high and moving to within roughly 4% of the 72,831.73 record. When the Nikkei last set a record in June, USD/JPY was already above 161 and subsequently extended its advance to 163.97 in late July. This time, USD/JPY is still around 157.7, almost six yen below that peak.
Nikkei Breakout Has Real Momentum
The Nikkei’s break above 69,608.24 strengthens the view that price action from 72,831.73 is merely a correction of the rise from 50,566.99, rather than the start of a larger downtrend.
As long as 68,132.16 support holds, the immediate bias stays higher. The next upside target is 71,885.52, the 100% projection of the 60,448.90–69,608.24 advance from 62,726.18. Above there sits the 72,831.73 record high. The chart therefore gives the Nikkei a credible path back to its record. What is much less clear is whether USD/JPY still needs to accompany it.
July’s Run to 163.97 Needed More Than a Rising Nikkei
The last Nikkei record was followed by another leg higher in USD/JPY, but the Yen move was not simply a mechanical consequence of Japanese equity strength. By late July, several forces had aligned in the same direction.
The Fed had turned more hawkish, markets were pricing additional US tightening, Treasury yields were elevated and the Yen had spent enough time above 160 for investors to question where Tokyo’s intervention threshold actually stood.
Then oil supplied another impulse. Brent had been near 70 earlier in the summer before surging above 100 as Middle East risks intensified, following the collapse of the US-Iran ceasefire. That created a fresh inflation shock just as markets were debating how much further the Fed might have to tighten. USD/JPY eventually reached 163.97. That combination is important because the current setup looks different in each of those areas.
1. BoJ Tightening Is Arriving Faster
The first difference is the BoJ cadence. The Bank of Japan raised rates in December, again in June and then in September. The interval shortened from roughly six months to around three months.
That does not mean every BoJ hike immediately strengthens the Yen. The June move was followed by USD/JPY rising further toward 164, while the Yen also weakened immediately after September’s increase. But the medium-term significance is different: the market can no longer comfortably assume that the BoJ will wait half a year between every move. A roughly quarterly cadence, if sustained, would allow Japanese rates to rise alongside US rates rather than simply watching the Fed move away. That distinction matters more than the immediate FX reaction to any single meeting.
The BoJ has not explicitly committed to that pace, and expectations for another October hike remain low. December is a more plausible window under the current market view. So the argument should not be that the BoJ is embarking on an aggressive tightening cycle. Rather, the Japan side of the rate differential is now moving faster than it was earlier this year.
2. The Fed Is Still Tightening, But at a More Patient Pace
The second difference is the Fed. Markets have not abandoned the tightening cycle. The expected Fed funds midpoint is around 4.12% in December, 4.39% in March and 4.61% in June, before flattening around 4.65–4.70% later in 2027. That is still a hawkish rate path.
But it is a patient tightening path, not an assumption of rapid back-to-back hikes. October hike probability has fallen sharply, while the curve increasingly spreads additional tightening over subsequent meetings. That matters for USD/JPY because the policy gap is not obviously entering another period of rapid expansion.
The most revealing market comparison is elsewhere. US yields have recently traded above the levels seen around July’s USD/JPY peak, yet USD/JPY remains almost six yen beneath 163.97. That suggests the simple mapping between US yields and USD/JPY has weakened. Higher US rates still support Dollar against Yen. But the same yield environment is producing less Yen depreciation than it did in July, indicating that BoJ policy and intervention risk are now carrying greater weight on the Japan side of the equation.
3. Above 160, Intervention Risk Is No Longer Abstract
The biggest change since July is not simply that Japan has intervened before. It is that 160 now carries the memory of a joint US-Japan operation, reinforced by persistently tougher official rhetoric since then.
Earlier in the summer, the market had become increasingly comfortable trading above 160. USD/JPY spent weeks above that threshold, and repeated warnings from Tokyo failed to trigger immediate action. That encouraged the view that officials were prepared to tolerate a materially weaker Yen, allowing speculative positioning to build as the pair pushed toward 163.97.
The end-July intervention changed that calculation decisively. The operation was not just another unilateral attempt by Japan to slow Yen weakness; US participation gave the move much greater signalling power. Even though the exchange-rate effect faded relatively quickly, the message was harder to dismiss: both sides were prepared to act when Yen depreciation became disorderly enough.
Since then, Japanese officials have also maintained a consistently tougher rhetorical stance, keeping intervention risk alive rather than allowing the warning to fade with time. That matters because traders are now approaching 160 with a very different risk-reward calculation. The level is no longer merely a psychological threshold or a place where verbal intervention might intensify. It is the zone around which coordinated action has already occurred.
That does not make 160 a hard cap. Intervention cannot permanently overpower monetary-policy fundamentals, and USD/JPY recovered much of its initial decline after the July operation. But it does mean that long positions above 160 now carry a known and credible tail risk that was far less respected during the previous run toward 164.
4. July Had an Oil Shock; Today Has High Oil
Oil may be the most important difference. Brent is still expensive above $100, but the dynamic is very different from July. The crucial distinction is: high oil is a condition. Rising oil is a catalyst.
The July USD/JPY rally was reinforced by a rapid oil surge that changed the inflation outlook and encouraged markets to price a more aggressive or extended Fed cycle. Brent near 101 today does not deliver the same incremental shock. Markets already know energy prices are high.
For oil to recreate July’s transmission mechanism, it likely needs to re-accelerate through 109.97 and decisively above the 110 area, rather than simply remain around 100. That would revive the transmission chain: an oil shock would lift inflation expectations, encourage more aggressive Fed pricing and renew pressure on Yen. Until then, energy is providing a high inflation floor without the fresh momentum that helped drive USD/JPY toward 164.
What Could Put 164 Back Into Play?
The argument against another immediate move to 164 is conditional, not absolute. The cleanest invalidation would be another oil shock. A decisive Brent break above 109.97–110, particularly if driven by renewed Middle East escalation, could force markets to reconsider the persistence of inflation and push the expected Fed rate plateau higher again.
A second trigger would be a renewed acceleration in Fed tightening expectations. The upcoming FOMC minutes are relevant here: evidence that officials are comfortable with an extended sequence of hikes into 2027 would reinforce the Dollar side of the equation.
The third would simply be price itself. A decisive USD/JPY break through the 159.73–160.38 resistance cluster would indicate that the decline from 163.97 has likely completed. That would put the 162.51 100% projection back into view and dramatically reduce the distance to 163.97. But until those conditions emerge, the July analogy looks incomplete.
ActionForex’s Technical View on the Nikkei 225
Nikkei’s immediate technical structure is bullish while 68,132.16 holds. The break above 69,608.24 resumes the rebound from 60,448.90 and points toward 71,885.52. A break there would put the 72,831.73 record high directly in focus.
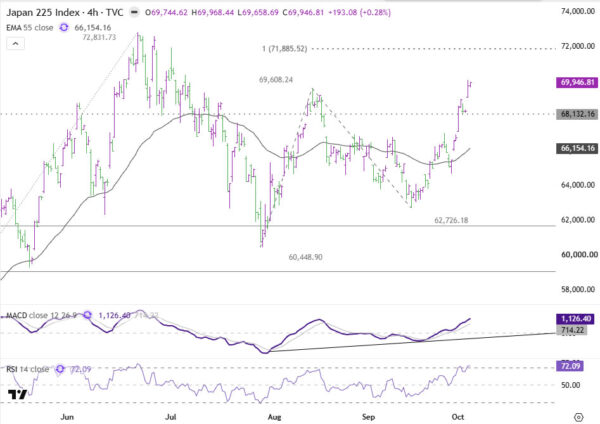
The significance of 68,100–68,132 is especially strong because structural support coincides with the 61.8% retracement near 68,101. Holding that zone would keep the latest breakout intact even after a short-term pullback. A close back below 68,100 would weaken the breakout and shift attention toward the 55 D EMA at 65,862.82. For now, however, the chart favors another test of the record.
ActionForex’s Technical View on USD/JPY
USD/JPY presents a much less straightforward bullish structure. The rebound from 152.87 stalled at 159.02, and subsequent trading has been consolidative rather than impulsive. Price is currently around 157.7 and pressing the 55 D EMA around 158.09. A fresh rise cannot be ruled out while 156.36 holds, but there is little open space above.
The resistance sequence is:
- 158.09 — 55 D EMA
- 159.02 — September swing high
- 159.73 — 61.8% retracement of 163.97–152.87
- 160.16 — 61.8% projection of 152.87–159.02 from 156.36
- 160.38 — structural resistance
- 160 area — intervention-risk zone
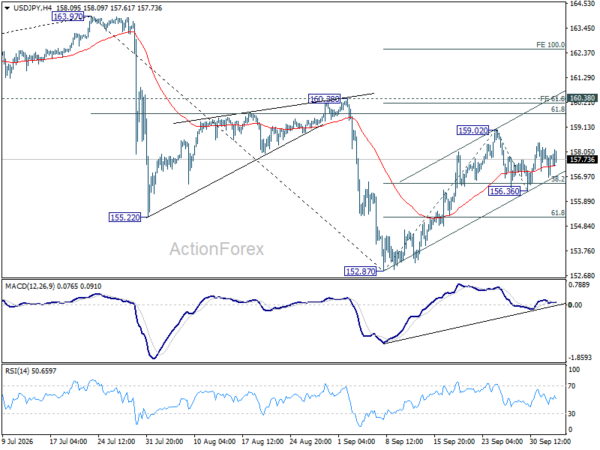
That cluster is the technical expression of the article’s macro thesis. A decisive break through 160.38 would be important: it would suggest the decline from 163.97 has completed and expose 162.51, the 100% projection level, followed by a potential retest of 163.97. But rejection from the zone would leave USD/JPY trapped well below the level reached during the previous Nikkei record run. Below 156.36, attention would return to 155.22, with a deeper break reopening the 152.87 low.
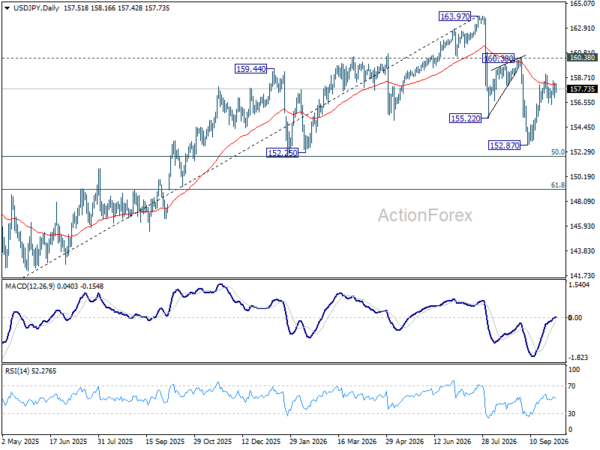
The Nikkei therefore has the clearer bullish chart. Japan’s equity market can retest 72,831 without USD/JPY returning to 164. For the Yen to recreate July, it likely needs more than another equity record—it needs a renewed oil shock, stronger Fed acceleration, or enough momentum to force its way through the intervention-heavy 160 zone.
Key Takeaways
- The Nikkei 225 surged 2.40% to a fresh high, closing within roughly 4% of its 72,831.73 record—but USD/JPY sits nearly six yen below where it traded during June’s record run.
- A faster BoJ hiking cadence (roughly quarterly versus the prior six-month gap) means Japan’s side of the rate differential is now moving faster than earlier this year.
- The Fed’s tightening path remains hawkish but more patient, and US yields above July’s peak are producing less Yen depreciation than before—suggesting BoJ policy and intervention risk now carry more weight.
- The end-July US-Japan coordinated intervention, plus sustained tougher rhetoric since, has made 160 a zone with known, credible tail risk rather than just a psychological level.
- Without a fresh oil shock (Brent decisively above 109.97–110) or a hawkish surprise from Fed policy or price action through 160.38, USD/JPY’s path back to 164 looks far less automatic than it did in July.