
TL;DR: Bitcoin and Ether have defended nearly identical support twice in less than a week—Bitcoin near 80,365–80,953 and Ether near 2,407—but neither has cleared the resistance needed to confirm its correction is over, leaving Wednesday’s US CPI and upcoming ETF flows as the key tests of whether spot demand can sustain the rebound.
Why This Matters
Bitcoin and Ether have rebounded sharply from a second wave of leveraged selling in less than a week, with both cryptocurrencies defending nearly identical support areas despite renewed volatility. Bitcoin recovered from an overnight low of 80,953 to around 83,281, while Ether bounced from 2,407 to around 2,515. The repeated recoveries suggest that forced liquidations have amplified the recent selloff without triggering a sustained breakdown in prices.
However, holding support is not the same as confirming a bottom. Neither cryptocurrency has overcome the resistance needed to signal that its correction has ended. For now, the declines from Bitcoin’s 87,354 and Ether’s 2,806 highs are still viewed as corrections to their preceding five-wave advances, rather than confirmed larger bearish reversals. The immediate question is whether spot demand can sustain the recoveries once leveraged selling subsides.
Two Liquidation Waves, Similar Support, Rapid Recoveries
The first major selling wave on October 7–8 coincided with broader pressure on risk assets as US Treasury yields climbed toward multi-decade highs and concerns over AI investment valuations weighed on technology sentiment. The US 10-year yield reached 5.365%, while elevated oil prices reinforced inflation and interest-rate concerns.
Crypto had already shown signs of losing upward momentum before the macro pressure intensified. The subsequent selloff was amplified by leveraged liquidations and ETF redemptions. CoinGlass-based figures indicated approximately $974 million in liquidations over 24 hours, including around $896 million in long positions. US spot Bitcoin ETFs also recorded approximately $484.9 million in net outflows on October 7, adding to selling pressure.
Bitcoin fell to 80,365.12, while Ether reached 2,407.04, before both recovered.
The second episode, late Monday into early Tuesday, was considerably shorter. Crypto Briefing reported approximately $120 million in long liquidations within about 15 minutes as Bitcoin slipped below $82,000. Bitcoin subsequently reached 80,953.41, establishing a higher low than October 8, while Ether touched 2,407.33, almost exactly matching its previous low.
Both cryptocurrencies rebounded quickly, even as Asian technology equities faced renewed selling pressure.
The repeated defense of support suggests that liquidation-driven selling has not developed into a broader breakdown. However, the speed of the recoveries alone does not establish that the underlying correction is complete.
Leverage Has Been Cleared, But Spot Demand Remains the Question
The two episodes highlight an important distinction between forced selling caused by leveraged positions and sustained selling from underlying investors.
When heavily leveraged long positions are liquidated, selling can accelerate rapidly as positions are closed automatically. Once that pressure subsides, prices can recover without necessarily requiring a substantial improvement in broader market sentiment. That pattern is consistent with the rapid rebounds seen in Bitcoin and Ether.
However, liquidations do not explain whether sufficient spot demand exists to sustain the recovery.
The October 7 Bitcoin ETF outflow was substantial, but the broader flow picture was less uniformly negative. Five-day net outflows stood at approximately $162.9 million, while the preceding 30 days still showed net inflows of around $1.76 billion. That suggests short-term selling pressure rather than clear evidence of a structural institutional exit.
More recent ETF flows remain unconfirmed in the supplied data, leaving an important question unanswered. Continued redemptions would suggest that underlying demand is weakening even as leverage is cleared, potentially making subsequent recoveries more difficult to sustain.
Conversely, stabilizing ETF flows alongside continued defense of the October lows would strengthen the interpretation that the market is undergoing a corrective adjustment rather than a broader reversal.
ActionForex’s Technical View
Bitcoin Correction Could Extend Toward 76,040 Before Completion
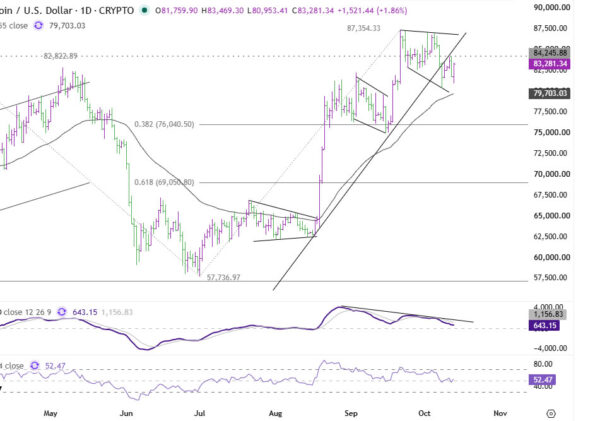
Technically, Bitcoin’s decline from 87,354.33 is viewed as a correction to the five-wave advance from 57,736.97.
The October 8 low of 80,365.12 coincided almost exactly with the 23.6% retracement of that advance. The subsequent higher low at 80,953.41 reinforces the significance of this support area.
Nevertheless, the daily chart continues to show bearish MACD divergence, while the earlier rising trendline has been broken. The recovery has also encountered resistance around the 4-hour 55 EMA, currently near 83,431. These developments suggest that the correction may not yet have run its course.
Near-term bias remains mildly to the downside as long as 84,245.88 resistance holds. Another decline could extend toward the daily 55 EMA, currently around 79,703, followed by the 38.2% retracement of 57,736.97 to 87,354.33 at 76,040.50.
However, strong support is expected around 75,026.09–76,040.50, where the retracement converges with the September wave-four low. This area could provide the foundation for completing the correction and resuming the broader advance.
On the upside, a firm break above 84,245.88 would be the first stronger indication that the corrective pullback has completed, bringing a retest of 87,354.33 back into focus.
Ether: Repeated Support at 2,407, But Recovery Still Faces Resistance
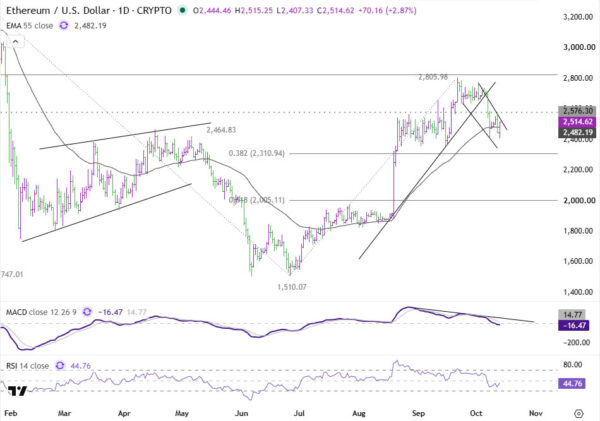
Ether’s technical structure is similar, with the decline from 2,805.98 viewed as a correction to the five-wave advance from 1,510.07.
The most significant development is the repeated defense of support around 2,407. Ether’s October 8 low of 2,407.04 was almost exactly matched by Tuesday’s 2,407.33 low, suggesting that selling pressure has so far failed to produce a decisive breakdown.
However, the broader technical picture remains corrective. Ether has broken its earlier rising trendline, while daily MACD continues to show weakening momentum. The latest recovery has also struggled below the 4-hour 55 EMA, currently around 2,560.
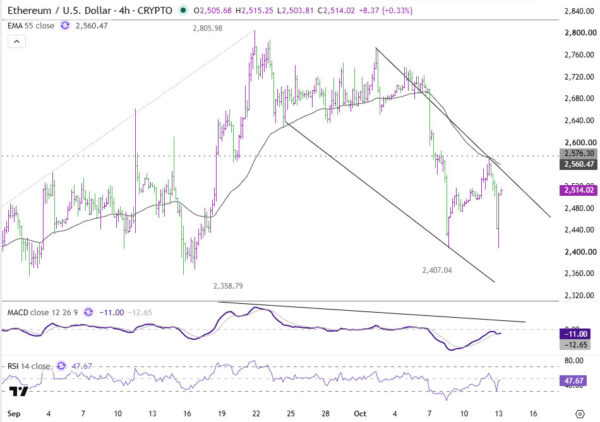
Near-term bias remains mildly bearish while 2,576.30 resistance holds. Another decline could retest 2,407 and extend toward the 38.2% retracement of 1,510.07 to 2,805.98 at 2,310.94. Strong support is expected around that retracement level to contain the downside and potentially complete the correction.
Conversely, a firm break above 2,576.30 would provide the first stronger indication that the decline from 2,805.98 has finished, opening the way for a renewed advance toward that high.
Compared with Bitcoin, Ether has already tested below its daily 55 EMA during the correction, suggesting somewhat greater vulnerability to another downside extension.
US CPI and ETF Flows Could Determine the Next Break
Wednesday’s US CPI report provides the next major external catalyst.
Markets expect headline inflation of 0.6% month-on-month and core inflation of 0.2%. A hotter-than-expected core reading could revive expectations for additional Fed tightening, pushing Treasury yields and the Dollar higher and renewing pressure on cryptocurrencies.
Conversely, softer underlying inflation could reinforce the recent Treasury-yield correction, providing a more supportive backdrop for Bitcoin and Ether to challenge resistance.
But the more decisive evidence will come from the combination of technical confirmation and underlying spot demand. Bitcoin needs to overcome 84,245.88, while Ether must clear 2,576.30. Until those levels break, another corrective decline remains possible despite the resilience shown during the two liquidation episodes.
Two liquidation waves have failed to break the October support areas, supporting the view that Bitcoin and Ether are correcting rather than undergoing confirmed larger bearish reversals. But the inability to clear resistance means the corrections remain unresolved. Whether Wednesday’s CPI and subsequent ETF flows provide the necessary support for a sustained recovery is now the central question.
Key Takeaways
- Bitcoin and Ether have each defended support twice in under a week—Bitcoin around 80,365–80,953 and Ether around 2,407—suggesting liquidation-driven selling hasn’t become a broader breakdown.
- Roughly $974m in liquidations and $484.9m in Bitcoin ETF outflows amplified the first wave, but 30-day ETF flows remain net positive at +$1.76bn, pointing to short-term pressure rather than a structural exit.
- Bitcoin’s near-term bias stays mildly bearish below 84,245.88, with a break lower risking a test of the 75,026–76,040 support zone; a break above 84,245.88 would reopen the path to 87,354.33.
- Ether’s near-term bias stays mildly bearish below 2,576.30, with 2,310.94 the next support if 2,407 fails; a break above 2,576.30 would point back toward 2,805.98.
- Wednesday’s US CPI and the next round of ETF flow data are the key catalysts that will determine whether spot demand can sustain the recovery once leveraged selling pressure fades.