
TL;DR: Gold has fallen to a one-year low ahead of the FOMC minutes, but the December hike is already settled and the bigger question is how far the Fed goes beyond it. Yields and the Dollar do not fully explain the scale of the selloff, pointing to positioning and broad commodity selling as possible amplifiers, with key support converging around 3,600–3,637.
Why Is Gold Falling to a One-Year Low Before the FOMC Minutes?
Gold extended its steep decline on Wednesday, falling to its lowest level in more than a year as investors prepared for the minutes of the Federal Reserve’s October 27–28 meeting. The metal was trading around 3,770 at 09:00 GMT, down more than 2% on the day and 6.5% over the past week. The broader backdrop remains unfavorable for bullion, with the Dollar near a 19-month high and markets pricing further Fed tightening. Yet the December rate hike itself is largely settled, with CME FedWatch assigning a 96.7% probability to a 25bps increase. The more consequential uncertainty is how far the Fed will need to raise rates beyond December. Meanwhile, gold’s latest decline is substantially larger than the Dollar’s advance, and Treasury yields are actually lower on the day, suggesting the selloff cannot be explained by interest rate expectations alone.
December Hike Nearly Certain, but Further Tightening Remains in Focus
The Fed held its benchmark rate at 3.75–4.00% in October, with the decision passing by a 10–2 vote. Governors Lisa Cook and Beth Hammack dissented, both favoring a 25bps increase. The accompanying statement described economic activity as expanding at a strong pace while inflation remained elevated, reinforcing expectations that monetary policy would need to become more restrictive.
Since then, market pricing has shifted decisively toward a standard-sized December hike. According to CME FedWatch data at 07:53 GMT, the probability of a 25bps increase on December 9 stood at 96.7%, up from 95.5% on November 16 and 87.3% on November 11. Over the same period, the probability of a larger 50bps move fell from 12.7% to just 3.3%.
- 25bps December 9 hike: 87.3% (Nov 11), 95.5% (Nov 16), 96.7% (today, 07:53 GMT)
- 50bps December 9 hike: 12.7% to 3.3%
The shrinking probability of a jumbo hike does not indicate fading expectations for tightening. Instead, investors have become more confident about the immediate size of the next increase, while the debate has moved toward the number of additional hikes that may follow.
By the January 27 meeting, futures pricing implies approximately a 72% probability of another increase beyond December. Further along the curve, the expected policy rate is consistent with roughly 2.7 quarter-point hikes by April 2027 and 3.1 by November 2027, measured from the current range.
Recent Fed commentary has reinforced the prospect of additional tightening, although officials differ on how aggressively policy should respond. St. Louis Fed President Alberto Musalem has suggested that several rate increases may be required before spring 2027, with his assessment of the appropriate level of rates potentially exceeding what markets currently anticipate. Cleveland Fed President Beth Hammack has also argued that financial conditions remain insufficiently restrictive, while New York Fed President John Williams has supported further increases but pushed back against the need for dramatic action.
The minutes, due at 19:00 GMT, could provide greater insight into how broadly officials supported tightening at the October meeting, whether larger increases were seriously considered, and how policymakers assessed the eventual level of interest rates.
However, the document will be backward-looking. It predates October’s inflation report and the latest round of Fed speeches, limiting its ability to surprise investors unless it reveals a more hawkish or divided policy debate than currently understood.
Follow gold’s slide, the FOMC minutes and the Fed’s rate path on the ActionForex Telegram channel.
Gold’s Decline Outpaces the Move in Yields and Dollar
Gold’s recent weakness is broadly consistent with the repricing of Fed policy. Higher interest rates raise the opportunity cost of holding non-yielding bullion, while a stronger Dollar adds pressure by making gold more expensive for holders of other currencies.
Over the past week, US two-year and ten-year Treasury yields have both risen by approximately 22–23bps, while the Dollar Index has gained 1.57%. These movements provide a reasonable macroeconomic explanation for part of gold’s 6.51% weekly decline.
But the relationship is much less convincing in Wednesday’s session.
At 09:00 GMT, gold was down approximately 2.06%, compared with a modest 0.22% increase in DXY. More importantly, the US two-year yield had slipped to around 4.791% and the ten-year yield to 5.093%, both down roughly 1.5bps on the day.
- Past week: gold −6.51%; US two-year and ten-year yields +22–23bps; Dollar Index +1.57%
- Wednesday, 09:00 GMT: gold −2.06%; DXY +0.22%; US two-year yield about 4.791% and ten-year yield about 5.093% (both about −1.5bps)
The divergence is also visible over a longer horizon. Gold has lost 9.46% over the past month, while the ten-year yield is only around 3bps higher over the same period. Although the benchmark yield has rebounded approximately 28bps from its early-November low, that recovery does not fully account for the scale of bullion’s retreat.
The Fed’s tightening trajectory remains an important source of pressure, but the latest decline appears too pronounced to attribute exclusively to rising yields and Dollar strength. Other forces may be amplifying the move.
Broad Commodity Selling Raises Questions About Positioning
The weakness extends well beyond gold. Copper was down 4.15% at the same market snapshot, while platinum and silver had fallen 3.45% and 3.39%, respectively. Crude oil was also under pressure, with WTI declining 3.36% and Brent losing 2.13%. Iron ore, up 0.18%, was a notable exception.
- Copper: −4.15%; platinum: −3.45%; silver: −3.39%
- WTI: −3.36%; Brent: −2.13%; iron ore: +0.18%
Silver’s sharper decline pushed the gold/silver ratio higher to 82.388, reinforcing the picture of broad selling across precious metals rather than an isolated adjustment in bullion.
Reuters cited analysts suggesting that investors were reducing positions and selling gold as a liquid asset. The simultaneous declines across metals and energy are consistent with such an interpretation, particularly given that gold has continued falling even as Treasury yields eased.
However, the evidence supports positioning or liquidity pressure as a possible contributor, not a confirmed explanation for the selloff.
Financial markets are not displaying a uniform flight from risk. South Korea’s KOSPI was up nearly 2%, Japan’s Nikkei was modestly higher, and European equities were showing relatively limited moves. Bitcoin and Ether were also down by less than 1%.
In currencies, Yen was outperforming its major counterparts, while the Dollar’s gains were concentrated against several other currencies rather than extending across the board.
This mixed picture suggests that the selling pressure is particularly pronounced within commodities, rather than reflecting indiscriminate liquidation across all asset classes.
The distinction matters for gold’s next move. If bullion continues falling alongside higher Treasury yields and a further hawkish repricing of the Fed’s expected rate path, the monetary policy explanation would strengthen. If gold remains under pressure without meaningful changes in yields or Fed pricing, positioning and broader commodity-market weakness would remain more plausible contributing factors.
FOMC Minutes May Test the Selloff’s Underlying Drivers
With December’s 25bps hike already priced at 96.7%, the minutes may have limited capacity to change expectations for the next meeting. Their greater importance lies in whether they shift the expected pace and extent of tightening during 2027.
Evidence of broad support for successive hikes, concern about persistent inflation, or discussion of a higher eventual policy rate could reinforce pressure on gold if Treasury yields respond accordingly.
Conversely, indications that officials remain divided over how much additional restraint is needed could temper expectations further along the rate curve, potentially offering bullion some relief.
The reaction of the US two-year yield and January–March Fed pricing will therefore be especially informative. A gold decline accompanied by further hawkish repricing would point toward monetary policy as the dominant driver. Continued gold weakness without a corresponding rates response would leave the positioning explanation more relevant.
ActionForex’s Technical View: Gold, Key Support Converges Around 3,600–3,637
Gold’s downtrend continues, with downside momentum strengthening as reflected in the four-hour MACD. The latest break lower has also left the metal well below its declining 55-period EMA, maintaining a bearish near-term technical picture.
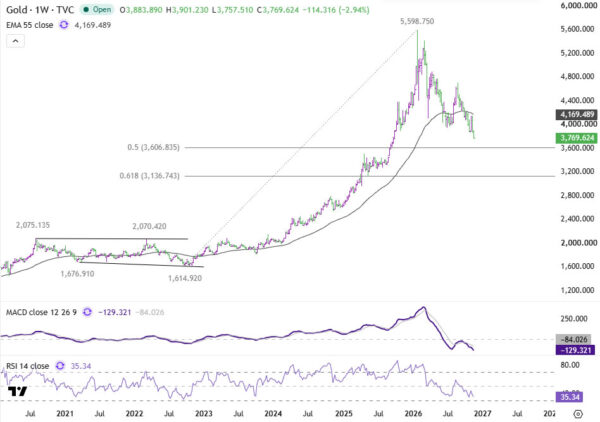
Gold is now approaching an important target zone where several technical levels converge. The first is the 61.8% projection of the decline from 4,697.07 to 3,869.96, measured from 4,148.60, at 3,637.44. Below that lies the longer-term 50% retracement of the advance from 1,614.92 to 5,598.75 at 3,606.83, followed closely by the psychological 3,600 level.
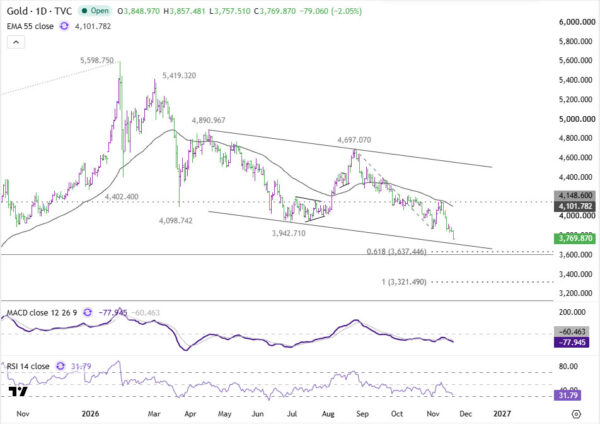
The concentration of these levels could attract support and temporarily halt the decline, particularly with the four-hour RSI already indicating oversold conditions. Nevertheless, the strength of current downside momentum argues against assuming that a sustained reversal will develop.
A break above 3,890.97 resistance would bring consolidation, but the broader outlook will remain bearish as long as 4,148.60 holds.
If gold breaks decisively through 3,600, the next downside target would be the 100% projection of 4,697.07 to 3,869.96 from 4,148.60, at 3,321.49.
Key Takeaways
- Gold fell to about 3,770, its lowest in more than a year, down more than 2% on the day and 6.5% on the week, ahead of the FOMC minutes at 19:00 GMT.
- The December 25bps hike is priced at 96.7%, so the more important question is how far the Fed raises rates beyond it, with about 3.1 quarter-point hikes implied by November 2027.
- Gold’s 2.06% drop on Wednesday came as US yields slipped about 1.5bps and DXY rose only 0.22%, so yields and the Dollar do not fully explain the selloff.
- Copper, platinum, silver and oil also fell sharply, which suggests positioning or liquidity pressure as a possible contributor rather than a confirmed explanation.
- Support converges at 3,637.44, 3,606.83 and 3,600, with 3,321.49 below, while 3,890.97 and 4,148.60 are the resistance levels for the bearish view.
Stay ahead of gold’s slide toward 3,600 and the Fed signals that could shape it—join the ActionForex Telegram channel for regular market updates and analysis.