
Key takeaways
- Rebound losing momentum: Gold staged a sharp 15.7% bounce from the $4,405 low but is now showing signs of bullish exhaustion below the key $5,170 resistance, with price action stalling above the 20-day moving average at $4,940.
- Supportive macro correlations fading: The usual inverse relationship with the US dollar has weakened, and the Shanghai gold premium has flipped from a strong premium to a discount, signalling softer physical demand and reduced upside momentum.
- Technical risks tilted lower near term: Bearish RSI divergence and momentum breakdown increase the risk of a pullback toward $4,795–$4,703, or even a retest of the $4,500/$4,405 zone, unless price clears decisively above $5,170.
This is a follow-up analysis and an update of our prior report, “Chart alert: Gold extends plunge by 9%, approaching $4,405 inflection level for potential minor bounce,” published on 2 February 2026
The price action of the precious yellow metal has shaped the expected minor bounce, with Gold (XAU/USD) rebounding by 15.7% from the $4.405 key short-term support printed on 2 February 2026, reaching an intraday high of $5.092 on 4 February 2026.
Thereafter, it traded sideways above its 20-day moving average, which now serves as key near-term support at US$4,940.
Gold-US dollar indirect correlation has broken down (for now)
In contrast, the US Dollar Index has staged a decline of 1.3% from its 4 February 2026 high to 11 February 2026 low, and the recent spate of US dollar weakness does not translate into a positive feedback loop for Gold (XAUUSD), where the prior strong rally seen Gold (XAU/USD) from 16 January 2026 to 29 January 2026 had been accompanied by a drop in the US Dollar Index (having a significant indirect correlation) over the same period (see Fig. 1).
Interestingly, the recent lackluster movement of Gold (XAU/USD) from 4 February 2026 to 12 February 2026 has been in sync with a dwindling of the premium seen in the Shanghai gold futures over the US COMEX gold futures, where the premium has been reduced to a discount of around -$14 at this time of writing from +$72.28 printed on 4 February 2026.
A widening of the Shanghai gold premium suggests more physical demand that tends to spill over to a bullish run in Gold (XAU/USD), as seen in the recent ramp-up in its price actions in late January 2026 (see Fig. 1).
Let’s now look at the short-term technical chart of Gold (XAU) to decipher the near-term (1 to 3 days) trajectory
Short-term trend (1 to 3 days): Bullish exhaustion below $5,170
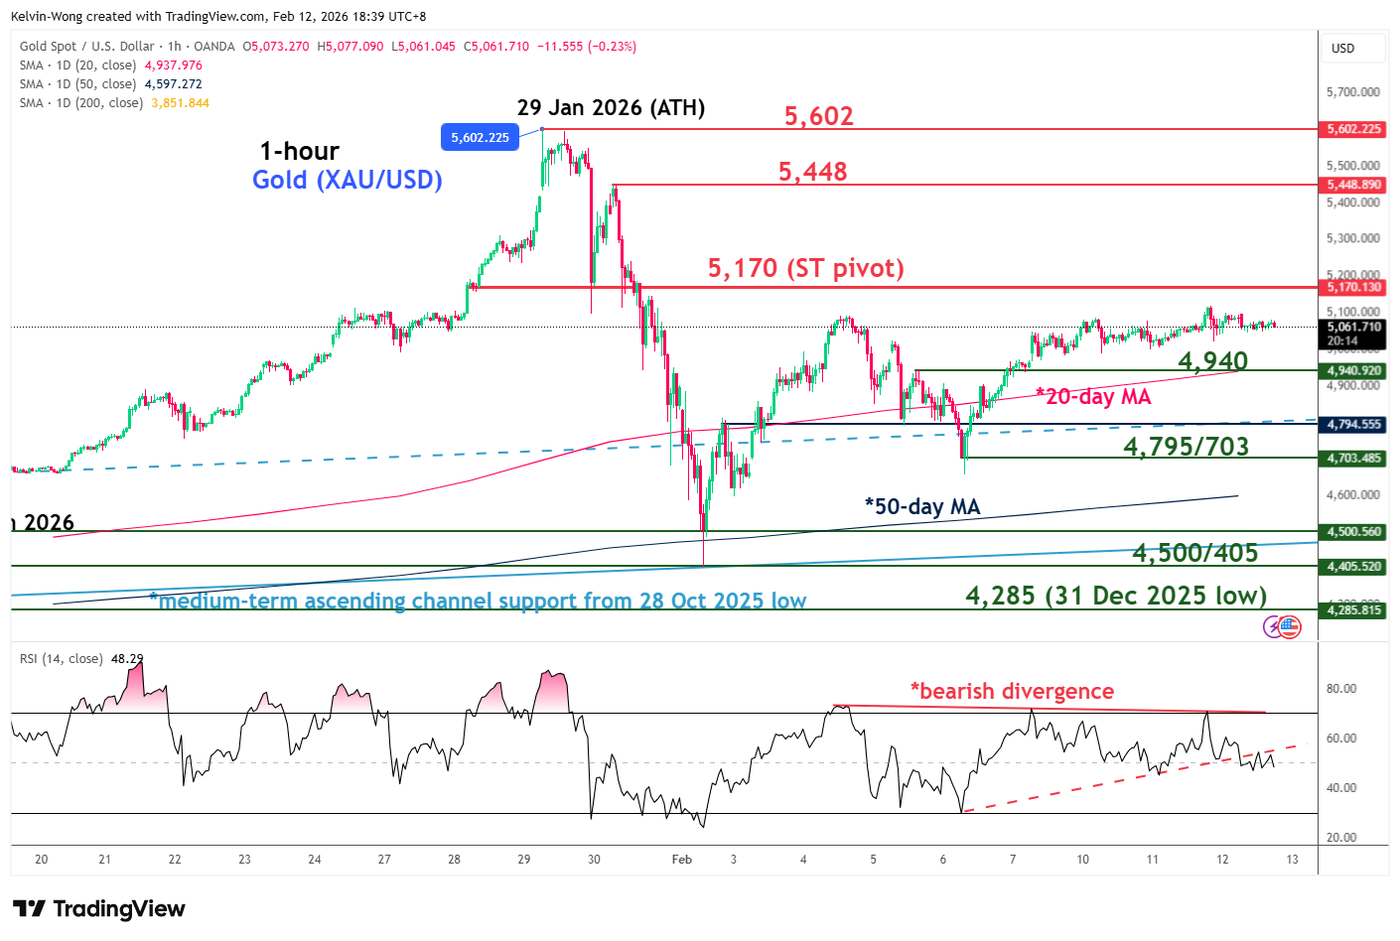
Watch the $5,170 key short-term pivotal resistance in Gold (XAU/USD), and a break below $4,940 (also the 20-day moving average) may trigger a drop back towards $4,795/4,703 and the recent $4,500/4,405 minor key swing low area of 2 February 2026.
However, a clearance above $5,170 invalidates the bearish tone for a squeeze up towards the next intermediate resistance at $5,448 (30 Jan 2026 minor swing high) and a possible retest on its current all-time high of $5,602 printed on 29 January 2026.
Key elements to support the short-term bearish bias
- Hourly RSI momentum has flashed out an early bearish divergence condition at its overbought region from 4 February 2026 to 11 February 2026.
- Thereafter, the hourly RSI momentum indicator staged a bearish breakdown below a key former ascending support on Thursday, 12 February 2026, at this time of writing.
Opinions are the authors’; not necessarily that of OANDA Business Information & Services, Inc. or any of its affiliates, subsidiaries, officers or directors. The provided publication is for informational and educational purposes only.
If you would like to reproduce or redistribute any of the content found on MarketPulse, an award winning forex, commodities and global indices analysis and news site service produced by OANDA Business Information & Services, Inc., please refer to the MarketPulse Terms of Use.
Visit https://www.marketpulse.com/ to find out more about the beat of the global markets.
© 2026 OANDA Business Information & Services Inc.