
- Stock Benchmarks give up their early gains as traders price out cuts after the strong Non-Farm Payrolls report
- Markets face yet another test of their recent highs, with the Dow Jones retesting the 50,000 handle
- Exploring Technical Levels for the Dow Jones, Nasdaq and S&P 500
Recent Non-Farm Payrolls have been tricky to trade, with the picture in the US labor market confirming a strengthening trend in the latest report this morning.
The tricky part, however, is that last week’s Jobless Claims, Challenger Layoffs, and ADP reports all corroborated a contradictory (weakening) view, which generally sends conflicting signals to the latest rounds of BLS data.
Since firing the head of the Bureau of Labor Statistics in August, reports haven’t looked weak; they’ve just been subject to significant revisions.
And despite the -858K downward revisions to last year’s data, as revealed this morning, Participants are now focusing on the hawkish impact of the Unemployment Rate (UE) easing back to 4.3%.
The UE Rate will now be at the forefront of what traders are watching to assess the state of the US Jobs market.
With the final piece of the US data puzzle, the CPI report (8:30 A.M.), which will be revealed this Friday, pricing for upcoming Fed Meetings will have significant potential for changes.
As a matter of fact, the June meeting odds went from close to 100% before the data to around 60% afterward.
The March meeting progressively corrected from 22% to only 9%, with the Yield curve bear flattening (indicating lower odds of imminent cuts).
Quite a turnaround, which won’t please Stock Markets, following a swift rebound from the past week’s tumbles.
Pre-open futures trading was strong after the NFP release, but quickly turned around shortly after the Bell.
Now back to unchanged on the session, Indexes are sending confusing signals to traders, but remain at key intersections that will be essential to monitor ahead of upcoming trading.
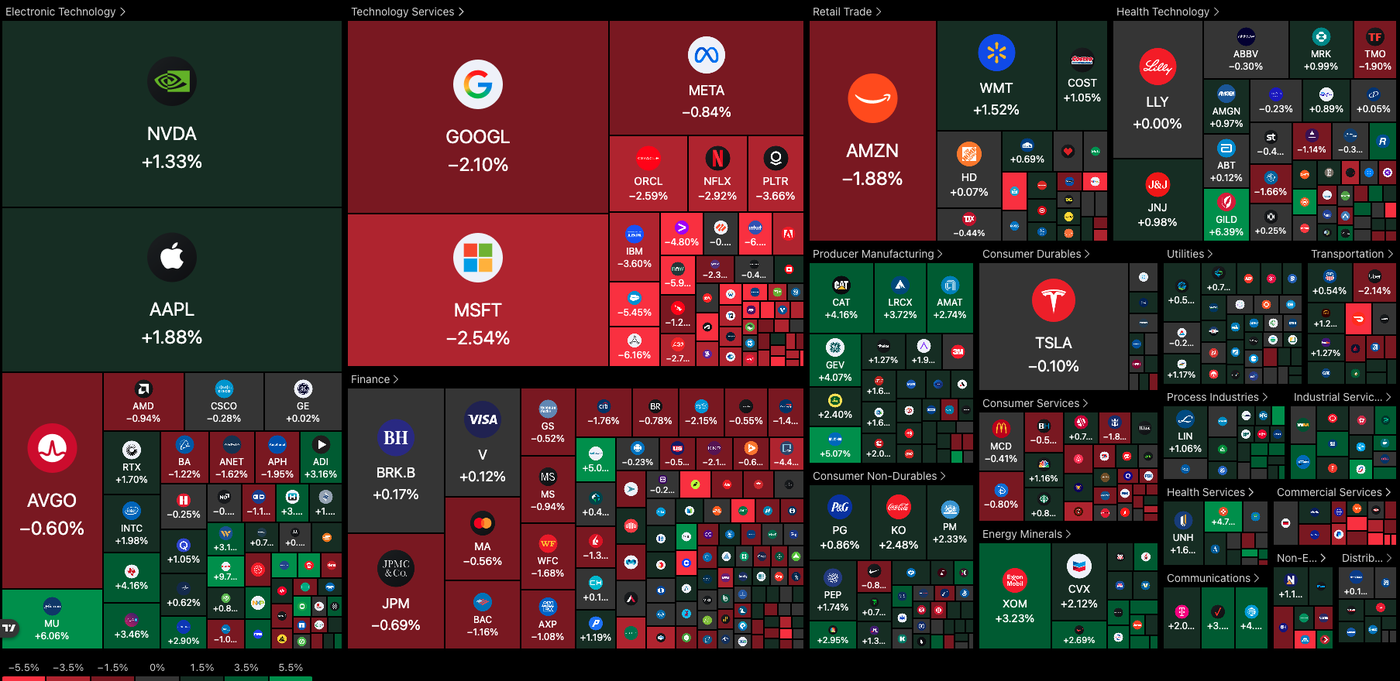
Defensive stocks remain of relative interest against Tech stocks in the daily heatmap, pulling flows towards Producer Manufacturing, Farming, and Energy stocks on top yet again.
Dive into today’s session charts and key trading levels for the major US indices: the Dow Jones, Nasdaq, and S&P 500.
Note: Iran developments remain one of the largest tail risk for volatility, hence as participants turn their attention away, keep a close eye on any breaking news.
Read More:
- NFP surprises to the upside – Market Reactions
- USD/JPY Outlook: Momentum bearish, but can the US dollar find support on strong jobs data?
- Markets Today: Markets digest Chinese inflation, AI fears continue, Gold holds high ground as NFP looms
Dow Jones 2H Chart and Trading Levels
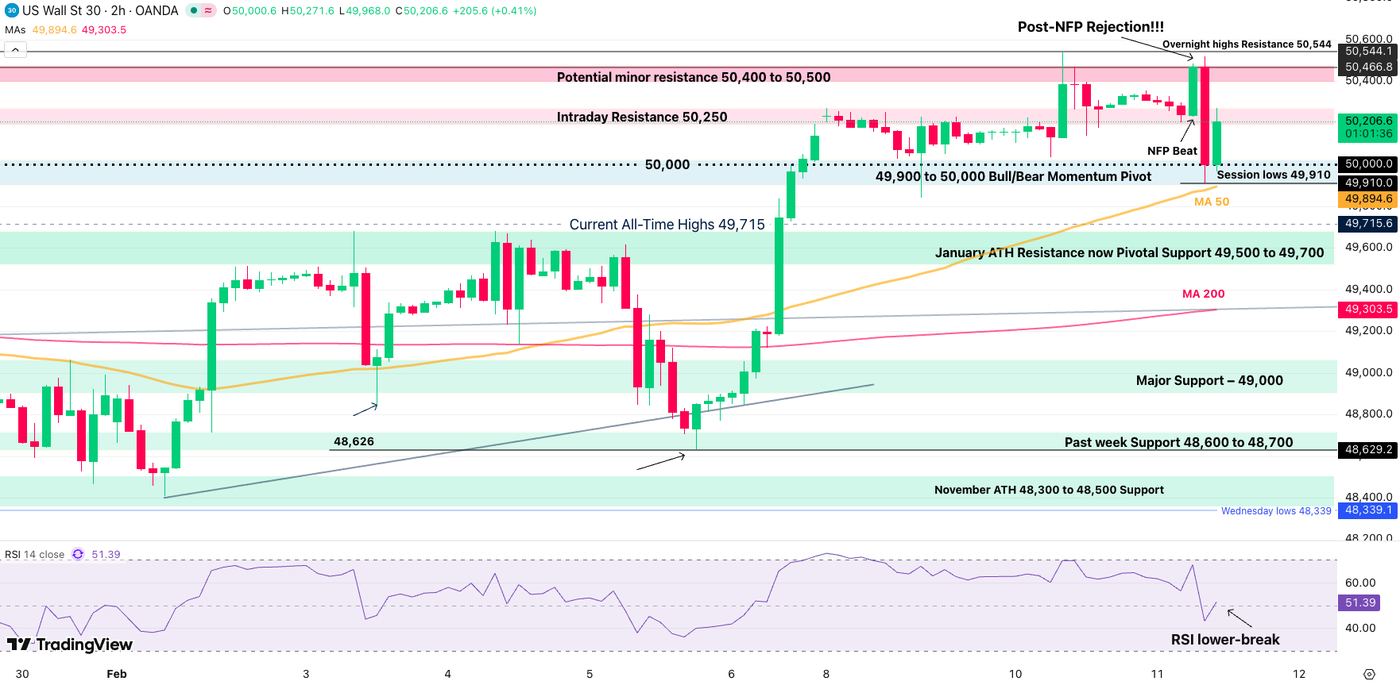
The Dow Jones is showing weakening signs after this morning’s fakeout higher.
Despite the rebound in the past hour and remaining above 50,000 (High-importance level), the selloff brought the action back below this session’s pivotal resistance (50,250).
Now showing an imminent break-retest price action, an interesting selling setup could make sense, particularly after the hawkish repricing which could be weighing on Stocks until Friday’s CPI.
In the event of a selloff, look for reactions at the 49,500 pivotal support. Any break below will take the Index back to its 48,000 to 50,000 range.
Dow Jones technical levels for trading:
Resistance Levels
- Intraday Resistance 50,250 (rejecting)
- Potential minor resistance 50,400 to 50,500
- Index All-Time highs 50,512
Support Levels
- 49,900 to 50,000 Bull/bear Momentum Pivot
- January ATH Resistance now Pivotal Support 49,500 to 49,700
- Major Support – 49,000
- Past week Support 48,600 to 48,700
- Key Support around 47,500
- 45,000 psychological level (Main Support on higher timeframe)
Nasdaq 2H Chart and Trading Levels
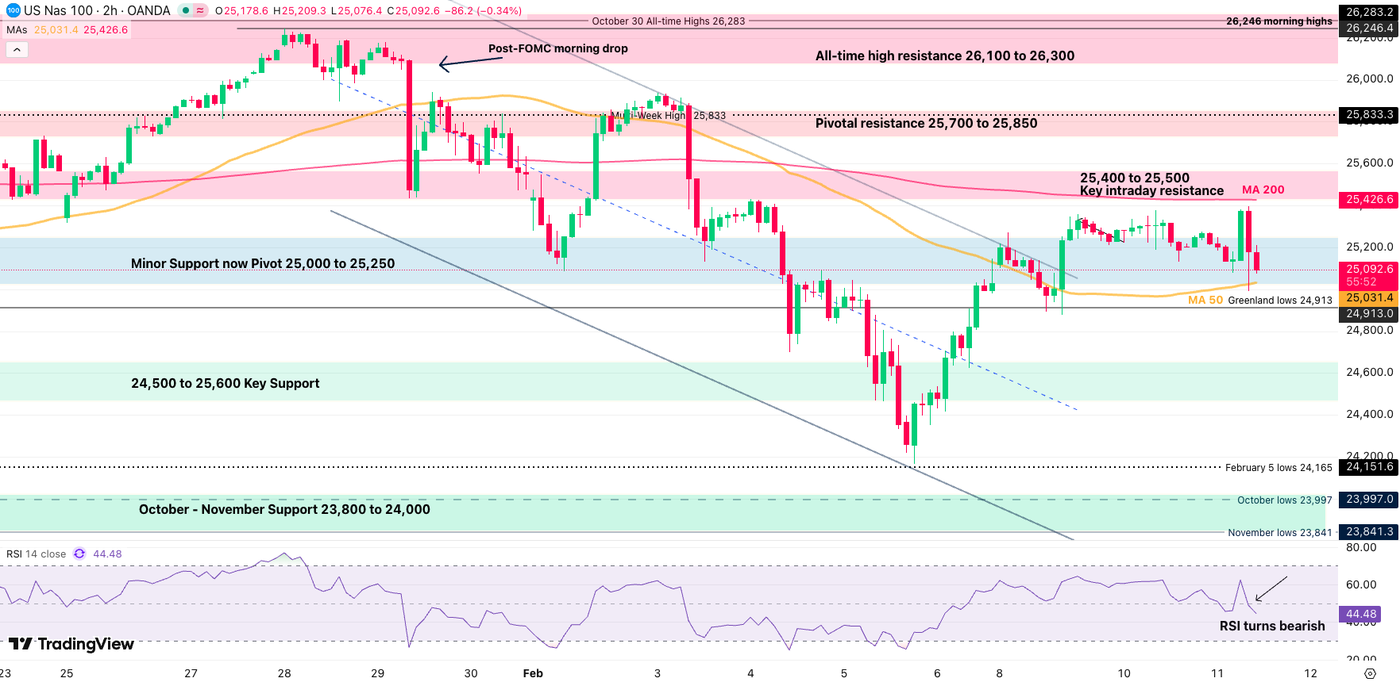
Nasdaq is also sending worrying signs ahead by failing to breach its Key 25,500 Resistance, with sellers leaning on the 2H 200-MA.
Traders will need to watch closely to the 25,000 Psychological level. Moving back below confirms a more bearish price action ahead of CPI.
Bouncing on the level however hints at a 25,000 to 25,500 tight consolidation.
Nasdaq technical levels of interest:
Resistance Levels
- 25,400 to 25,500 Key intraday resistance (2H 200 MA)
- Pivotal Resistance 25,700 to 25,850
- 26,246 FOMC highs
- All-time high resistance zone 26,100 to 26,300
Support Levels
- Minor Support now Pivot 25,000 Key test (50 MA at 25,090 watch if breakj)
- 24,500 to 25,600 Key Support
- February 5 lows 24,165
- October – November Support 23,800 to 24,000
- Early 2025 ATH at 22,000 to 22,229 Support
S&P 500 2H Chart and Trading Levels
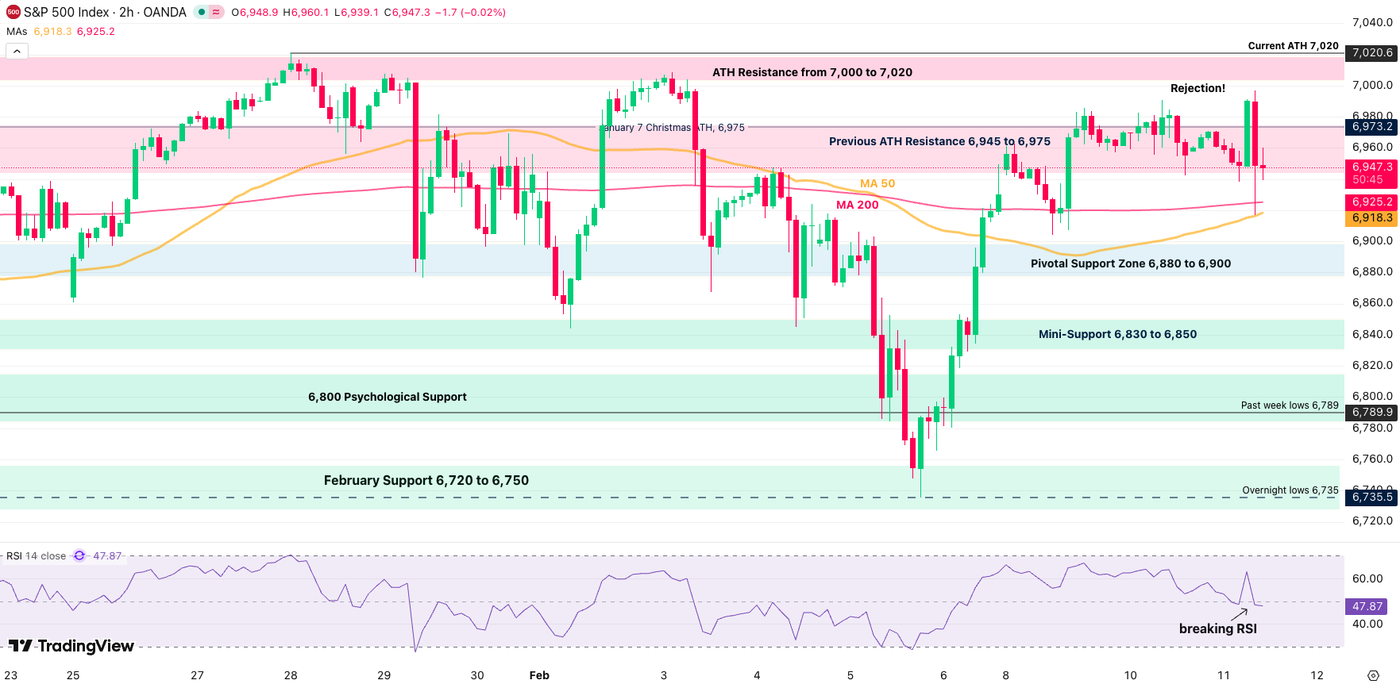
Despite bouncing on its 50 and 200-Moving averages, the price action is showing meaningful rejection of the 7,000 key figure.
The key MAs will act as final support for the bull case towards new all-time highs.
Any breach of the 6,916 session lows should see continuation towards a retest of the 6,800 range support.
S&P 500 technical levels of interest:
Resistance Levels
- Previous ATH Resistance 6,945 to 6,975 (Rejecting)
- Session top 6,996
- Current ATH 7,020
- All-time High Resistance 7,000 to 7,020 (range highs)
Support Levels
- 6,920 Session lows and 2H MA 50/200 (key barometer)
- Pivotal Support Zone 6,880 to 6,900
- Mini-Support 6,830 to 6,850
- 6,800 Psychological Support
- Overnight lows 6,735 (range lows)
- 6,400 Major psychological support
Safe Trades and keep a close eye on the US-Iran developments!
Follow Elior on Twitter/X for Additional Market News, interactions and Insights @EliorManier
Opinions are the authors’; not necessarily that of OANDA Business Information & Services, Inc. or any of its affiliates, subsidiaries, officers or directors. The provided publication is for informational and educational purposes only.
If you would like to reproduce or redistribute any of the content found on MarketPulse, an award winning forex, commodities and global indices analysis and news site service produced by OANDA Business Information & Services, Inc., please refer to the MarketPulse Terms of Use.
Visit https://www.marketpulse.com/ to find out more about the beat of the global markets.
© 2026 OANDA Business Information & Services Inc.