
- European shares, including the STOXX 600, extended their recovery for a third day, driven by easing oil prices and stronger overall market sentiment
- Oil prices (Brent and WTI) retreated due to the restart of crude exports from Iraq’s Kirkuk fields and a much larger-than-expected rise in US crude stocks.
- Focus shifts to the upcoming FOMC meeting, where a “hawkish hold” is expected, with a strong possibility of adjusting the “Dot Plot” to show zero rate cuts for 2026.
Most Read: FOMC Meeting Preview: A ‘hawkish hold’ as geopolitical risk & stagflation fears rise, implications for the DXY & Dow Jones
European shares extend recovery for a third day
European stock markets continued to climb on Wednesday. Investors were feeling more optimistic as oil prices dropped, due to easing supply concerns.
This in turn aided overall sentiment and thus gave risk assets a boost coupled with a bullish outlook by NVIDIA.
Market Highlights
STOXX 600: This main European index rose 0.5% to 605.59 points. This marks the third day in a row the index has gone up, which is its best performance in a month.
Energy vs. Finance: The .SXEP (Energy) sector fell 0.3%, ending an eight-day winning streak because of lower oil prices. On the flip side, .SX7P (Financial) stocks were the biggest reason the overall market stayed positive.
Global Context: Markets around the world are recovering because oil prices stopped rising, despite the growing tension between Israel and Iran.
This follows on from a strong Asian session where Japan’s stock market saw a strong recovery as the Nikkei climbed 2.87% to reach 55,239.4, effectively ending a four-day period of losses.
Similarly, the Topix, which tracks a broader range of companies, rose 2.49% to finish at 3,717.41.
How did FX markets react?
The US dollar weakened for the third day in a row. The dollar index, which compares the US currency against six other major ones, dropped 0.04% to 99.51.
In response, several other global currencies gained value: the euro rose to $1.1543, while the Japanese yen strengthened to 158.64 per dollar.
Sterling also saw a small increase to $1.3368.
In the Oceania region, both the Australian dollar and the New Zealand dollar moved higher, reaching $0.7117 and $0.5868, respectively.
The cryptocurrency market showed mixed results, as bitcoin BTC/USD fell 0.50% to $74,184.63, while Ethereum ETH/USD managed a slight gain of 0.04% to reach $2,329.46.
Currency Strength Chart
Commodities & Energy
Gold prices remained mostly stable on Wednesday as investors cautiously watched the Middle East conflict while waiting for the US Federal Reserve’s latest policy update.
Spot gold and US gold futures both saw slight increases of 0.1%, reaching $5,008.58 and $5,012.60 respectively.
While the ongoing Iran conflict has kept Brent futures above $100 for several days, prices finally retreated on Wednesday, dropping 1.46% to $101.91.
Similarly, US West Texas Intermediate crude fell 2.86% to $93.46.
This dip in oil prices was largely driven by the restart of crude exports from Iraq’s Kirkuk fields to Turkey, following an agreement between Baghdad and the Kurdistan Regional Government.
This provided some relief to a market worried about supply shortages, especially since Iraq aims to pump at least 100,000 barrels per day through the pipeline.
Additionally, data from the API suggested a significant rise in US crude stocks by over 6.5 million barrels, a much larger increase than the 380,000 barrels predicted by a recent Reuters poll.
Read More:
Technical levels for major FX pairs ahead of the FOMC
USD/JPY Conundrum: Intervention risk looms as central banks meet (Fed-BoJ double-header)
Weekly Gold (XAU/USD) Forecast: 3% slide to $5000/oz as rate cut bets tumble, FOMC up next
Economic Data Releases and Final Thoughts
It is a quiet day on the European calendar with the final release of the Euro Area CPI the highlight. Barring any surprise from the print it should be a quiet session with eyes turning to the US session.
US PPI data will kick things off following the Bank of Canada rate decisions where markets are expecting the BoC to hold rates firm.
The Federal Reserve meeting will then be the focus where the FED is expected to keep interest rates steady, but there is a strong possibility they will adjust their “Dot Plot” projections to show no rate cuts for 2026.
If the median forecast shifts from one cut to zero, the US dollar will likely see a boost.
Conversely, the market might still hope for a rate cut if the Fed’s statement highlights “downside risks” regarding the job market.
Chair Powell is unlikely to give firm guidance on how the Middle East conflict affects inflation and growth, as commodity markets remain too volatile. While the dollar may see a brief rally following the Fed’s new projections, its value will likely stay tied to fluctuating oil prices and geopolitical news.
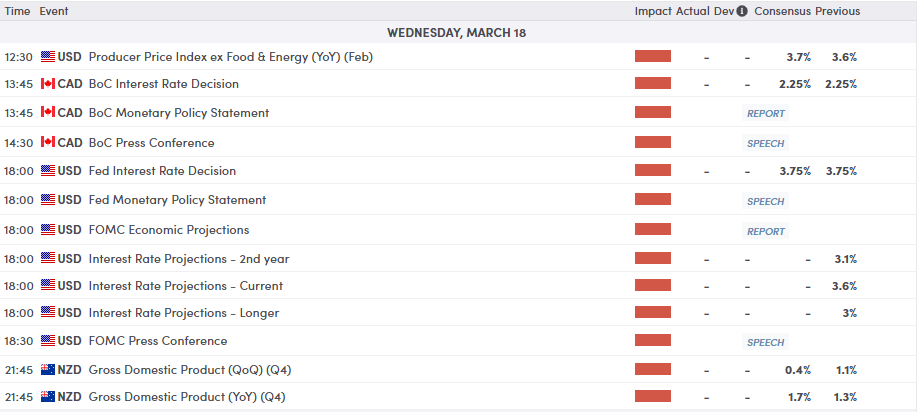
Chart of the Day – FTSE 100
From a technical perspective, the FTSE 100 index is currently locked in a consolidation phase, attempting to establish a viable floor.
We are on course for a third day of gains but price needs to break above the 200-day MA at 10476 to convince bulls that the consolidation may be over.
The index is trading in a tight range centered around 10269-10476 area as buyers and sellers battle for control.
Immediate Resistance: The first hurdle for bulls sits at 10,476, which aligns with the 200-period Simple Moving Average (yellow line). A break above this would target the psychological 10536 level (dark blue line), which formerly acted as support and has now flipped to resistance.
Key Support: On the downside, the 10350 level is the immediate line in the sand. Should this fail, the recent swing low at 10,101 represents the final major support before the psychological 10,000 mark comes into play.
The technical “death cross” or bearish alignment of the moving averages suggests that the path of least resistance remains tilted to the downside.
The Relative Strength Index (RSI) period-14 is finally above the 50 handle which does hint at some bullish momentum.
The lack of a clear divergence suggests that while the aggressive selling has paused, there is currently no strong conviction for a sustained breakout.
FTSE 100 Index Four-Hour Chart, March 18, 2026

Follow Zain on Twitter/X for Additional Market News and Insights @zvawda
Opinions are the authors’; not necessarily that of OANDA Business Information & Services, Inc. or any of its affiliates, subsidiaries, officers or directors. The provided publication is for informational and educational purposes only.
If you would like to reproduce or redistribute any of the content found on MarketPulse, an award winning forex, commodities and global indices analysis and news site service produced by OANDA Business Information & Services, Inc., please refer to the MarketPulse Terms of Use.
Visit https://www.marketpulse.com/ to find out more about the beat of the global markets.
© 2026 OANDA Business Information & Services Inc.