
- US Stock Benchmarks are now bouncing much higher as Oil retreats
- Participants are reacting positively to the few ships that successfully crossed the Strait of Hormuz
- Exploring Technical Levels for the Dow Jones, Nasdaq and S&P 500
We are now entering the third week of the US-Iran-Israel conflict that has seen thousands of missile and drone attacks all around the Middle East, and sentiment is now seemingly easing.
To learn more about the conflict’s progression, I invite you to check out this piece.
Market Participants woke up to smoother price action in Crude Oil as weekend risk hedges unwound, and the situation hasn’t worsened since.
Flows in Financial Markets tend to move heavily on the repricing of expectations – so when uncertainty sets in, it tends to come with a nastier appetite for risk.
This is precisely what led to Friday’s risk-off session, pointing back to today’s test of confidence – but even with the ongoing storm, uncertainty clouds are somewhat clearing.
Major US Indexes are all up around 1%, which adds to the pre-existing inverse correlation with Oil prices – a trend that today is a boon for Wall Street.
The reason for such a rebound was the successful crossing not only for two Indian LNG tankers (against the return of 183 Iranian sailors), but more particularly from the successful crossing of a first tanker in provenance from Abu Dhabi through the Strait of Hormuz.
Its route was kind of peculiar, particularly as mines have apparently been placed throughout the Strait.
Oil eased from its $102 gap higher at the Globex open to $93.50 lows but has rebounded in the last hour.
It will be a bumpy ride for risk-appetite, as the short-term rebound in WTI coincides with a swift correction in the Market-open buying flows.
Today, as the rest of this week, will act as a test of confidence for Stock Markets and Energy Commodities – Will disruptions continue or has uncertainty reached a climax?
Let’s spot where today’s hesitant price action is implying by diving into today’s mid-session charts and key trading levels for the major US indexes: the Dow Jones, Nasdaq, and S&P 500.
Read More:
- The Financial Damage of War – Markets Weekly Outlook
- Chart alert: WTI crude oil rally almost reached $102.25, risk of minor setback towards $88.36
- Markets Today: Chinese data positive as Middle East conflict remains tense. Oil steady, FTSE 100 consolidate. Canada CPI up next
- RBA Preview: Why a 25bps hike to 4.1% is the most likely outcome
Current Session’s Stock Heatmap
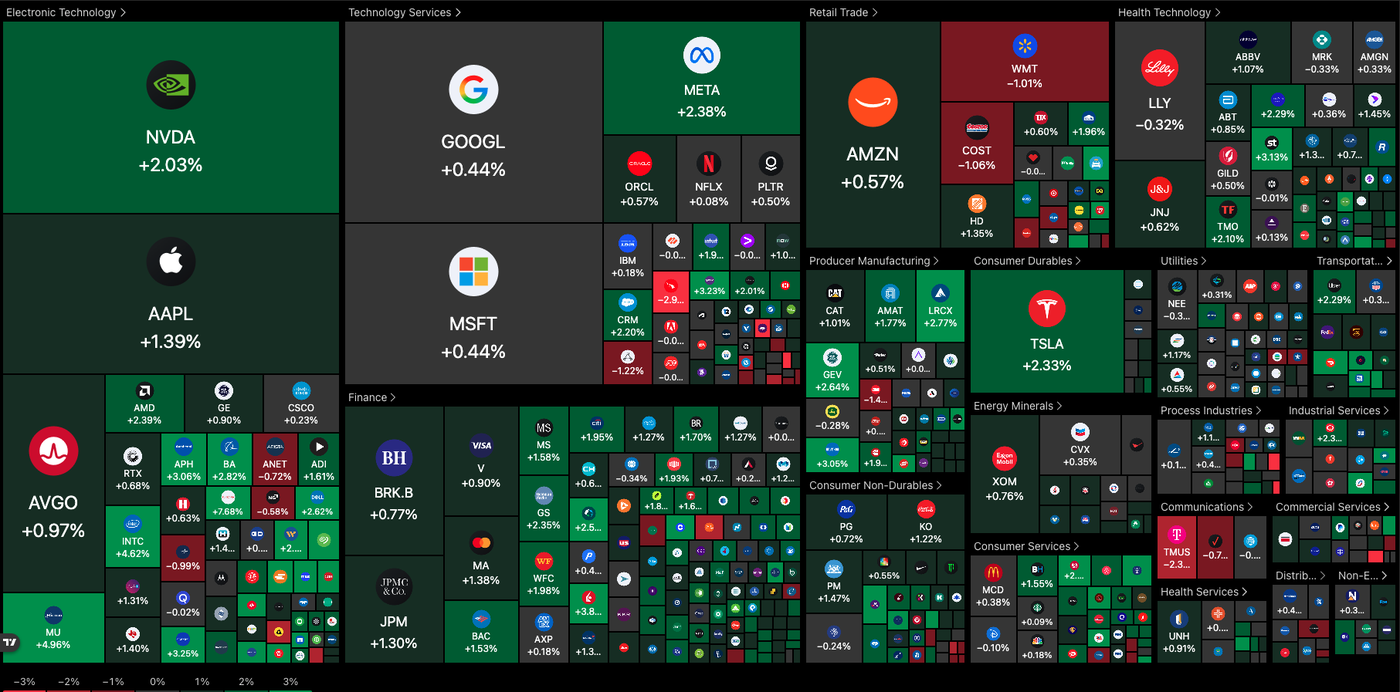
The current market heatmap is showing a more positive picture, with timid but consistent rebound across all sectors (except for struggling Telecoms).
Electronic technology and transportations are leading to the upside – Tech and Finance remain the two most interesting sectors to watch in recent trading.
Dow Jones 2H Chart and Trading Levels
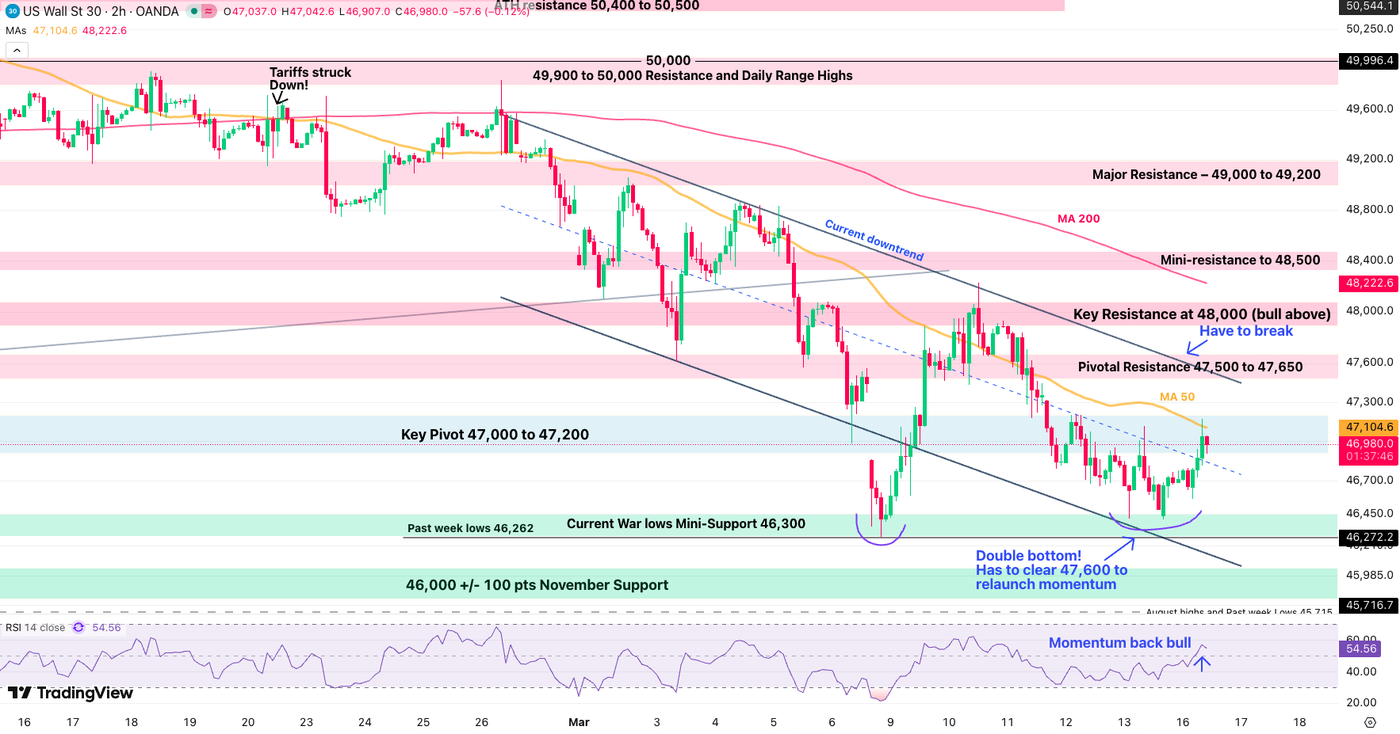
The DJIA has now formed a Double Bottom at its War lows, a positive sign for dip-buyers.
Since, the short-term outlook is now bullish, but the mid-term outlook can only rebound if bulls manage to push above 47,600 – The current outlook is one of cautious recovery.
Dow Jones technical levels for trading:
Resistance Levels
- 2H 50-period MA 47,105 (immediate test)
- Key Pivot 47,000 to 47,200
- Pivotal Resistance 47,500 to 47,650
- Key Resistance at 48,000 (bull above)
- 48,400 to 48,500 mini-resistance
Support Levels
- Current War lows Mini-Support 46,300 and Double Bottom
- 46,000 +/- 100 pts November Support
- August highs 45,715
- 45,000 psychological level (Main Support on higher timeframe)
Nasdaq 2H Chart and Trading Levels
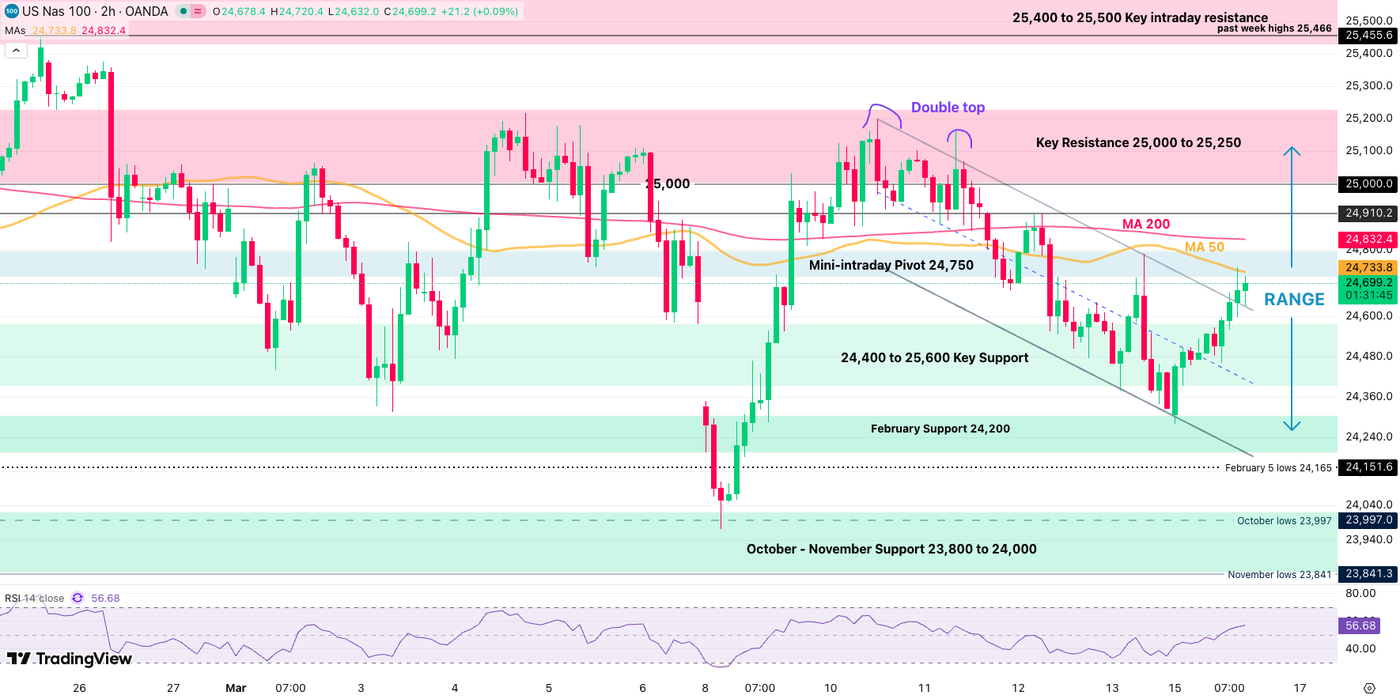
Nasdaq is once again showing how strong its 24,000 to 25,000 range is holding.
More particularly, after reaching its 24,250 support, bulls have formed a tight bull channel.
This points to a test of the 25,000 range resistance; however the action will have to extend beyond the 2H 50-period MA (24,734).
Nasdaq technical levels of interest:
Resistance Levels
- 2H 50-period MA (24,734) & Mini-intraday Pivot 24,750
- Key Resistance 25,000 to 25,200 (mini range highs)
- 25,400 to 25,500 Key intraday resistance
- Pivotal resistance 25,700 to 25,850 (all-time highs if break)
Support Levels
- February Support 24,200 (War lows)
- 24,400 to 25,600 Key Support
- October and Overnight lows 23,972
- October – November Support 23,800 to 24,000 (Monday drop)
- Early 2025 ATH at 22,000 to 22,229 Support
S&P 500 2H Chart and Trading Levels
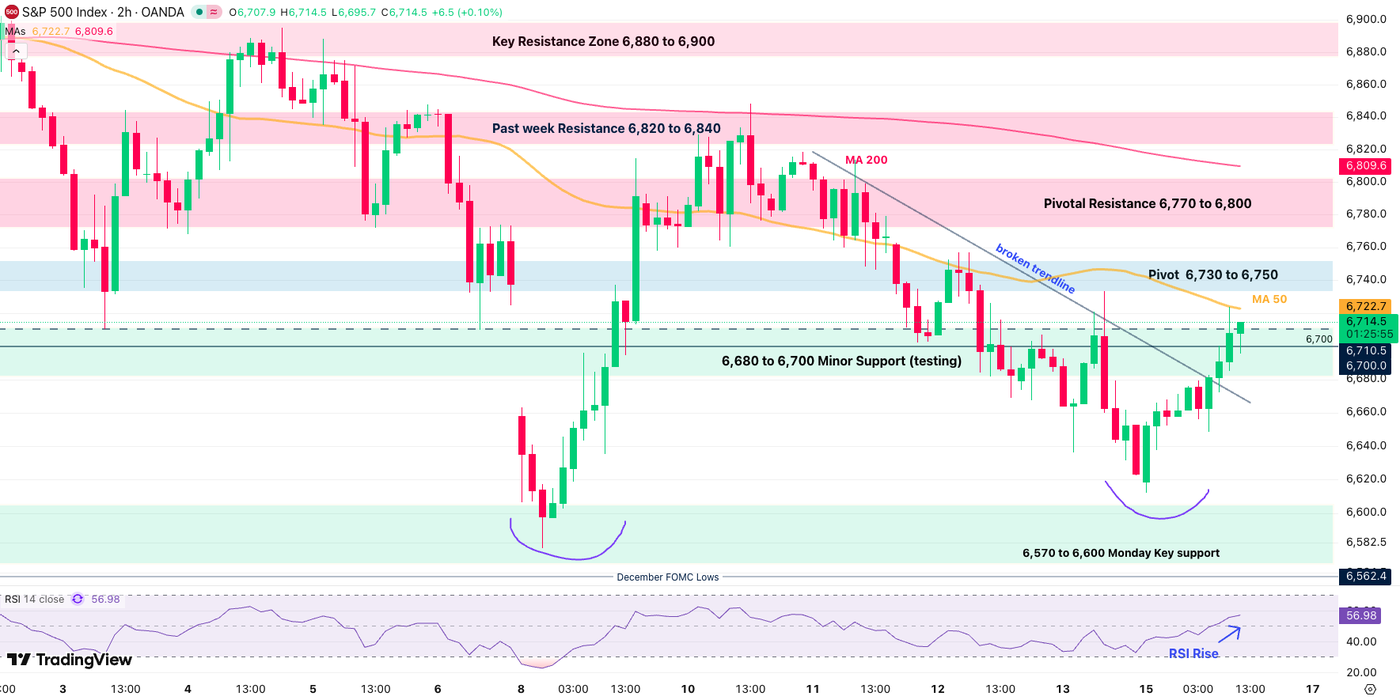
The S&P 500 is following very similar technical patterns in this Weekly open, forming a tight bull channel and testing its 2H 50-period MA (6,722).
Breaking a closing above would relaunch hopes for a test of the 6,800 Pivotal Resistance.
S&P 500 technical levels of interest:
Resistance Levels
- 2H 50-period MA (6,722) – Immediate test
- Pivot 6,730 to 6,750
- Pivotal Resistance 6,770 to 6,800
- Past Week Resistance 6,820 to 6,840
Support Levels
- 6,680 to 6,700 Key Support (testing)
- Overnight lows 6,606
- 6,490 to 6,512 October lows Immediate Support
- 6,400 Major psychological support
Safe Trades and keep a close eye on the US-Iran developments!
Follow Elior on Twitter/X for Additional Market News, interactions and Insights @EliorManier
Opinions are the authors’; not necessarily that of OANDA Business Information & Services, Inc. or any of its affiliates, subsidiaries, officers or directors. The provided publication is for informational and educational purposes only.
If you would like to reproduce or redistribute any of the content found on MarketPulse, an award winning forex, commodities and global indices analysis and news site service produced by OANDA Business Information & Services, Inc., please refer to the MarketPulse Terms of Use.
Visit https://www.marketpulse.com/ to find out more about the beat of the global markets.
© 2026 OANDA Business Information & Services Inc.