
- US Stock Benchmarks get rejected roughly after a toxic fundamental combo
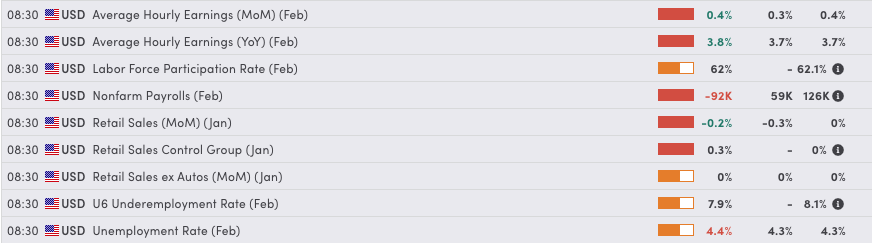
- Gigantic misses in Non-Farm payrolls and Retails Sales combine with rising Oil prices towards Stagflation angst
- Exploring Technical Levels for the Dow Jones, Nasdaq and S&P 500
Stagflation is the Market and Consumers’ worst enemy, and it could well be at our doors.
Amid ongoing chaos in the Middle East and continued de facto closure of the Strait of Hormuz, Oil prices have exploded to 2023 highs throughout the morning action.
As you can see on the chart below, rises in the Commodity’s price aren’t well received by investors. The reason is that higher Energy prices often correlate with squeezed profit margins due to higher transportation and production costs.
Since the 1970s, our reliance on Oil for power production has been trending lower.
However, we are still far from being isolated to rises in its costs – Hence, such brutal rises in energy commodities are often accompanied by swift climbs in inflation expectations.
This also becomes a nasty head-scratcher for the Federal Reserve, which surely did not enjoy the recent CPI and PPI rises, which can only confirm what Participants fear the most.
Stagflation had been avoided since the end of COVID restrictions, but it remained a cloud over our economies, and the storm could be approaching.
Combine the 148K miss (!!!) on NFP with yet another slip on Retail Sales data, and investors can now officially be scared for what’s to come – And the Atlanta Fed’s GDPNow confirms this, falling from 3.2% to 2.1%!
Still, Equity investors have found some kind of relief since the London Fix, as Rate cut expectations for the April 29 Rate Decisions have slowly crept up from 10% yesterday to the current 22%.
The Mood remains fragile, and we’ll see more details in the charts, but it resembles short-covering rather than a proper rebound.
Let’s spot if this move has the potential to last by diving into today’s mid-session charts and key trading levels for the major US indexes: the Dow Jones, Nasdaq, and S&P 500.
Read More:
- Large NFP miss and Oil surge to $90 – A Stagflation cocktail ahead of weekend risk
- Chart alert: Gold (XAU/USD) is down 3% for the week, but bulls may make a comeback
- Markets Today: Rate cut hopes wither as Nikkei and Kospi suffer steep weekly losses. NFP data up next
Current Session’s Stock Heatmap
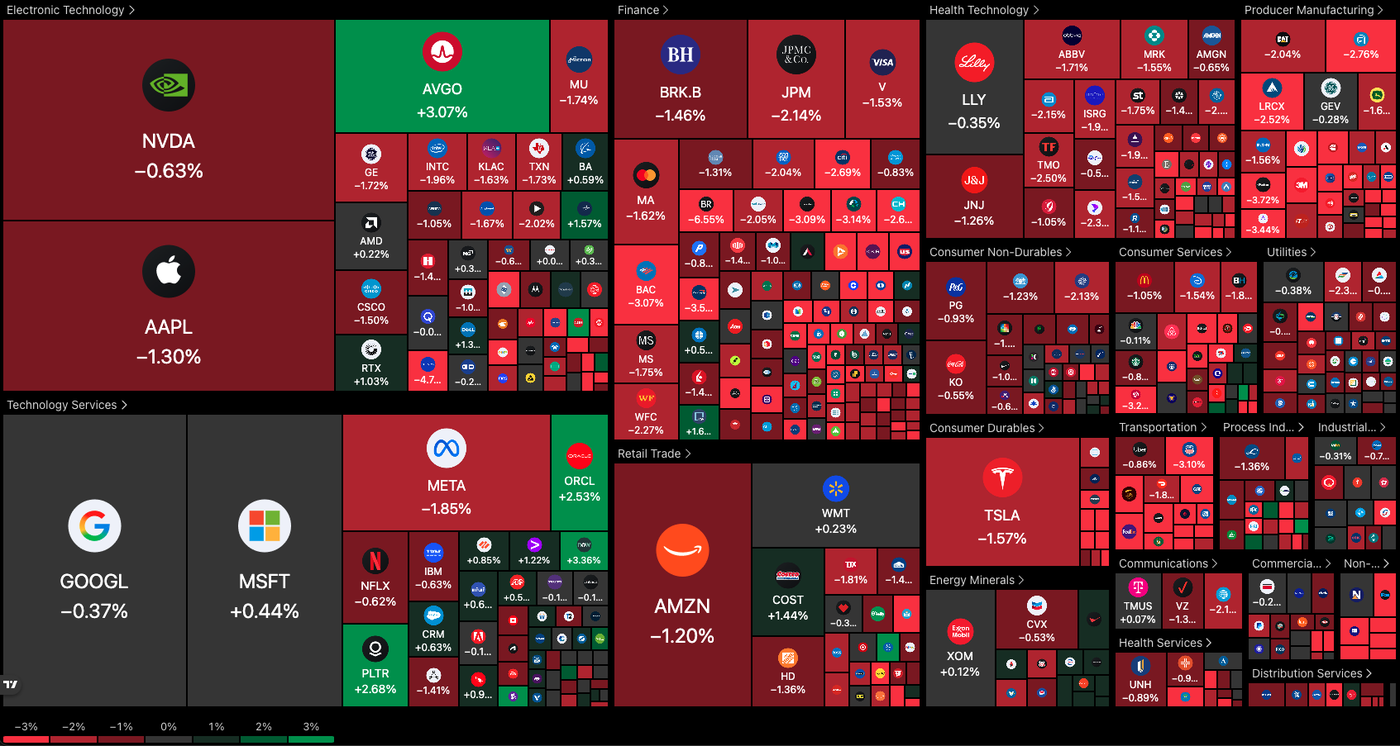
Once again, the Market rejects almost all but Tech equities – The latters are bouncing up again from their struggles as they are getting priced to be the least influenced by rises in Petroleum prices, without counting their heavy use within this ongoing Modern warfare.
It is also a rebalancing play unfolding, with the sector having already taken a beating since October while defensives and Manufacturing endured – A reason why Nasdaq has been withholding the correction better than its peers.
Dow Jones 4H Chart and Trading Levels
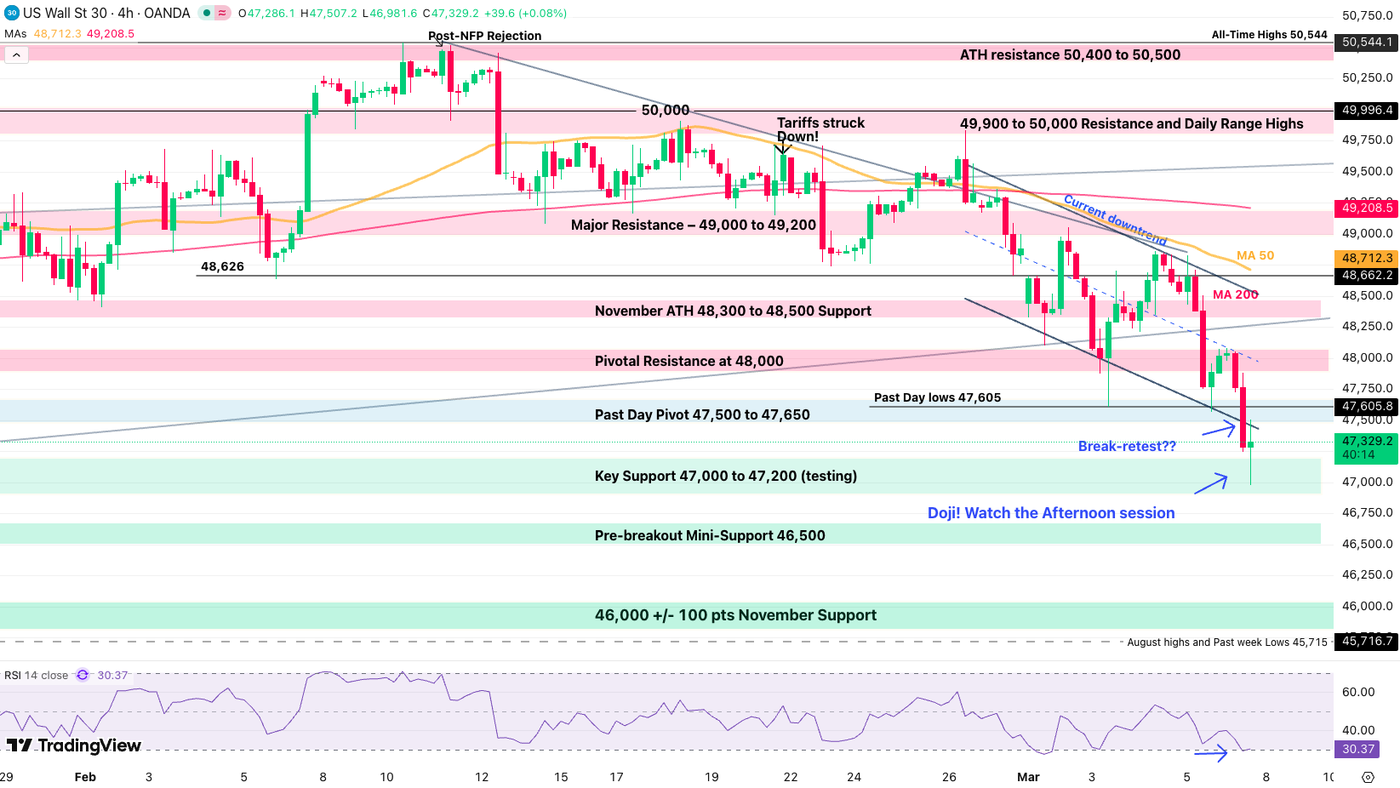
The Dow is subject to the most aggressive selling out of the three major US Indexes – Still down -1.30% despite the late-morning rebound.
Having crossed below its downward channel, bears are now well in control and the action is now testing a quintessential 47,000 Support.
With a 4H doji forming, two scenarios are ahead:
- A break below the 46,981 morning lows with heavy volume should see downward continuation, 46,500 is the next short-term target.
- Rebounding above the 47,507 morning highs with a 30M candle close above the level would point to a retest of the 48,000 Resistance.
Dow Jones technical levels for trading:
Resistance Levels
- Past Day Pivot 47,500 to 47,650
- Pivotal Resistance at 48,000
- November ATH 48,300 to 48,500 Support and Channel highs
- Index All-Time highs 50,512
Support Levels
- Key Support 47,000 to 47,200 (Morning lows, bearish below)
- Pre-breakout Mini-Support 46,500
- 46,000 +/- 100 pts November Support
- 45,000 psychological level (Main Support on higher timeframe)
Nasdaq 4H Chart and Trading Levels
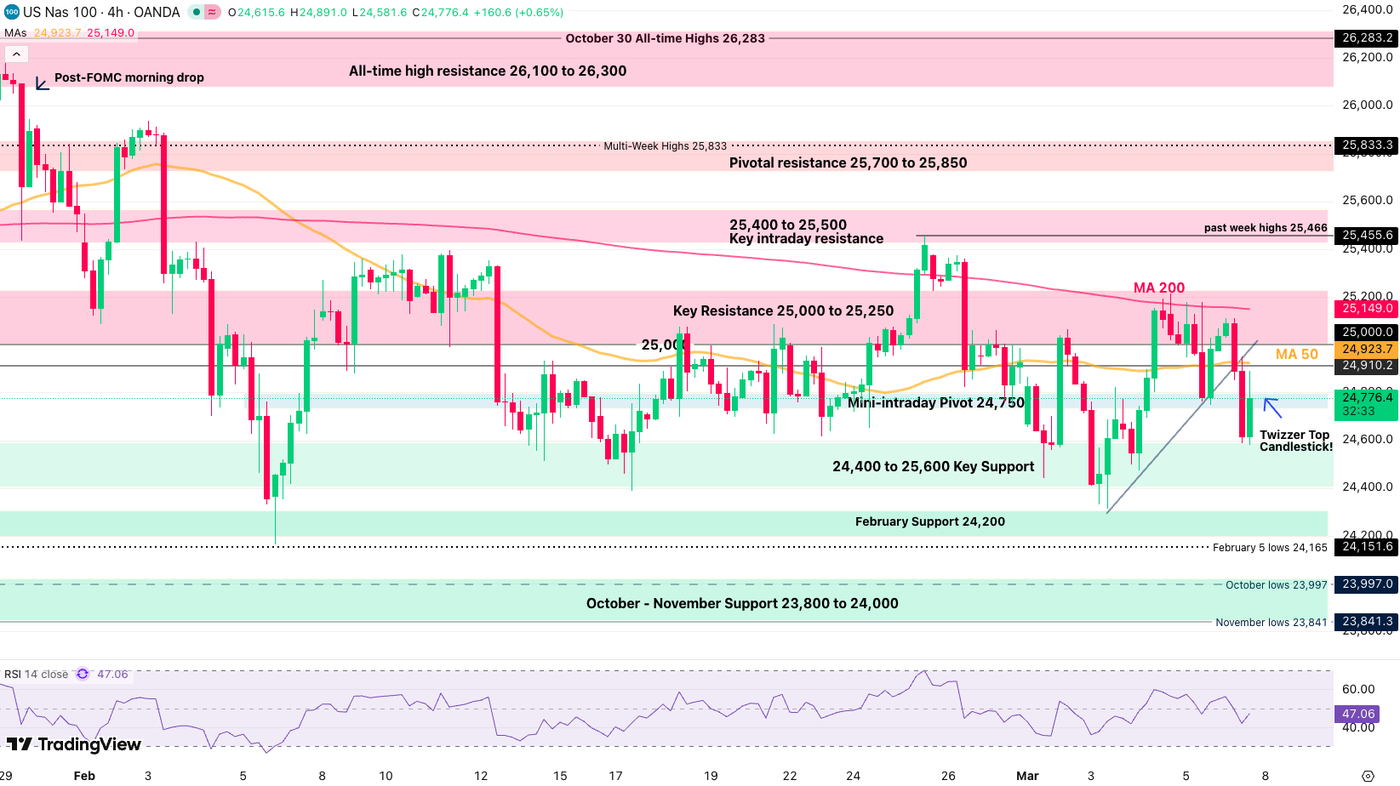
Nasdaq is resisting the bearish flows seen in the Dow with tenacity – But the battle is not over yet for Bulls!
A tweezer top bearish Candlestick formation could be turning the morning rebound into a more decidedly bearish action towards the weekend.
Breaking below 24,400 would point to a range failure and further downside.
- However, if tech remains resilient against others, Nasdaq could well remain within its 24,400 to 25,000 range – contingent on the general Market anxiety not worsening.
Nasdaq technical levels of interest:
Resistance Levels
- Mini-intraday Pivot 24,750
- 4H 50-period MA 24,923
- Key Resistance 25,000 to 25,170 (mini range highs)
- 25,400 to 25,500 Key intraday resistance
Support Levels
- 24,400 to 25,600 Key Support
- February Support 24,150 to 24,300
- October – November Support 23,800 to 24,000 (next target if break)
- Early 2025 ATH at 22,000 to 22,229 Support
S&P 500 4H Chart and Trading Levels
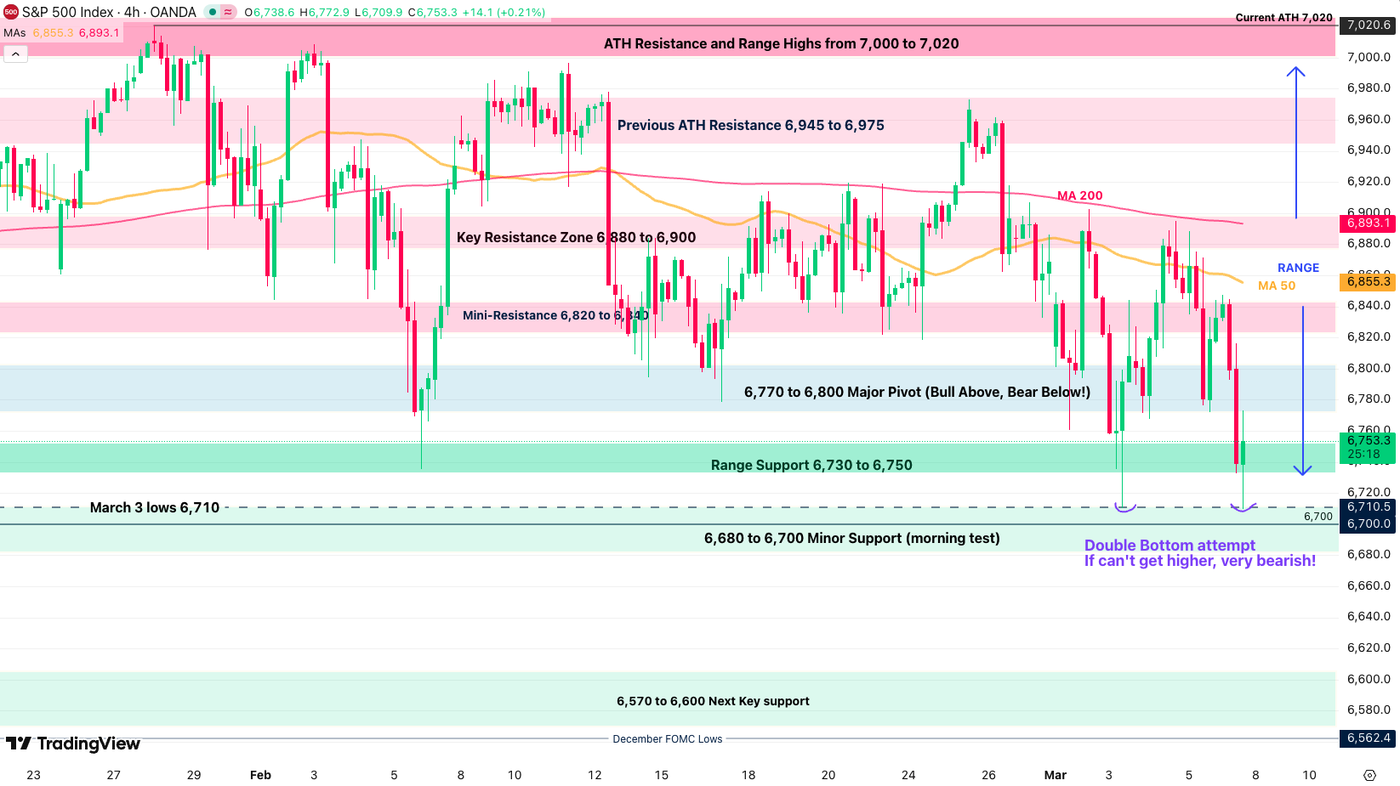
The S&P 500 is now testing the extreme lower bound of its 6-month consolidation and facing a reality check ahead.
- Breaking the 6,700 Double Bottom would be a nail in the coffin for the Major Index.
- However, bulls will hope to see continuation from the resilient price action this morning.
The afternoon Session will be absolutely essential for future price action. Monday’s Open will have the same effect!
S&P 500 technical levels of interest:
Resistance Levels
- Key Resistance Zone 6,880 to 6,900 (testing)
- Previous ATH Resistance 6,945 to 6,975
- Current ATH 7,020
- All-time High Resistance 7,000 to 7,020 (range highs)
Support Levels
- Mini-Pivot 6,820 to 6,840
- 6,770 to 6,800 Psychological Support
- Previous day lows 6,710
- February lows 6,710 to 6,730
- 6,680 to 6,700 Next Support
- 6,400 Major psychological support
Safe Trades and keep a close eye on the US-Iran developments!
Follow Elior on Twitter/X for Additional Market News, interactions and Insights @EliorManier
Opinions are the authors’; not necessarily that of OANDA Business Information & Services, Inc. or any of its affiliates, subsidiaries, officers or directors. The provided publication is for informational and educational purposes only.
If you would like to reproduce or redistribute any of the content found on MarketPulse, an award winning forex, commodities and global indices analysis and news site service produced by OANDA Business Information & Services, Inc., please refer to the MarketPulse Terms of Use.
Visit https://www.marketpulse.com/ to find out more about the beat of the global markets.
© 2026 OANDA Business Information & Services Inc.