The People’s Bank of China (PBOC) said on Thursday that they “will cut interest rates and Reserve Requirement Ratio (RRR) at a proper time.”
Additional takeaways
Will keep liquidity ample.
Will guide social financing cost to lower.
Will strenghthen expectation guidance, maintain yuan exchange rate basically stable at a reasonable and balanced level.
Market reaction
At the time of writing, AUD/USD is down 0.55% on the day, trading at 0.6285.
PBOC FAQs
The primary monetary policy objectives of the People’s Bank of China (PBoC) are to safeguard price stability, including exchange rate stability, and promote economic growth. China’s central bank also aims to implement financial reforms, such as opening and developing the financial market.
The PBoC is owned by the state of the People’s Republic of China (PRC), so it is not considered an autonomous institution. The Chinese Communist Party (CCP) Committee Secretary, nominated by the Chairman of the State Council, has a key influence on the PBoC’s management and direction, not the governor. However, Mr. Pan Gongsheng currently holds both of these posts.
Unlike the Western economies, the PBoC uses a broader set of monetary policy instruments to achieve its objectives. The primary tools include a seven-day Reverse Repo Rate (RRR), Medium-term Lending Facility (MLF), foreign exchange interventions and Reserve Requirement Ratio (RRR). However, The Loan Prime Rate (LPR) is China’s benchmark interest rate. Changes to the LPR directly influence the rates that need to be paid in the market for loans and mortgages and the interest paid on savings. By changing the LPR, China’s central bank can also influence the exchange rates of the Chinese Renminbi.
Yes, China has 19 private banks – a small fraction of the financial system. The largest private banks are digital lenders WeBank and MYbank, which are backed by tech giants Tencent and Ant Group, per The Straits Times. In 2014, China allowed domestic lenders fully capitalized by private funds to operate in the state-dominated financial sector.
The Australian Dollar appreciates as the US Dollar faces challenges as concerns over tariff uncertainties deepen.
Westpac Consumer Confidence climbed 4% to 95.9 in March, up from 92.2 in February, reaching its highest level in three years.
President Trump described the economy as being in a “transition period,” signaling a potential slowdown.
The Australian Dollar (AUD) appreciates against the US Dollar (USD) for the fourth consecutive session on Tuesday. However, the AUD/USD pair struggled, during early hours, despite a stronger Westpac Consumer Confidence reading—rising 4% to 95.9 in March from 92.2 in February, marking its highest level in three years. The uptick in sentiment was driven by the Reserve Bank of Australia’s (RBA) interest rate cut in February and easing cost-of-living pressures.
Australia’s 10-year government bond yield declined to around 4.39% as escalating global trade tensions dampened investor risk appetite. China’s retaliatory tariffs on select United States (US) agricultural products took effect on Monday, following Washington’s recent tariff hike from 10% to 20% on Chinese imports. Given China’s status as Australia’s largest trading partner, these developments have weighed on market sentiment.
Traders remain focused on the RBA’s policy outlook, especially after last week’s strong economic data tempered expectations of further rate cuts. Economic growth exceeded forecasts, marking its first acceleration in over a year. Additionally, the latest RBA Meeting Minutes signaled a cautious approach to monetary policy, clarifying that February’s rate cut does not imply a commitment to ongoing easing.
With the Federal Reserve entering its blackout period ahead of the March 19 meeting, central bank commentary will be limited this week. Investors are now looking ahead to February’s Consumer Price Index (CPI) release on Wednesday for further insights into inflation trends.
Australian Dollar faces challenges amid escalating global trade tensions
The US Dollar Index (DXY), which tracks the US Dollar against six major currencies, remains subdued for the sixth consecutive day and is trading around 103.80 at the time of writing. Concerns over tariff policy uncertainty potentially pushing the US economy into recession have weighed on the Greenback.
Weaker-than-expected US job data for February reinforced expectations that the Federal Reserve (Fed) will proceed with multiple rate cuts this year. According to LSEG data, traders are now pricing in a total of 75 basis points (bps) in rate cuts, with a June cut fully anticipated.
President Trump characterized the economy as being in a “transition period,” hinting at a potential slowdown. Investors took his remarks as an early signal of possible economic turbulence in the near future.
The US Bureau of Labor Statistics (BLS) showed on Friday that Nonfarm Payrolls (NFP) increased by 151,000 in February, falling short of the expected 160,000. January’s job growth was also revised downward to 125,000 from the previously reported 143,000.
Last week, Fed Chair Jerome Powell reassured markets that the central bank sees no immediate need to adjust monetary policy despite rising uncertainties. San Francisco Fed President Mary Daly echoed this sentiment, noting that increasing business uncertainty could dampen demand but does not justify an interest rate change.
US Commerce Secretary Howard Lutnick stated on Sunday that the 25% tariffs, imposed by President Donald Trump in February, on steel and aluminum imports, set to take effect on Wednesday, are unlikely to be postponed, according to Bloomberg. While US steelmakers have urged Trump to maintain the tariffs, businesses reliant on these materials may face increased costs.
President Trump stated on Sunday that he anticipates a positive outcome from the US discussions with Ukrainian officials in Saudi Arabia. Trump also mentioned that his administration has considered lifting an intelligence pause on Ukraine, is evaluating various aspects of tariffs on Russia, and is not worried about military exercises involving Russia, China, and Iran, according to Reuters.
RBA Deputy Governor Andrew Hauser highlighted that global trade uncertainty is at a 50-year high. Hauser warned that uncertainty stemming from US President Donald Trump’s tariffs could prompt businesses and households to delay planning and investment, potentially weighing on economic growth.
China announced on Saturday that it will impose a 100% tariff on Canadian rapeseed oil, oil cakes, and peas, along with a 25% levy on aquatic products and pork from Canada. The move comes as retaliation against tariffs introduced by Canada in October, escalating trade tensions. This marks a new front in a broader trade conflict driven by US President Donald Trump’s tariff policies. The tariffs are set to take effect on March 20.
China’s Consumer Price Index fell by 0.7% year-over-year in February, exceeding market expectations of a 0.5% decline and reversing the 0.5% increase recorded in the previous month. This marks the first instance of consumer deflation since January 2024, driven by weakening seasonal demand after the Spring Festival in late January. On a monthly basis, CPI inflation stood at -0.2% in February, down from January’s 0.7% and softer than the expected -0.1%.
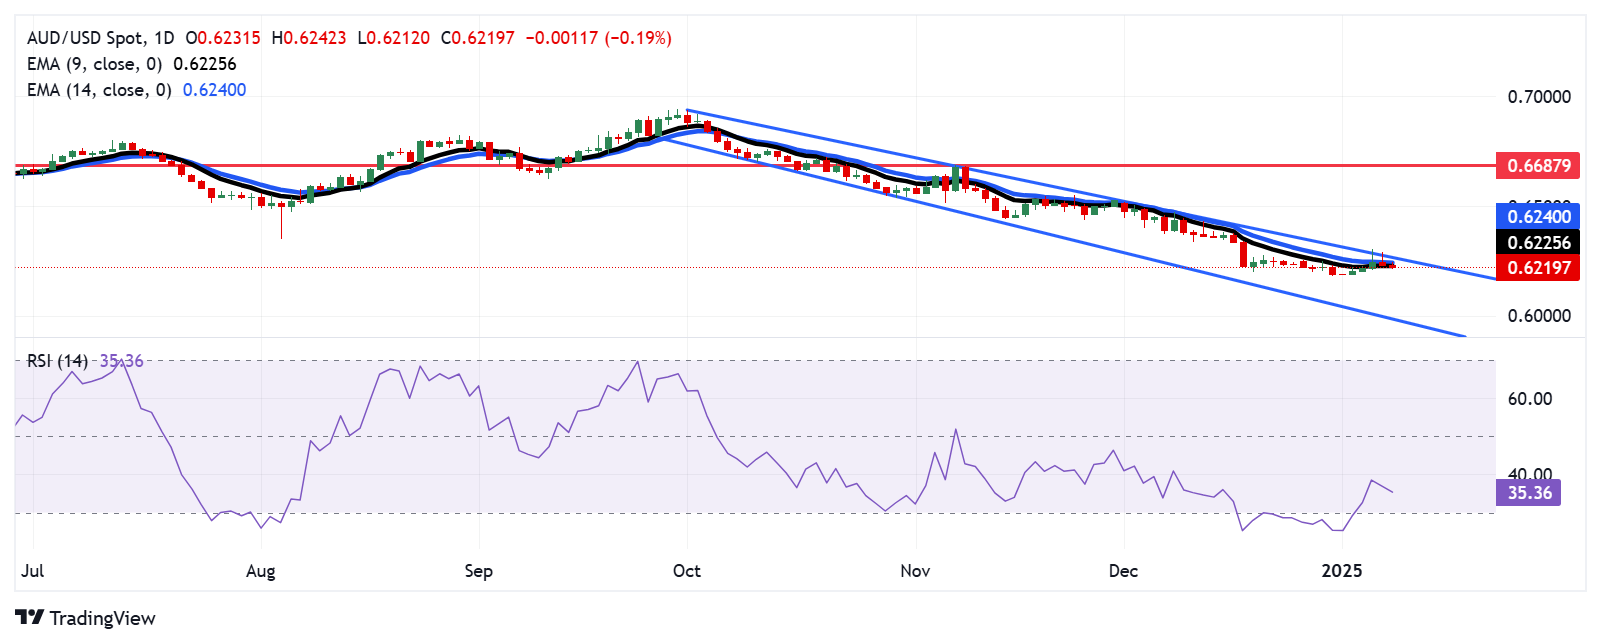
Technical Analysis: Australian Dollar falls to near 0.6250 as bearish momentum strengthens
The AUD/USD pair is trading near 0.6260 on Tuesday, with technical analysis of the daily chart showing the pair slipping below the nine-day Exponential Moving Average (EMA), signaling weakening short-term momentum. Additionally, the 14-day Relative Strength Index (RSI) has fallen below 50, indicating a shift toward a bearish bias.
On the downside, the AUD/USD pair could navigate the region around the five-week low of 0.6187, recorded on March 5.
The nine-day EMA at 0.6288 serves as the immediate resistance for the AUD/USD pair, followed by the 50-day EMA at 0.6305. A break above this level could strengthen short-term momentum, potentially pushing the pair toward the three-month high of 0.6408, last reached on February 21.
AUD/USD: Daily Chart
Australian Dollar PRICE Today
The table below shows the percentage change of Australian Dollar (AUD) against listed major currencies today. Australian Dollar was the strongest against the New Zealand Dollar.
USD
EUR
GBP
JPY
CAD
AUD
NZD
CHF
USD
-0.19%
-0.10%
-0.18%
-0.13%
-0.04%
0.05%
-0.28%
EUR
0.19%
0.10%
0.02%
0.07%
0.16%
0.24%
-0.08%
GBP
0.10%
-0.10%
-0.08%
-0.04%
0.06%
0.15%
-0.16%
JPY
0.18%
-0.02%
0.08%
0.05%
0.15%
0.22%
-0.08%
CAD
0.13%
-0.07%
0.04%
-0.05%
0.10%
0.18%
-0.13%
AUD
0.04%
-0.16%
-0.06%
-0.15%
-0.10%
0.09%
-0.22%
NZD
-0.05%
-0.24%
-0.15%
-0.22%
-0.18%
-0.09%
-0.31%
CHF
0.28%
0.08%
0.16%
0.08%
0.13%
0.22%
0.31%
The heat map shows percentage changes of major currencies against each other. The base currency is picked from the left column, while the quote currency is picked from the top row. For example, if you pick the Australian Dollar from the left column and move along the horizontal line to the US Dollar, the percentage change displayed in the box will represent AUD (base)/USD (quote).
Australian Dollar FAQs
One of the most significant factors for the Australian Dollar (AUD) is the level of interest rates set by the Reserve Bank of Australia (RBA). Because Australia is a resource-rich country another key driver is the price of its biggest export, Iron Ore. The health of the Chinese economy, its largest trading partner, is a factor, as well as inflation in Australia, its growth rate and Trade Balance. Market sentiment – whether investors are taking on more risky assets (risk-on) or seeking safe-havens (risk-off) – is also a factor, with risk-on positive for AUD.
The Reserve Bank of Australia (RBA) influences the Australian Dollar (AUD) by setting the level of interest rates that Australian banks can lend to each other. This influences the level of interest rates in the economy as a whole. The main goal of the RBA is to maintain a stable inflation rate of 2-3% by adjusting interest rates up or down. Relatively high interest rates compared to other major central banks support the AUD, and the opposite for relatively low. The RBA can also use quantitative easing and tightening to influence credit conditions, with the former AUD-negative and the latter AUD-positive.
China is Australia’s largest trading partner so the health of the Chinese economy is a major influence on the value of the Australian Dollar (AUD). When the Chinese economy is doing well it purchases more raw materials, goods and services from Australia, lifting demand for the AUD, and pushing up its value. The opposite is the case when the Chinese economy is not growing as fast as expected. Positive or negative surprises in Chinese growth data, therefore, often have a direct impact on the Australian Dollar and its pairs.
Iron Ore is Australia’s largest export, accounting for $118 billion a year according to data from 2021, with China as its primary destination. The price of Iron Ore, therefore, can be a driver of the Australian Dollar. Generally, if the price of Iron Ore rises, AUD also goes up, as aggregate demand for the currency increases. The opposite is the case if the price of Iron Ore falls. Higher Iron Ore prices also tend to result in a greater likelihood of a positive Trade Balance for Australia, which is also positive of the AUD.
The Trade Balance, which is the difference between what a country earns from its exports versus what it pays for its imports, is another factor that can influence the value of the Australian Dollar. If Australia produces highly sought after exports, then its currency will gain in value purely from the surplus demand created from foreign buyers seeking to purchase its exports versus what it spends to purchase imports. Therefore, a positive net Trade Balance strengthens the AUD, with the opposite effect if the Trade Balance is negative.
China’s Services Purchasing Managers’ Index (PMI) unexpectedly firmed to 51.4 in February from 51 in January, the latest data published by Caixin showed Wednesday.
The market consensus was for a 50.8 reading.
AUD/USD reaction to China’s Services PMI
At the time of writing, the AUD/USD pair is trading modestly flat on the day just above 0.6250, unimpressed by upbeat Chinese data.
Australian Dollar FAQs
One of the most significant factors for the Australian Dollar (AUD) is the level of interest rates set by the Reserve Bank of Australia (RBA). Because Australia is a resource-rich country another key driver is the price of its biggest export, Iron Ore. The health of the Chinese economy, its largest trading partner, is a factor, as well as inflation in Australia, its growth rate and Trade Balance. Market sentiment – whether investors are taking on more risky assets (risk-on) or seeking safe-havens (risk-off) – is also a factor, with risk-on positive for AUD.
The Reserve Bank of Australia (RBA) influences the Australian Dollar (AUD) by setting the level of interest rates that Australian banks can lend to each other. This influences the level of interest rates in the economy as a whole. The main goal of the RBA is to maintain a stable inflation rate of 2-3% by adjusting interest rates up or down. Relatively high interest rates compared to other major central banks support the AUD, and the opposite for relatively low. The RBA can also use quantitative easing and tightening to influence credit conditions, with the former AUD-negative and the latter AUD-positive.
China is Australia’s largest trading partner so the health of the Chinese economy is a major influence on the value of the Australian Dollar (AUD). When the Chinese economy is doing well it purchases more raw materials, goods and services from Australia, lifting demand for the AUD, and pushing up its value. The opposite is the case when the Chinese economy is not growing as fast as expected. Positive or negative surprises in Chinese growth data, therefore, often have a direct impact on the Australian Dollar and its pairs.
Iron Ore is Australia’s largest export, accounting for $118 billion a year according to data from 2021, with China as its primary destination. The price of Iron Ore, therefore, can be a driver of the Australian Dollar. Generally, if the price of Iron Ore rises, AUD also goes up, as aggregate demand for the currency increases. The opposite is the case if the price of Iron Ore falls. Higher Iron Ore prices also tend to result in a greater likelihood of a positive Trade Balance for Australia, which is also positive of the AUD.
The Trade Balance, which is the difference between what a country earns from its exports versus what it pays for its imports, is another factor that can influence the value of the Australian Dollar. If Australia produces highly sought after exports, then its currency will gain in value purely from the surplus demand created from foreign buyers seeking to purchase its exports versus what it spends to purchase imports. Therefore, a positive net Trade Balance strengthens the AUD, with the opposite effect if the Trade Balance is negative.
The USD is losing ground
against the major currencies as the market continues to price in more easing by
the end of the year. The market is now expecting three rate cuts by the end of
the year which is in stark contrast to just one seen a couple of weeks ago.
The US data recently
started to miss expectations by a big margin and the market reacted by
adjusting its growth expectations. The Trump’s tariffs policy is also weighing
on growth expectations increasing the likelihood of faster Fed easing down the
road.
One constraint the Fed
might have could come from higher inflation expectations. In case we get a
slowdown, the Fed might not be fast enough in cutting rates amid inflation
remaining above target and uncomfortably high long-term inflation expectations.
This is something to keep in mind in light of the next NFP and CPI reports.
On the AUD side, the RBA cut interest rates by 25 bps as expected recently bringing
the Cash Rate to 4.10% but it was accompanied by a more hawkish than expected
guidance. After the rate decision, we got a strong Australian Employment report and last week the monthly Trimmed-Mean CPI ticked higher to 2.8% remaining
near the upper bound of the 2-3% target range. Nonetheless, the AUD came under
pressure amid the Trump’s tariffs threats and general risk-off flows.
AUDUSD Technical
Analysis – Daily Timeframe
AUDUSD Daily
On the daily chart, we can
see that AUDUSD fell all the way back to the yearly lows. This is where we can
expect the buyers to step in to position for a rally back into the highs. The
sellers, on the other hand, will want to see the price breaking below the
0.6170 level to increase the bearish bets into new lows.
AUDUSD Technical
Analysis – 4 hour Timeframe
AUDUSD 4 hour
On the 4 hour chart, we can
see that we have a downward trendline defining the bearish momentum. The
sellers will likely lean on the trendline to keep pushing into new lows, while
the buyers will look for a break above the trendline and the 0.6254 level to
regain conviction and position for a rally back into the highs.
AUDUSD Technical
Analysis – 1 hour Timeframe
AUDUSD 1 hour
On the 1 hour chart, there’s
not much we can add here as the sellers will look for a rejection from the
trendline, while the buyers will look for a break above it. The red lines
define the average daily range for today.
Upcoming Catalysts
Today the market participants will be on
the lookout for tariffs headlines as they go into effect for Canada, Mexico and
China. Tomorrow, we have the US ADP and the US ISM Services PMI. On Thursday,
we get the latest US Jobless Claims figures. On Friday, we conclude the week
with the US NFP report.
The Australian Dollar gains ground following the TD-MI Inflation Gauge, and China Manufacturing PMI data released on Monday.
China’s Caixin Manufacturing PMI increased to 50.8 in February from January’s 50.1.
The US Dollar struggles as US PCE inflation data aligns with expectations, easing concerns over unexpected US inflation spikes.
The Australian Dollar (AUD) halted its six-day losing streak on Monday, buoyed by a weaker US Dollar (USD) following the release of January’s Personal Consumption Expenditures (PCE) inflation data on Friday. The report aligned with expectations, easing fears of unexpected inflation spikes in the US.
Australia’s TD-MI Inflation Gauge fell by 0.2% month-over-month in February, reversing a 0.1% rise in January. This marked the first decline since last August and followed the Reserve Bank of Australia’s (RBA) decision to cut its cash rate by 25 basis points to 4.1% during its first monetary policy meeting of the year, reflecting a continued slowdown in underlying inflation. However, on an annual basis, the gauge rose by 2.2%, slightly below the previous 2.3% increase.
The AUD also receives upward support from upbeat Chinese economic data. China’s Caixin Manufacturing Purchasing Managers’ Index (PMI) rose to 50.8 in February from January’s 50.1, exceeding market expectations of 50.3. Given China’s role as a key trading partner for Australia, the stronger PMI reading provided a boost to the Australian Dollar.
However, the AUD’s upside could be limited by escalating US-China trade tensions. Over the weekend, US President Donald Trump announced an additional 10% tariff on Chinese imports starting Tuesday, adding to the 10% tariff imposed last month. On Thursday, Trump stated on Truth Social that 25% tariffs on Canadian and Mexican goods will take effect on March 4.
Australian Dollar appreciates as concerns over unexpected US inflation ease
The US Dollar Index (DXY), which tracks the USD against six major currencies, weakens after three consecutive sessions of gains, hovering around 107.30 at the time of writing. The downside of the Greenback could be limited as US Treasury yields improve, with 2-year and 10-year Treasury yields currently standing at 4.02% and 4.24%, respectively.
The US PCE inflation report met expectations, with the monthly headline PCE holding steady at 0.3%. Core PCE rose slightly to 0.3% from December’s 0.2%, while the annual headline PCE stood at 2.6%, slightly exceeding projections but unchanged from December’s figure. Core PCE eased to 2.6%, down from a revised 2.9% in December.
Tensions escalated between US President Donald Trump and Ukrainian leader Volodymyr Zelenskyy during peace deal negotiations. Zelenskyy was expected to sign an agreement granting the US greater access to Ukraine’s rare earth minerals and participate in a joint press conference, but the plan was abandoned after a heated exchange between the leaders in front of the media. Following the confrontation, in which Trump openly expressed his disdain, top advisers asked Zelenskyy to leave the White House.
President Trump signed a memorandum on Friday instructing the Committee on Foreign Investment in the United States (CFIUS) to limit Chinese investments in strategic sectors. Reuters cited a White House official saying that the national security memorandum seeks to encourage foreign investment while safeguarding US national security interests from potential threats posed by foreign adversaries like China.
The S&P Global Australia Manufacturing Purchasing Managers Index (PMI) was revised down to 50.4 in February from an initial estimate of 50.6 but remained above January’s 50.2. This marked the second consecutive month of improvement in manufacturing conditions and the strongest growth since February 2023.
China’s NBS Manufacturing PMI improved to 50.2 in February versus 49.1 prior. This figure came in stronger than the 49.9 expected. Meanwhile, the NBS Non-Manufacturing PMI climbed to 50.4 in February from 50.2 in January, beating the estimation of 50.3.
According to a Wall Street Journal report on the Australian Dollar’s outlook from the Commonwealth Bank of Australia (CBA), heightened trade war risks driven by Trump have become a major concern. China’s response to these trade threats will be a key factor shaping the future performance of the AUD.
Australian Dollar tests 0.6200 support amid prevailing bearish bias
The AUD/USD pair is trading around 0.6220 on Monday. The daily chart analysis suggests that the pair remains under pressure, trading below the nine- and 14-day Exponential Moving Averages (EMAs), indicating weakening short-term momentum. Additionally, the 14-day Relative Strength Index (RSI) remains below 50, reinforcing the bearish outlook.
On the downside, the AUD/USD pair is currently testing key support at the psychological level of 0.6200. A break below this level could drive the price toward 0.6087, its lowest point since April 2020, recorded on February 3.
The initial resistance is seen at the nine-day EMA of 0.6280, followed by the 14-day EMA at 0.6290. A decisive break above these levels could strengthen short-term momentum, potentially leading the pair to retest the three-month high of 0.6408, reached on February 21.
AUD/USD: Daily Chart
Australian Dollar PRICE Today
The table below shows the percentage change of Australian Dollar (AUD) against listed major currencies today. Australian Dollar was the strongest against the US Dollar.
USD
EUR
GBP
JPY
CAD
AUD
NZD
CHF
USD
-0.44%
-0.27%
-0.15%
-0.10%
-0.35%
-0.21%
-0.12%
EUR
0.44%
0.06%
0.06%
0.15%
-0.01%
0.04%
0.14%
GBP
0.27%
-0.06%
0.13%
0.09%
-0.07%
-0.02%
0.08%
JPY
0.15%
-0.06%
-0.13%
0.26%
-0.15%
-0.02%
0.03%
CAD
0.10%
-0.15%
-0.09%
-0.26%
-0.09%
-0.11%
-0.01%
AUD
0.35%
0.01%
0.07%
0.15%
0.09%
0.05%
0.15%
NZD
0.21%
-0.04%
0.02%
0.02%
0.11%
-0.05%
0.10%
CHF
0.12%
-0.14%
-0.08%
-0.03%
0.00%
-0.15%
-0.10%
The heat map shows percentage changes of major currencies against each other. The base currency is picked from the left column, while the quote currency is picked from the top row. For example, if you pick the Australian Dollar from the left column and move along the horizontal line to the US Dollar, the percentage change displayed in the box will represent AUD (base)/USD (quote).
Economic Indicator
Caixin Manufacturing PMI
The Caixin Manufacturing Purchasing Managers Index (PMI), released on a monthly basis by Caixin Insight Group and S&P Global, is a leading indicator gauging business activity in China’s manufacturing sector. The data is derived from surveys of senior executives at both private-sector and state-owned companies. Survey responses reflect the change, if any, in the current month compared to the previous month and can anticipate changing trends in official data series such as Gross Domestic Product (GDP), industrial production, employment and inflation.The index varies between 0 and 100, with levels of 50.0 signaling no change over the previous month. A reading above 50 indicates that the manufacturing economy is generally expanding, a bullish sign for the Renminbi (CNY). Meanwhile, a reading below 50 signals that activity among goods producers is generally declining, which is seen as bearish for CNY.
The Australian Dollar holds gains after the release of a weaker-than-expected Private Capital Expenditure on Thursday.
Australia’s Private Capital Expenditure unexpectedly contracted by 0.2% QoQ in Q4 2024, falling short of market expectations for 0.8% growth.
The US Dollar continues to strengthen as traders evaluate the economy’s performance and the outlook on tariffs.
The Australian Dollar (AUD) holds gains against the US Dollar (USD) on Thursday. The AUD/USD pair gains ground despite the release of disappointing Australia’s Private Capital Expenditure, which unexpectedly shrank by 0.2% quarter-on-quarter in the fourth quarter of 2024, missing market expectations of 0.8% growth and after an upwardly revised 1.6% expansion in the previous quarter.
Reserve Bank of Australia (RBA) Deputy Governor Andrew Hauser said he expects more positive news on inflation but emphasized the importance of seeing this progress materialize first. He noted that the tightness in Australia’s labor market remains a challenge for controlling inflation.
The AUD also faced challenges on Wednesday following Australia’s monthly Consumer Price Index (CPI), which rose by 2.5% year-over-year in January, compared to a 2.5% increase seen in December. The market forecast was for 2.6% growth in the reported period.
The AUD/USD pair faces challenges due to rising risk sentiment as US President Donald Trump said late Monday that sweeping US tariffs on imports from Canada and Mexico “will go forward” when a month-long delay on their implementation expires next week. Moreover, the Trump administration is aiming to tighten chip export controls on China, Australia’s close trading partner.
However, the downside of the AUD/USD pair could be limited as the People’s Bank of China (PBOC) injected CNY300 billion on Tuesday via the one-year Medium-term Lending Facility (MLF), maintaining the rate at 2%. Additionally, the PBOC injected CNY318.5 billion through seven-day reverse repos at 1.50%, consistent with the prior rate.
Australian Dollar could depreciate due to increased risk aversion
The US Dollar Index (DXY), which measures the USD against six major currencies, gains ground as traders assess the strength of the economy and tariff outlook. The DXY extends its gains to near 106.50 at the time of writing.
Federal Reserve Bank of Atlanta President Raphael Bostic said late Wednesday that the Fed should hold interest rates where they are, at a level that continues to put downward pressure on inflation, per Bloomberg.
The White House said late Wednesday that US President Donald Trump issued an executive order aimed at implementing the Department of Government Efficiency’s (DOGE) cost-cutting drive, per Reuters. The executive order requires agencies to justify spending, limit travel, and identify surplus federal properties that can be sold.
President Trump signed a memorandum on Friday instructing the Committee on Foreign Investment in the United States (CFIUS) to limit Chinese investments in strategic sectors. Reuters cited a White House official saying that the national security memorandum seeks to encourage foreign investment while safeguarding US national security interests from potential threats posed by foreign adversaries like China.
The Reserve Bank of Australia (RBA) lowered its Official Cash Rate (OCR) by 25 basis points to 4.10% last week—the first rate cut in four years. Reserve Bank of Australia (RBA) Governor Michele Bullock acknowledged the impact of high interest rates but cautioned that it was too soon to declare victory over inflation. She also emphasized the labor market’s strength and clarified that future rate cuts are not guaranteed, despite market expectations.
Australian Dollar tests 0.6300 support as a bearish bias emerges
The AUD/USD pair hovers around 0.6300 on Thursday. Analysis of the daily chart indicates that the pair stays below the nine- and 14-day Exponential Moving Averages (EMAs), signaling weakening short-term price momentum. Moreover, the 14-day Relative Strength Index (RSI) remains below 50, reinforcing the prevailing bearish outlook.
The AUD/USD pair tests immediate support at the psychological level of 0.6300. A break below this threshold could push the pair toward the 0.6087 region, its lowest level since April 2020, recorded on February 3.
On the upside, the AUD/USD pair may face immediate resistance at the 14-day EMA of 0.6323, followed by the nine-day EMA at 0.6329. A decisive break above these levels could strengthen short-term price momentum, paving the way for the pair to challenge the two-month high of 0.6408, reached on February 21.
AUD/USD: Daily Chart
(This story was corrected on February 27 at 02:15 GMT to say, in the first paragraph, that “The Australian Dollar (AUD) holds gains against the US Dollar (USD) on Thursday,” not Wednesday.)
Australian Dollar PRICE Today
The table below shows the percentage change of Australian Dollar (AUD) against listed major currencies today. Australian Dollar was the strongest against the Swiss Franc.
USD
EUR
GBP
JPY
CAD
AUD
NZD
CHF
USD
0.05%
0.04%
0.07%
0.00%
-0.15%
-0.06%
0.10%
EUR
-0.05%
-0.00%
0.03%
-0.04%
-0.19%
-0.10%
0.05%
GBP
-0.04%
0.00%
0.06%
-0.04%
-0.19%
-0.10%
0.05%
JPY
-0.07%
-0.03%
-0.06%
-0.09%
-0.24%
-0.18%
0.00%
CAD
-0.00%
0.04%
0.04%
0.09%
-0.14%
-0.06%
0.09%
AUD
0.15%
0.19%
0.19%
0.24%
0.14%
0.09%
0.24%
NZD
0.06%
0.10%
0.10%
0.18%
0.06%
-0.09%
0.16%
CHF
-0.10%
-0.05%
-0.05%
-0.00%
-0.09%
-0.24%
-0.16%
The heat map shows percentage changes of major currencies against each other. The base currency is picked from the left column, while the quote currency is picked from the top row. For example, if you pick the Australian Dollar from the left column and move along the horizontal line to the US Dollar, the percentage change displayed in the box will represent AUD (base)/USD (quote).
Economic Indicator
Private Capital Expenditure
The Private Capital Expenditure released by the Australian Bureau of Statistics measures current and future capital expenditure intentions of the private sector. It is considered as an indicator for inflationary pressures. A high reading is seen as positive (or bullish) for the AUD, while a low reading is seen as negative (or bearish).
The Australian Dollar remains tepid following the release of the monthly Consumer Price Index.
China’s International Trade Representative and Vice Minister of Commerce met with US business leaders to discuss tariffs.
The Trump administration considers tightening chip export controls on China.
The Australian Dollar (AUD) remains subdued against the US Dollar (USD) for the fourth consecutive day on Wednesday. The AUD/USD pair remains under pressure after Australia’s monthly Consumer Price Index (CPI) showed a 2.5% year-over-year rise in January, matching December’s increase. This fell short of market expectations for 2.6% growth.
China’s Commerce Ministry announced on Wednesday that the country’s International Trade Representative and Vice Minister of Commerce, Wang Shouwen, met with US business leaders. The discussions focused primarily on tariffs, though no further details were disclosed.
A Bloomberg report early Tuesday revealed that the Trump administration plans to tighten chip export controls on China, a key trading partner of Australia. The US is reportedly considering stricter restrictions on Nvidia chip exports and may introduce additional limitations on Chinese companies such as SMIC and CXMT.
The AUD/USD pair struggles amid growing risk sentiment after US President Donald Trump stated late Monday that broad US tariffs on imports from Canada and Mexico “will go forward” once the month-long implementation delay ends next week. Trump asserted that the US has “been taken advantage of” by foreign countries and reaffirmed his intention to impose so-called reciprocal tariffs.
Australian Dollar depreciates amid increased risk aversion
The US Dollar Index (DXY), which measures the USD against six major currencies, falls to near 106.00 with 2-year and 10-year yields on US Treasury bonds declining to 4.09% and 4.28%, respectively, at the time of writing.
Federal Reserve Bank of Chicago President Austan Goolsbee remarked on Monday that the US central bank needs greater clarity before considering interest rate cuts.
The US Composite PMI fell to 50.4 in February, down from 52.7 in the previous month. In contrast, the Manufacturing PMI rose to 51.6 in February from 51.2 in January, surpassing the forecast of 51.5. Meanwhile, the Services PMI declined to 49.7 in February from 52.9 in January, falling short of the expected 53.0.
US Initial Jobless Claims for the week ending February 14 rose to 219,000, exceeding the expected 215,000. Meanwhile, Continuing Jobless Claims increased to 1.869 million, slightly below the forecast of 1.87 million.
President Trump signed a memorandum on Friday instructing the Committee on Foreign Investment in the United States (CFIUS) to limit Chinese investments in strategic sectors. Reuters cited a White House official saying that the national security memorandum seeks to encourage foreign investment while safeguarding US national security interests from potential threats posed by foreign adversaries like China.
China released its annual policy statement for 2025 on Sunday. The statement details strategies to advance rural reforms and promote comprehensive rural revitalization. Additionally, China’s state-supported developers are aggressively increasing land purchases at premium prices, driven by the government’s relaxation of home price restrictions to revitalize the troubled property market.
The People’s Bank of China (PBOC) injected CNY300 billion on Tuesday via the one-year Medium-term Lending Facility (MLF), maintaining the rate at 2%. Additionally, the PBOC injected CNY318.5 billion through seven-day reverse repos at 1.50%, consistent with the prior rate.
The Reserve Bank of Australia (RBA) lowered its Official Cash Rate (OCR) by 25 basis points to 4.10% last week—the first rate cut in four years. Reserve Bank of Australia (RBA) Governor Michele Bullock acknowledged the impact of high interest rates but cautioned that it was too soon to declare victory over inflation. She also emphasized the labor market’s strength and clarified that future rate cuts are not guaranteed, despite market expectations.
Australian Dollar moves toward 14-day EMA barrier after breaking below 0.6350
AUD/USD trades near 0.6340 on Wednesday, breaking below the ascending channel that reflects a weakening bullish market bias. However, the 14-day Relative Strength Index (RSI) remains above 50, supporting the positive outlook is still in play.
On the upside, the AUD/USD pair tests the immediate barrier at a nine-day Exponential Moving Average (EMA) of 0.6342. A successful break above this level could improve the short-term price momentum and support the pair in testing the key psychological resistance at 0.6400, with the next hurdle at the ascending channel’s upper boundary around 0.6450.
The AUD/USD pair tests immediate support at the 14-day EMA of 0.6331. A decisive break below this level could cause the emergence of the bearish bias and lead the pair to test the psychological level of 0.6300.
AUD/USD: Daily Chart
Australian Dollar PRICE Today
The table below shows the percentage change of Australian Dollar (AUD) against listed major currencies today. Australian Dollar was the weakest against the US Dollar.
USD
EUR
GBP
JPY
CAD
AUD
NZD
CHF
USD
0.09%
0.11%
0.36%
0.04%
0.18%
0.11%
0.07%
EUR
-0.09%
0.03%
0.27%
-0.06%
0.09%
0.02%
-0.02%
GBP
-0.11%
-0.03%
0.23%
-0.08%
0.06%
-0.00%
-0.04%
JPY
-0.36%
-0.27%
-0.23%
-0.32%
-0.18%
-0.26%
-0.28%
CAD
-0.04%
0.06%
0.08%
0.32%
0.14%
0.08%
0.05%
AUD
-0.18%
-0.09%
-0.06%
0.18%
-0.14%
-0.05%
-0.09%
NZD
-0.11%
-0.02%
0.00%
0.26%
-0.08%
0.05%
-0.04%
CHF
-0.07%
0.02%
0.04%
0.28%
-0.05%
0.09%
0.04%
The heat map shows percentage changes of major currencies against each other. The base currency is picked from the left column, while the quote currency is picked from the top row. For example, if you pick the Australian Dollar from the left column and move along the horizontal line to the US Dollar, the percentage change displayed in the box will represent AUD (base)/USD (quote).
Australian Dollar FAQs
One of the most significant factors for the Australian Dollar (AUD) is the level of interest rates set by the Reserve Bank of Australia (RBA). Because Australia is a resource-rich country another key driver is the price of its biggest export, Iron Ore. The health of the Chinese economy, its largest trading partner, is a factor, as well as inflation in Australia, its growth rate and Trade Balance. Market sentiment – whether investors are taking on more risky assets (risk-on) or seeking safe-havens (risk-off) – is also a factor, with risk-on positive for AUD.
The Reserve Bank of Australia (RBA) influences the Australian Dollar (AUD) by setting the level of interest rates that Australian banks can lend to each other. This influences the level of interest rates in the economy as a whole. The main goal of the RBA is to maintain a stable inflation rate of 2-3% by adjusting interest rates up or down. Relatively high interest rates compared to other major central banks support the AUD, and the opposite for relatively low. The RBA can also use quantitative easing and tightening to influence credit conditions, with the former AUD-negative and the latter AUD-positive.
China is Australia’s largest trading partner so the health of the Chinese economy is a major influence on the value of the Australian Dollar (AUD). When the Chinese economy is doing well it purchases more raw materials, goods and services from Australia, lifting demand for the AUD, and pushing up its value. The opposite is the case when the Chinese economy is not growing as fast as expected. Positive or negative surprises in Chinese growth data, therefore, often have a direct impact on the Australian Dollar and its pairs.
Iron Ore is Australia’s largest export, accounting for $118 billion a year according to data from 2021, with China as its primary destination. The price of Iron Ore, therefore, can be a driver of the Australian Dollar. Generally, if the price of Iron Ore rises, AUD also goes up, as aggregate demand for the currency increases. The opposite is the case if the price of Iron Ore falls. Higher Iron Ore prices also tend to result in a greater likelihood of a positive Trade Balance for Australia, which is also positive of the AUD.
The Trade Balance, which is the difference between what a country earns from its exports versus what it pays for its imports, is another factor that can influence the value of the Australian Dollar. If Australia produces highly sought after exports, then its currency will gain in value purely from the surplus demand created from foreign buyers seeking to purchase its exports versus what it spends to purchase imports. Therefore, a positive net Trade Balance strengthens the AUD, with the opposite effect if the Trade Balance is negative.
The Australian Dollar advanced as the Chinese government announced its annual policy statement for 2025 on Sunday.
The AUD struggled as Trump instructed the Committee on Foreign Investment to limit Chinese investments in the US.
The US Dollar struggles following the downbeat US economic data released last week.
The Australian Dollar (AUD) retraces its recent losses from the previous session on Monday following the Chinese government’s release of its annual policy statement for 2025 on Sunday. The statement details strategies to advance rural reforms and promote comprehensive rural revitalization. Optimism around China’s stimulus plans could strengthen the AUD, given China’s role as a key trading partner for Australia.
China’s state-supported developers are aggressively increasing land purchases at premium prices, driven by the government’s relaxation of home price restrictions aimed at revitalizing the troubled property market. In 2025 so far, 37% of land sales have closed at prices 20% or more above the asking price — a sharp rise from 14% in 2024 and just 4.6% in 2023, according to the China Index Academy.
The AUD/USD pair faced challenges as President Donald Trump signed a memorandum on Friday instructing the Committee on Foreign Investment in the United States (US) to limit Chinese investments in strategic sectors. Reuters cited a White House official saying that the national security memorandum seeks to encourage foreign investment while safeguarding US national security interests from potential threats posed by foreign adversaries like China.
The Reserve Bank of Australia (RBA) lowered its Official Cash Rate (OCR) by 25 basis points to 4.10% last week—the first rate cut in four years. Reserve Bank of Australia (RBA) Governor Michele Bullock acknowledged the impact of high interest rates but cautioned that it was too soon to declare victory over inflation. She also emphasized the labor market’s strength and clarified that future rate cuts are not guaranteed, despite market expectations.
Australian Dollar strengthens as the US Dollar falters amid disappointing economic data
The US Dollar Index (DXY), which measures the USD against six major currencies, depreciates below 106.50 at the time of writing. The DXY faced challenges following the downbeat US economic data including Jobless Claims S&P Global Purchasing Managers’ Index (PMI) released last week.
The US Composite PMI fell to 50.4 in February, down from 52.7 in the previous month. In contrast, the Manufacturing PMI rose to 51.6 in February from 51.2 in January, surpassing the forecast of 51.5. Meanwhile, the Services PMI declined to 49.7 in February from 52.9 in January, falling short of the expected 53.0.
US Initial Jobless Claims for the week ending February 14 rose to 219,000, exceeding the expected 215,000. Meanwhile, Continuing Jobless Claims increased to 1.869 million, slightly below the forecast of 1.87 million.
Federal Reserve Board Governor Adriana Kugler stated on Thursday that US inflation still has “some way to go” before reaching the central bank’s 2% target, noting that the path remains uncertain, according to Reuters.
St. Louis Fed President Alberto Musalem cautioned about potential stagflation risks and rising inflation expectations. Meanwhile, Atlanta Fed President Raphael Bostic kept the possibility of two rate cuts this year open, contingent on economic developments.
President Trump indicated that a new trade deal with China is possible and expects Chinese President Xi Jinping to visit. He also mentioned discussions with China regarding TikTok and noted that his administration is considering a 25% tariff on lumber and forest products.
The latest Federal Open Market Committee (FOMC) Meeting Minutes reaffirmed the decision to keep interest rates unchanged in January. Policymakers emphasized the need for more time to assess economic activity, labor market trends, and inflation before considering any rate adjustments. The committee also agreed that clear signs of declining inflation are necessary before implementing rate cuts.
President Trump has confirmed that a 25% tariff on pharmaceutical and semiconductor imports will take effect in April. Additionally, he reaffirmed that auto tariffs will remain at 25%, further escalating global trade tensions.
Australia’s Judo Bank Manufacturing PMI rose to 50.6 in February, up from 50.2 in January. The Services PMI improved to 51.4 from 51.2, while the Composite PMI edged up to 51.2 from 51.1.
The Australian Bureau of Statistics (ABS) reported on Thursday that Australia’s seasonally adjusted Unemployment Rate rose to 4.1% in January from 4.0% in December, aligning with market expectations. Additionally, Employment Change came in at 44K for January, down from a revised 60K in December (previously 56.3K), but still exceeding the consensus forecast of 20K.
Reserve Bank of Australia (RBA) Deputy Governor Andrew Hauser stated while speaking to Bloomberg News last week that the central bank’s policy “is still restrictive.” Hauser noted that the latest jobs data showed little cause for concern.
Australian Dollar could test 0.6350 support near nine-day EMA
AUD/USD trades near 0.6370 on Monday, moving within an ascending channel that reflects bullish market sentiment. The 14-day Relative Strength Index (RSI) stays above 50, supporting the positive outlook.
On the upside, the AUD/USD pair could challenge the key psychological resistance at 0.6400, with the next hurdle at the ascending channel’s upper boundary around 0.6430.
The AUD/USD pair could find immediate support at the nine-day Exponential Moving Average (EMA) of 0.6347, followed by the 14-day EMA at 0.6330. A stronger support zone aligns with the channel’s lower boundary near 0.6320.
AUD/USD: Daily Chart
Australian Dollar PRICE Today
The table below shows the percentage change of Australian Dollar (AUD) against listed major currencies today. Australian Dollar was the strongest against the US Dollar.
USD
EUR
GBP
JPY
CAD
AUD
NZD
CHF
USD
-0.42%
-0.28%
-0.07%
-0.14%
-0.13%
-0.07%
-0.15%
EUR
0.42%
0.06%
0.17%
0.10%
0.29%
0.17%
0.10%
GBP
0.28%
-0.06%
0.17%
0.04%
0.23%
0.12%
0.04%
JPY
0.07%
-0.17%
-0.17%
-0.06%
0.04%
0.10%
0.02%
CAD
0.14%
-0.10%
-0.04%
0.06%
-0.04%
0.08%
0.00%
AUD
0.13%
-0.29%
-0.23%
-0.04%
0.04%
-0.11%
-0.18%
NZD
0.07%
-0.17%
-0.12%
-0.10%
-0.08%
0.11%
-0.07%
CHF
0.15%
-0.10%
-0.04%
-0.02%
-0.00%
0.18%
0.07%
The heat map shows percentage changes of major currencies against each other. The base currency is picked from the left column, while the quote currency is picked from the top row. For example, if you pick the Australian Dollar from the left column and move along the horizontal line to the US Dollar, the percentage change displayed in the box will represent AUD (base)/USD (quote).
Australian Dollar FAQs
One of the most significant factors for the Australian Dollar (AUD) is the level of interest rates set by the Reserve Bank of Australia (RBA). Because Australia is a resource-rich country another key driver is the price of its biggest export, Iron Ore. The health of the Chinese economy, its largest trading partner, is a factor, as well as inflation in Australia, its growth rate and Trade Balance. Market sentiment – whether investors are taking on more risky assets (risk-on) or seeking safe-havens (risk-off) – is also a factor, with risk-on positive for AUD.
The Reserve Bank of Australia (RBA) influences the Australian Dollar (AUD) by setting the level of interest rates that Australian banks can lend to each other. This influences the level of interest rates in the economy as a whole. The main goal of the RBA is to maintain a stable inflation rate of 2-3% by adjusting interest rates up or down. Relatively high interest rates compared to other major central banks support the AUD, and the opposite for relatively low. The RBA can also use quantitative easing and tightening to influence credit conditions, with the former AUD-negative and the latter AUD-positive.
China is Australia’s largest trading partner so the health of the Chinese economy is a major influence on the value of the Australian Dollar (AUD). When the Chinese economy is doing well it purchases more raw materials, goods and services from Australia, lifting demand for the AUD, and pushing up its value. The opposite is the case when the Chinese economy is not growing as fast as expected. Positive or negative surprises in Chinese growth data, therefore, often have a direct impact on the Australian Dollar and its pairs.
Iron Ore is Australia’s largest export, accounting for $118 billion a year according to data from 2021, with China as its primary destination. The price of Iron Ore, therefore, can be a driver of the Australian Dollar. Generally, if the price of Iron Ore rises, AUD also goes up, as aggregate demand for the currency increases. The opposite is the case if the price of Iron Ore falls. Higher Iron Ore prices also tend to result in a greater likelihood of a positive Trade Balance for Australia, which is also positive of the AUD.
The Trade Balance, which is the difference between what a country earns from its exports versus what it pays for its imports, is another factor that can influence the value of the Australian Dollar. If Australia produces highly sought after exports, then its currency will gain in value purely from the surplus demand created from foreign buyers seeking to purchase its exports versus what it spends to purchase imports. Therefore, a positive net Trade Balance strengthens the AUD, with the opposite effect if the Trade Balance is negative.
AUD/USD softens to around 0.6345 in Monday’s early Asian session.
The RBA poises to deliver the first rate cut in four years.
The Aussie is benefiting from an easing of worst-case fears of US tariffs
The AUD/USD pair weakens to near 0.6345 during the early Asian session on Monday. The rising speculation of the Reserve Bank of Australia (RBA) rate cut drags the Australian Dollar (AUD) lower against the Greenback. All eyes will be on the RBA interest rate decision on Tuesday.
The Australian central bank is expected to cut its Official Cash Rate (OCR) by 25 basis points (bps) to 4.10%, the first rate reduction in four years, at the end of its two-day policy meeting on Tuesday. The RBA dovish bets are likely to weigh on the Aussie against the US Dollar (USD) for the time being.
“The prudent action for the RBA now would be to cut, but cut slowly and just see how data evolves through time. The worst thing they could possibly do is cut hard and then have to reverse. That’s the clear risk case for them,” said Craig Vardy, head of fixed income, BlackRock Australasia.
On the other hand, the downside of the AUD might be capped due to the delay in the implementation of US President Donald Trump’s tariff proposals. The process of Trump’s ultimate tariff policies might take longer than many analysts had expected. Westpac analysts are leaning toward further gains in the AUD in the near term.
Additionally, the disappointing US economic data could exert some selling pressure on the Greenback. Data released by the US Census Bureau on Friday showed that US Retail Sales declined by 0.9% in January from the 0.7% increase (revised from 0.4%) in December. This figure came in weaker than the market expectation for a decrease of 0.1%.
Australian Dollar FAQs
One of the most significant factors for the Australian Dollar (AUD) is the level of interest rates set by the Reserve Bank of Australia (RBA). Because Australia is a resource-rich country another key driver is the price of its biggest export, Iron Ore. The health of the Chinese economy, its largest trading partner, is a factor, as well as inflation in Australia, its growth rate and Trade Balance. Market sentiment – whether investors are taking on more risky assets (risk-on) or seeking safe-havens (risk-off) – is also a factor, with risk-on positive for AUD.
The Reserve Bank of Australia (RBA) influences the Australian Dollar (AUD) by setting the level of interest rates that Australian banks can lend to each other. This influences the level of interest rates in the economy as a whole. The main goal of the RBA is to maintain a stable inflation rate of 2-3% by adjusting interest rates up or down. Relatively high interest rates compared to other major central banks support the AUD, and the opposite for relatively low. The RBA can also use quantitative easing and tightening to influence credit conditions, with the former AUD-negative and the latter AUD-positive.
China is Australia’s largest trading partner so the health of the Chinese economy is a major influence on the value of the Australian Dollar (AUD). When the Chinese economy is doing well it purchases more raw materials, goods and services from Australia, lifting demand for the AUD, and pushing up its value. The opposite is the case when the Chinese economy is not growing as fast as expected. Positive or negative surprises in Chinese growth data, therefore, often have a direct impact on the Australian Dollar and its pairs.
Iron Ore is Australia’s largest export, accounting for $118 billion a year according to data from 2021, with China as its primary destination. The price of Iron Ore, therefore, can be a driver of the Australian Dollar. Generally, if the price of Iron Ore rises, AUD also goes up, as aggregate demand for the currency increases. The opposite is the case if the price of Iron Ore falls. Higher Iron Ore prices also tend to result in a greater likelihood of a positive Trade Balance for Australia, which is also positive of the AUD.
The Trade Balance, which is the difference between what a country earns from its exports versus what it pays for its imports, is another factor that can influence the value of the Australian Dollar. If Australia produces highly sought after exports, then its currency will gain in value purely from the surplus demand created from foreign buyers seeking to purchase its exports versus what it spends to purchase imports. Therefore, a positive net Trade Balance strengthens the AUD, with the opposite effect if the Trade Balance is negative.
Yesterday, the US PPI report came in higher than expected but the
focus was on the details that feed into the Core PCE index, which is what the
Fed focuses on. Those details were all very soft and helped to bring the early
estimates down to more benign levels. In fact, the Core PCE Y/Y is now
projected to fall to 2.6% vs. 2.8% prior. That’s good news for the Fed.
The US Dollar fell across
the board as a result and eventually the bearish momentum increased
substantially in the evening as the Trump’s tariffs saga came to an end. In
fact, the US President announced his reciprocal tariffs that could go into effect in April
but the overall tone of it wasn’t aggressive and sounded a lot like the start
of a negotiating process to bring tariffs to a fair level for everyone.
On the AUD side, it’s been
all about the US Dollar softness and with the markets now less concerned about
tariffs, the other major currencies got the green light to appreciate against
the greenback.
On the data side, the Australian Q4 CPI report recently missed expectations
across the board with the underlying inflation figures easing further and now
comfortably in the RBA’s target range on a 6-month annualised basis.
As a reminder, the RBA softened
further its stance
at the last policy decision as it nears the first rate cut. The market is now seeing
an 86% chance of a 25 bps cut in February with a total of 75 bps of easing
expected by year end.
AUDUSD
Technical Analysis – Daily Timeframe
AUDUSD Daily
On the daily chart, we can
see that AUDUSD is testing the key resistance zone around the 0.6330 level. This
is where we can expect the sellers to step in with a defined risk above the
resistance to position for a drop back into the 0.6170 level. The buyers, on
the other hand, will want to see the price breaking higher to increase the
bullish bets into the 0.65 handle next.
AUDUSD Technical
Analysis – 4 hour Timeframe
AUDUSD 4 hour
On the 4 hour chart, we can
see that we have an upward trendline
defining the bullish momentum. If we get a pullback into it, we can expect the
buyers to lean on the trendline with a defined risk below it to position for
the break above the resistance. The sellers, on the other hand, will want to see
the price breaking lower to increase the bearish bets into the 0.6170 level next.
AUDUSD Technical
Analysis – 1 hour Timeframe
AUDUSD 1 hour
On the 1 hour chart, there’s
not much we can add here as the sellers will pile in around these levels, while
the buyers will look for a breakout to extend the rally into new highs. The red
lines define the average daily range for today.
Upcoming Catalysts
Today we conclude the week with the US
Retail Sales.
The Australian Dollar appreciates as Trump postpones the implementation of reciprocal tariffs.
The AUD may face headwinds as the RBA maintains its rate-cut stance following a fresh inflation outlook.
The US Dollar weakens amid declining US yields, despite persistent concerns over a global trade war.
The Australian Dollar (AUD) strengthens for the second consecutive day on Friday, driven by US President Donald Trump’s decision to postpone the implementation of reciprocal tariffs. Additionally, the AUD/USD pair appreciates as the US Dollar (USD) weakens amid falling US yields across the curve, despite ongoing concerns about a global trade war. Investors now await the release of US Retail Sales data later in the day.
The AUD may face headwinds as expectations of a Reserve Bank of Australia (RBA) rate cut remain intact following fresh inflation outlook data. Consumer inflation expectations climbed to 4.6% in February from 4.0% in January, reaching their highest level since April 2024. This comes ahead of the RBA’s first monetary policy meeting of the year next week, with market odds indicating a 95% probability of a rate cut to 4.10%, as recent data suggests underlying inflation is cooling faster than anticipated.
The upside of the AUD/USD pair could be limited as strong US inflation data reinforces expectations of prolonged Federal Reserve (Fed) rate holds. Fed Chair Jerome Powell recently reiterated that the central bank is in no rush to cut rates further, citing a resilient economy and persistently high inflation.
Australian Dollar appreciates as US Dollar loses ground despite a hawkish Fed
The US Dollar Index (DXY), which measures the US Dollar’s value against six major currencies, extends its losses for the fourth successive session. The DXY trades around 107.00 with 2-year and 10-year yields on US Treasury bonds standing at 4.31% and 4.53%, respectively, at the time of writing.
Core PPI inflation in the United States (US) rose to 3.6% YoY in January, exceeding the expected 3.3% but slightly below the revised 3.7% (previously reported as 3.5%). This has reinforced expectations that the Federal Reserve (Fed) will delay rate cuts until the second half of the year.
US Consumer Price Index (CPI) rose 3.0% year-over-year in January, exceeding expectations of 2.9%. The core CPI, which excludes food and energy, increased to 3.3% from 3.2%, surpassing the forecast of 3.1%. On a monthly basis, headline inflation jumped to 0.5% in January from 0.4% in December, while core CPI rose to 0.4% from 0.2% over the same period.
In his semi-annual report to Congress, Fed’s Powell said the Fed officials “do not need to be in a hurry” to cut interest rates due to strength in the job market and solid economic growth. He added that US President Donald Trump’s tariff policies could put more upward pressure on prices, making it harder for the central bank to lower rates.
A Reuters poll of economists now suggests the Federal Reserve will delay cutting interest rates until next quarter amid rising inflation concerns. Many who had previously expected a March rate cut have revised their forecasts. The majority of economists surveyed between February 4-10 anticipate at least one rate cut by June, though opinions on the exact timing remain divided.
Federal Reserve Bank of Cleveland President Beth Hammack stated on Tuesday that keeping interest rates steady for an extended period will likely be appropriate. Hammack emphasized that a patient approach will allow the Fed to assess economic conditions and noted that the central bank is well-positioned to respond to any shifts in the economy, according to Reuters.
Technical Analysis: Australian Dollar rises above 0.6300 toward eight-week highs
The AUD/USD pair hovers near 0.6320 on Friday, rising above the nine- and 14-day Exponential Moving Averages (EMAs) on the daily chart. This suggests that short-term price momentum is strengthening. Additionally, the 14-day Relative Strength Index (RSI) maintains its position above the 50 mark, reinforcing a bullish bias.
On the upside, the AUD/USD pair may test the eight-week high of 0.6330, which was last reached on January 24. A break above this level could support the pair to approach a psychological level of 0.6400.
The AUD/USD pair could fall toward primary support at the nine-day EMA of 0.6290 level, followed by the 14-day EMA of 0.6279. A decisive break below these levels could weaken the short-term price momentum, potentially pushing the pair toward the psychological level of 0.6200.
AUD/USD: Daily Chart
Australian Dollar PRICE Today
The table below shows the percentage change of Australian Dollar (AUD) against listed major currencies today. Australian Dollar was the strongest against the Euro.
USD
EUR
GBP
JPY
CAD
AUD
NZD
CHF
USD
0.02%
-0.04%
-0.09%
-0.01%
-0.03%
-0.11%
-0.00%
EUR
-0.02%
-0.06%
-0.11%
-0.03%
-0.06%
-0.14%
-0.03%
GBP
0.04%
0.06%
-0.06%
0.03%
0.00%
-0.07%
0.04%
JPY
0.09%
0.11%
0.06%
0.07%
0.04%
-0.04%
0.08%
CAD
0.00%
0.03%
-0.03%
-0.07%
-0.04%
-0.10%
0.00%
AUD
0.03%
0.06%
-0.00%
-0.04%
0.04%
-0.08%
0.03%
NZD
0.11%
0.14%
0.07%
0.04%
0.10%
0.08%
0.11%
CHF
0.00%
0.03%
-0.04%
-0.08%
-0.01%
-0.03%
-0.11%
The heat map shows percentage changes of major currencies against each other. The base currency is picked from the left column, while the quote currency is picked from the top row. For example, if you pick the Australian Dollar from the left column and move along the horizontal line to the US Dollar, the percentage change displayed in the box will represent AUD (base)/USD (quote).
RBA FAQs
The Reserve Bank of Australia (RBA) sets interest rates and manages monetary policy for Australia. Decisions are made by a board of governors at 11 meetings a year and ad hoc emergency meetings as required. The RBA’s primary mandate is to maintain price stability, which means an inflation rate of 2-3%, but also “..to contribute to the stability of the currency, full employment, and the economic prosperity and welfare of the Australian people.” Its main tool for achieving this is by raising or lowering interest rates. Relatively high interest rates will strengthen the Australian Dollar (AUD) and vice versa. Other RBA tools include quantitative easing and tightening.
While inflation had always traditionally been thought of as a negative factor for currencies since it lowers the value of money in general, the opposite has actually been the case in modern times with the relaxation of cross-border capital controls. Moderately higher inflation now tends to lead central banks to put up their interest rates, which in turn has the effect of attracting more capital inflows from global investors seeking a lucrative place to keep their money. This increases demand for the local currency, which in the case of Australia is the Aussie Dollar.
Macroeconomic data gauges the health of an economy and can have an impact on the value of its currency. Investors prefer to invest their capital in economies that are safe and growing rather than precarious and shrinking. Greater capital inflows increase the aggregate demand and value of the domestic currency. Classic indicators, such as GDP, Manufacturing and Services PMIs, employment, and consumer sentiment surveys can influence AUD. A strong economy may encourage the Reserve Bank of Australia to put up interest rates, also supporting AUD.
Quantitative Easing (QE) is a tool used in extreme situations when lowering interest rates is not enough to restore the flow of credit in the economy. QE is the process by which the Reserve Bank of Australia (RBA) prints Australian Dollars (AUD) for the purpose of buying assets – usually government or corporate bonds – from financial institutions, thereby providing them with much-needed liquidity. QE usually results in a weaker AUD.
Quantitative tightening (QT) is the reverse of QE. It is undertaken after QE when an economic recovery is underway and inflation starts rising. Whilst in QE the Reserve Bank of Australia (RBA) purchases government and corporate bonds from financial institutions to provide them with liquidity, in QT the RBA stops buying more assets, and stops reinvesting the principal maturing on the bonds it already holds. It would be positive (or bullish) for the Australian Dollar.
The Australian Dollar could struggle as China is due to be hit with a 10% tariff later in the day.
Traders monitor the development surrounding the tariff deal with China.
Trump would suspend his tariffs after both countries agreed to send 10,000 soldiers to the US border to prevent drug trafficking.
The Australian Dollar (AUD) rebounds on Tuesday, ending its six-day losing streak as the AUD/USD pair rises amid a weakening US Dollar (USD). The USD depreciated after US President Donald Trump announced late Monday that he would pause tariffs on Mexico and Canada. However, market volatility remains a concern as investors closely watch developments in the ongoing tariff negotiations with China, Australia’s key trading partner. China is due to be hit with across-the-board tariffs of 10% that begin at 05.00 GMT on Tuesday.
President Trump stated that he would suspend steep tariffs on Mexico and Canada after their leaders agreed to deploy 10,000 soldiers to the US border to combat drug trafficking. The tariffs on Mexico and Canada have been postponed for at least 30 days. This decision comes just two days after Trump imposed 25% tariffs on Mexican and Canadian goods and 10% tariffs on imports from China.
The AUD may lose its ground due to the increased likelihood that the Reserve Bank of Australia (RBA) could consider a rate cut in February. The RBA has maintained the Official Cash Rate (OCR) at 4.35% since November 2023, emphasizing that inflation must “sustainably” return to its 2%-3% target range before any policy easing.
Australian Dollar appreciates due to improved risk sentiment
The US Dollar Index (DXY), which measures the US Dollar’s value against six major currencies, stabilizes around 108.70 at the time of writing after giving up most of its gains in the previous session.
The White House announced late Monday that US President Donald Trump signed an executive order to initiate the creation of a government-owned investment fund, according to Reuters. This fund could allow the US to profit from TikTok if an American buyer is secured. TikTok has until early April to find an approved partner or purchaser. Trump is pushing for the US to acquire a 50% stake in the company.
Data released by the Institute for Supply Management (ISM) on Monday showed that the Manufacturing PMI rose to 50.9 in January from 49.3 in December. This reading came in better than the estimation of 49.8.
The US Personal Consumption Expenditures (PCE) Price Index, the Fed’s preferred inflation gauge, rose 0.3% MoM in December, up from 0.1% in November. On an annual basis, PCE inflation accelerated to 2.6% from the previous 2.4%, while core PCE, which excludes food and energy, remained steady at 2.8% YoY for the third straight month.
Fed Chair Jerome Powell emphasized during the post-meeting press conference that the central bank would need to see “real progress on inflation or some weakness in the labor market” before considering any further adjustments to monetary policy.
US Treasury Secretary Scott Bessent warned Key Square Capital Management partners a year ago that “tariffs are inflationary and would strengthen the US Dollar—hardly a good starting point for a US industrial renaissance.” However, according to the Financial Times (FT), Bessent last week advocated for new universal tariffs on US imports, proposing an initial 2.5% rate that would gradually increase.
President Trump announced his threat on X (formerly Twitter) to levy 100% tariffs on BRICS nations if they attempt to introduce an alternative currency to challenge the US dollar in international trade.
Australia’s Retail Sales declined by 0.1% month-on-month in December 2024, marking the first drop in nine months. Although the decline was less severe than the anticipated 0.7% contraction. The annual sales increased by 4.6% compared to December 2023. On a seasonally adjusted basis, sales rose 1.0% QoQ in the December quarter of 2024.
China’s Caixin Manufacturing Purchasing Managers’ Index (PMI) declined to 50.1 in January, down from 50.5 in December. The reading fell short of market expectations, which had anticipated a steady 50.5.
ANZ, CBA, Westpac, and now National Australia Bank (NAB) all anticipate a 25 basis point (bps) rate cut from the Reserve Bank of Australia (RBA) in February. Previously, the NAB had forecasted a rate cut in May but has now moved its projection forward to the February RBA meeting.
The Reserve Bank of Australia released its January 2025 Bulletin, featuring a detailed analysis of how monetary policy changes influence interest rates in the economy and how fluctuations in interest rates impact economic activity and inflation.
Australian Dollar tests nine-day EMA barrier near descending channel’s upper boundary
AUD/USD hovers around 0.6210 on Tuesday, trading within the descending channel pattern on the daily chart, signaling a bearish bias. However, the 14-day Relative Strength Index (RSI) has rebounded toward the 50 level, signaling weakening downside momentum. A breakout above the channel and a sustained move above the 50 mark on the RSI could indicate a shift toward a bullish bias.
On the downside, the AUD/USD pair could test the descending channel’s lower boundary at the 0.6150 level. A break below the channel would guide the pair to navigate the region around 0.6087, the lowest since April 2020, recorded on February 3.
The AUD/USD pair tests its initial barrier at the nine-day Exponential Moving Average (EMA) of 0.6225, aligned with the upper boundary of the descending channel.
AUD/USD: Daily Chart
Australian Dollar PRICE Today
The table below shows the percentage change of Australian Dollar (AUD) against listed major currencies today. Australian Dollar was the strongest against the Japanese Yen.
USD
EUR
GBP
JPY
CAD
AUD
NZD
CHF
USD
-0.26%
-0.19%
0.31%
-0.76%
-0.44%
-0.41%
-0.09%
EUR
0.26%
0.07%
0.58%
-0.50%
-0.18%
-0.14%
0.17%
GBP
0.19%
-0.07%
0.48%
-0.57%
-0.26%
-0.22%
0.10%
JPY
-0.31%
-0.58%
-0.48%
-1.04%
-0.73%
-0.71%
-0.38%
CAD
0.76%
0.50%
0.57%
1.04%
0.31%
0.35%
0.68%
AUD
0.44%
0.18%
0.26%
0.73%
-0.31%
0.04%
0.38%
NZD
0.41%
0.14%
0.22%
0.71%
-0.35%
-0.04%
0.31%
CHF
0.09%
-0.17%
-0.10%
0.38%
-0.68%
-0.38%
-0.31%
The heat map shows percentage changes of major currencies against each other. The base currency is picked from the left column, while the quote currency is picked from the top row. For example, if you pick the Australian Dollar from the left column and move along the horizontal line to the US Dollar, the percentage change displayed in the box will represent AUD (base)/USD (quote).
Tariffs FAQs
Tariffs are customs duties levied on certain merchandise imports or a category of products. Tariffs are designed to help local producers and manufacturers be more competitive in the market by providing a price advantage over similar goods that can be imported. Tariffs are widely used as tools of protectionism, along with trade barriers and import quotas.
Although tariffs and taxes both generate government revenue to fund public goods and services, they have several distinctions. Tariffs are prepaid at the port of entry, while taxes are paid at the time of purchase. Taxes are imposed on individual taxpayers and businesses, while tariffs are paid by importers.
There are two schools of thought among economists regarding the usage of tariffs. While some argue that tariffs are necessary to protect domestic industries and address trade imbalances, others see them as a harmful tool that could potentially drive prices higher over the long term and lead to a damaging trade war by encouraging tit-for-tat tariffs.
During the run-up to the presidential election in November 2024, Donald Trump made it clear that he intends to use tariffs to support the US economy and American producers. In 2024, Mexico, China and Canada accounted for 42% of total US imports. In this period, Mexico stood out as the top exporter with $466.6 billion, according to the US Census Bureau. Hence, Trump wants to focus on these three nations when imposing tariffs. He also plans to use the revenue generated through tariffs to lower personal income taxes.
AUD/USD hovers above 0.6200, defending mild bids amid US tariff concerns and weak Chinese data.
US PCE data showed no surprises, Fed remains cautious.
RBA dovish bets continue to pressure the pair.
The Australian Dollar clings to mild gains on Friday, trading around 0.6215 after briefly touching a two-week low. The pair remains under pressure as US President Donald Trump reaffirmed plans to impose tariffs on Chinese imports, dampening risk sentiment.
Meanwhile, speculation over a potential rate cut by the Reserve Bank of Australia (RBA) in February and ongoing economic struggles in China continue to weigh on the Aussie.
Daily digest market movers: Aussie struggles on US tariffs concerns
US confirms 25% tariffs on Canada and Mexico, 10% on China, effective February 1.
US Dollar retreats as weak economic data erases weekly gains, pushing the DXY lower from its peak near 108.00.
China’s PMI data disappoints with manufacturing contracting and services barely expanding, pressuring the Aussie.
Iron ore prices hit yearly highs, offering mild support to AUD despite concerns over China’s weak demand.
Markets consider that the RBA cutting rates in February is a done deal, which is also weakening the Aussie.
On the US data front, the Personal Consumption Expenditures (PCE) Price Index, the Federal Reserve’s preferred inflation measure, rose by 0.3% MoM in December, following a 0.1% increase in November.
On an annual basis, the PCE inflation rate increased to 2.6% from the previous month’s 2.4%. The core PCE, which excludes food and energy prices, remained steady at 2.8% YoY for the third consecutive month.
Markets are expecting no rate cut by the Fed in March.
Technical outlook: AUD/USD struggles for direction
AUD/USD remains confined within a narrow range, facing resistance near 0.6230 while holding support at 0.6200. The Relative Strength Index (RSI) stands at 42 in negative territory, reflecting a lack of clear directional momentum. Meanwhile, the Moving Average Convergence Divergence (MACD) histogram prints decreasing green bars, suggesting fading bullish strength.
Despite recent recovery attempts, the Aussie’s upside potential appears limited. A break below 0.6200 could trigger further losses, while a move above 0.6230 may offer short-term relief.
Tariffs FAQs
Tariffs are customs duties levied on certain merchandise imports or a category of products. Tariffs are designed to help local producers and manufacturers be more competitive in the market by providing a price advantage over similar goods that can be imported. Tariffs are widely used as tools of protectionism, along with trade barriers and import quotas.
Although tariffs and taxes both generate government revenue to fund public goods and services, they have several distinctions. Tariffs are prepaid at the port of entry, while taxes are paid at the time of purchase. Taxes are imposed on individual taxpayers and businesses, while tariffs are paid by importers.
There are two schools of thought among economists regarding the usage of tariffs. While some argue that tariffs are necessary to protect domestic industries and address trade imbalances, others see them as a harmful tool that could potentially drive prices higher over the long term and lead to a damaging trade war by encouraging tit-for-tat tariffs.
During the run-up to the presidential election in November 2024, Donald Trump made it clear that he intends to use tariffs to support the US economy and American producers. In 2024, Mexico, China and Canada accounted for 42% of total US imports. In this period, Mexico stood out as the top exporter with $466.6 billion, according to the US Census Bureau. Hence, Trump wants to focus on these three nations when imposing tariffs. He also plans to use the revenue generated through tariffs to lower personal income taxes.
The Australian Dollar appreciates after the release of economic figures from China.
China’s GDP grew 5.4% YoY in Q4 of 2024 after reporting a 4.6% expansion in Q3.
US Retail Sales increased by 0.4% MoM in December, against the expected 0.6% growth.
The Australian Dollar (AUD) edges higher against the US Dollar (USD) following the economic data from China released on Friday. China’s economy grew 5.4% over the year in the fourth quarter of 2024 after reporting a 4.6% expansion in the third quarter. Data beat the market consensus of 5% in the reported period, by a wide margin.
Chinese Gross Domestic Product (GDP) rate rose 1.6% QoQ in Q4 2024, having increased 0.9% in the previous quarter. This figure matched the expectations of 1.6%. The annual December Retail Sales increased by 3.7% vs. the 3.5% expected and 3.0% prior, while Industrial Production arrived at 6.2% vs. the 5.4% forecast and November’s 5.4%.
The National Bureau of Statistics (NBS) shared its outlook on the economy during a press conference on Friday. The NBS highlighted that economic operations continue to face significant difficulties and challenges. It noted that the impact of changes in the external environment is intensifying, while domestic demand remains insufficient.
Australia’s seasonally adjusted Unemployment Rate rose to 4.0% in December, compared to 3.9% in November, aligning with market expectations. Employment increased by 56.3K in December, up from 28.2K in November (revised from 35.6K) and significantly exceeding the market forecast of 15.0K.
Bjorn Jarvis, head of labor statistics at the ABS, highlighted key data points: “The employment-to-population ratio rose 0.1% percentage points to a new record of 64.5%. This was 0.5 percentage points higher than a year ago and 2.3 percentage points above pre-COVID-19 levels. The increase in both employment and unemployment led to a further rise in the participation rate, which reflects the proportion of the population either employed or actively seeking work.”
Australian Dollar advances as US Dollar remains subdued amid weaker US Retail Sales data
The US Dollar Index (DXY), which measures the US Dollar’s performance against six major currencies, trades near 109.00. The Greenback edges lower after the weaker US Retail Sales data.
US Retail Sales rose by 0.4% MoM in December, reaching $729.2 billion. This reading was weaker than the market expectations of a 0.6% rise and lower than the previous reading of a 0.8% increase (revised from 0.7%).
Chicago Federal Reserve Bank President Austan Goolsbee stated on Thursday that he has grown increasingly confident over the past several months that the job market is stabilizing at a level resembling full employment, rather than deteriorating into something worse, according to Reuters.
The US Consumer Price Index increased by 2.9% year-over-year in December, up from 2.7% in November, aligning with market expectations. Monthly, CPI rose 0.4%, following a 0.3% increase in the previous month.
US Core CPI, which excludes volatile food and energy prices, rose 3.2% annually in December, slightly below November’s figure and analysts’ forecasts of 3.3%. Monthly, core CPI edged up 0.2% in December 2024.
US Producer Price Index for final demand rose 0.2% MoM in December after an unrevised 0.4% advance in November, softer than the 0.3% expected. The PPI climbed 3.3% YoY in December, the most since February 2023, after increasing 3.0% in November. This reading came in below the consensus of 3.4%.
On Wednesday, Scott Bessent, Donald Trump’s nominee for Treasury Secretary, emphasized the importance of maintaining the US Dollar as the world’s reserve currency for the nation’s economic stability and future prosperity. Bessent stated “Productive investment that grows the economy must be prioritized over wasteful spending that drives inflation,” per Bloomberg.
The Federal Reserve reported in its latest Beige Book survey, released on Wednesday, that economic activity saw slight to moderate growth across the twelve Federal Reserve Districts in late November and December. Consumer spending increased moderately, driven by strong holiday sales that surpassed expectations. However, manufacturing activity experienced a slight decline overall, as some manufacturers stockpiled inventories in anticipation of higher tariffs.
Technical Analysis: Australian Dollar remains above 0.6200 support near 14-day EMA
The AUD/USD pair trades near 0.6220 on Friday, attempting to break above the descending channel on the daily chart. A successful breakout would weaken the prevailing bearish bias. The 14-day Relative Strength Index (RSI) also trends upward toward the 50 level, signaling potential recovery momentum.
The AUD/USD pair encounters immediate resistance at the upper boundary of the descending channel, approximately at 0.6220.
On the downside, initial support is seen at the 14-day Exponential Moving Average (EMA) at 0.6213, followed by the nine-day EMA at 0.6206. A more substantial support level is located near the lower boundary of the descending channel, around the 0.5920 mark.
AUD/USD: Daily Chart
Australian Dollar PRICE Today
The table below shows the percentage change of Australian Dollar (AUD) against listed major currencies today. Australian Dollar was the strongest against the Japanese Yen.
USD
EUR
GBP
JPY
CAD
AUD
NZD
CHF
USD
-0.05%
-0.05%
0.12%
0.01%
-0.03%
-0.07%
-0.04%
EUR
0.05%
-0.01%
0.19%
0.06%
0.01%
-0.02%
0.00%
GBP
0.05%
0.01%
0.17%
0.07%
0.03%
-0.01%
0.01%
JPY
-0.12%
-0.19%
-0.17%
-0.10%
-0.16%
-0.21%
-0.18%
CAD
-0.01%
-0.06%
-0.07%
0.10%
-0.05%
-0.08%
-0.06%
AUD
0.03%
-0.01%
-0.03%
0.16%
0.05%
-0.04%
-0.02%
NZD
0.07%
0.02%
0.01%
0.21%
0.08%
0.04%
0.03%
CHF
0.04%
-0.00%
-0.01%
0.18%
0.06%
0.02%
-0.03%
The heat map shows percentage changes of major currencies against each other. The base currency is picked from the left column, while the quote currency is picked from the top row. For example, if you pick the Australian Dollar from the left column and move along the horizontal line to the US Dollar, the percentage change displayed in the box will represent AUD (base)/USD (quote).
Economic Indicator
Gross Domestic Product (YoY)
The Gross Domestic Product (GDP), released by the National Bureau of Statistics of China on a monthly basis, is a measure of the total value of all goods and services produced in China during a given period. The GDP is considered as the main measure of China’s economic activity. The YoY reading compares economic activity in the reference quarter compared with the same quarter a year earlier. Generally speaking, a rise in this indicator is bullish for the Renminbi (CNY), while a low reading is seen as bearish.
Slight increase in upward momentum is likely to lead to a higher trading range of 0.6170/0.6215. Australian Dollar (AUD) is expected to trade in a range, probably between 0.6130 and 0.6240, UOB Group’s FX analysts Quek Ser Leang and Peter Chia note.
Slight increase in upward momentum
24-HOUR VIEW: “Yesterday, we noted that the outlook for AUD ‘is mixed.’ We were of the view that it ‘may trade in a range, probably between 0.6140 and 0.6205.’ AUD traded in a narrower range than expected (0.6167/0.6207), closing higher by 0.31% at 0.6195. There has been a slight increase in upward momentum. However, this will likely lead to a higher trading range of 0.6170/0.6215 instead of a sustained advance.”
1-3 WEEKS VIEW: “We highlighted yesterday (14 Jan, spot at 0.6180) that ‘the buildup in downward momentum is fading quickly, and if AUD were to break above 0.6205 (‘strong resistance’ level), it would mean it is likely to trade in a range instead of declining to 0.6100.’ Our ‘strong resistance’ level was slightly breached as AUD rose to a high of 0.6207. From here, we expect AUD to trade in a range, probably between 0.6140 and 0.6240.”
The Australian Dollar depreciated as Australia’s trimmed mean fell to an annual 3.2% from 3.5%.
Australia’s monthly Consumer Price Index increased by 2.3% YoY in November, the highest level recorded since August.
The US Dollar appreciated as the 10-year yield on US Treasury bonds rose by over 1% on Tuesday.
The Australian Dollar (AUD) faced challenges for the second consecutive session against the US Dollar (USD), with the AUD/USD pair holding losses despite stronger-than-expected monthly inflation data released on Wednesday. Traders are now focused on the upcoming FOMC Minutes, scheduled for release later in the day, as well as the US jobs data, including the Nonfarm Payroll (NFP) report on Friday, for additional insights into policy direction.
However, the trimmed mean, a closely watched measure of core inflation, fell to an annual 3.2% from 3.5%, edging closer to the Reserve Bank of Australia’s (RBA) target band of 2% to 3%. Traders are currently pricing in a 55% probability that the RBA will lower its cash rate by 25 basis points to 4.35% in February, with a full quarter-point cut expected by April.
Australia’s monthly Consumer Price Index (CPI) rose 2.3% year-over-year in November, surpassing the market forecast of 2.2% and marking an increase from the 2.1% rise seen in the previous two months. This is the highest reading since August. However, the figure remains within the RBA’s target range of 2–3% for the fourth consecutive month, aided by the ongoing impact of the Energy Bill Relief Fund rebate.
The Australian Bureau of Statistics reported on Tuesday that permits for new construction projects in Australia dropped by 3.6% month-on-month to 14,998 units in November 2024, falling short of market expectations for a 1.0% decline. This downturn followed an upwardly revised 5.2% increase in October, marking the first decrease in three months.
The People’s Bank of China (PBoC) is collaborating with the State Planner to bolster the country’s economy. PBoC official Peng Lifeng announced that the central bank will assist banks in expanding loans under the trade-in initiative.
Australian Dollar declines due to hawkish shift in Fed’s rate trajectory
The US Dollar Index (DXY), which measures the US Dollar’s (USD) performance against six major currencies, holds its position above 108.50 at the time of writing.
The US Dollar strengthened as the 10-year yield on US Treasury bonds rose by over 1% in the previous session, currently standing at 4.67%. This spike is a stark reminder of the shifting investor sentiment regarding the Federal Reserve’s interest rate trajectory.
The US ISM Services PMI increased to 54.1 in November, up from 52.1, exceeding the market expectation of 53.3. The Prices Paid Index, which reflects inflation, rose significantly to 64.4 from 58.2, while the Employment Index dipped slightly to 51.4 from 51.5.
The US ISM Manufacturing PMI improved to 49.3 in December, from 48.4 in November. This reading came in better than the market expectation of 48.4.
According to Bloomberg, Federal Reserve Bank of Atlanta President Raphael Bostic stated on Tuesday that Fed officials should exercise caution with policy decisions due to uneven progress in reducing inflation. Bostic emphasized the need to lean toward keeping interest rates elevated to ensure the achievement of price stability goals.
Richmond Fed President Thomas Barkin highlighted on Friday that the benchmark policy rate should remain restrictive until there is greater confidence that inflation will return to the 2% target.
Fed Governor Adriana Kugler and San Francisco Fed President Mary Daly underscored the challenging balancing act facing US central bankers as they aim to slow the pace of monetary easing this year.
Traders are cautious regarding President-elect Trump’s economic policies, fearing that tariffs could increase the cost of living. These concerns were compounded by the Federal Open Market Committee’s (FOMC) recent projections, which indicated fewer rate cuts in 2025, reflecting caution amid persistent inflationary pressures.
Technical Analysis: Australian Dollar moves below nine-day EMA toward 0.6200
AUD/USD trades near 0.6210 on Wednesday, maintaining its bearish outlook as it remains confined within a descending channel on the daily chart. The 14-day Relative Strength Index (RSI) retreats toward the 30 level, signaling a potential intensification of bearish momentum.
On the downside, the AUD/USD pair may navigate the region around the lower boundary of the descending channel, at the 0.5990 level.
The AUD/USD pair may test the immediate resistance around the nine-day Exponential Moving Average (EMA) at 0.6224, followed by the 14-day EMA at 0.6239. A further barrier appears around the upper boundary of the descending channel, at 0.6270 level.
AUD/USD: Daily Chart
Australian Dollar PRICE Today
The table below shows the percentage change of Australian Dollar (AUD) against listed major currencies today. Australian Dollar was the strongest against the Japanese Yen.
USD
EUR
GBP
JPY
CAD
AUD
NZD
CHF
USD
-0.06%
-0.02%
0.22%
-0.06%
0.00%
0.03%
-0.00%
EUR
0.06%
0.04%
0.26%
-0.01%
0.06%
0.09%
0.05%
GBP
0.02%
-0.04%
0.26%
-0.05%
0.02%
0.05%
0.01%
JPY
-0.22%
-0.26%
-0.26%
-0.28%
-0.21%
-0.19%
-0.22%
CAD
0.06%
0.00%
0.05%
0.28%
0.07%
0.10%
0.06%
AUD
-0.01%
-0.06%
-0.02%
0.21%
-0.07%
0.03%
-0.01%
NZD
-0.03%
-0.09%
-0.05%
0.19%
-0.10%
-0.03%
-0.04%
CHF
0.00%
-0.05%
-0.01%
0.22%
-0.06%
0.00%
0.04%
The heat map shows percentage changes of major currencies against each other. The base currency is picked from the left column, while the quote currency is picked from the top row. For example, if you pick the Australian Dollar from the left column and move along the horizontal line to the US Dollar, the percentage change displayed in the box will represent AUD (base)/USD (quote).
Economic Indicator
FOMC Minutes
FOMC stands for The Federal Open Market Committee that organizes 8 meetings in a year and reviews economic and financial conditions, determines the appropriate stance of monetary policy and assesses the risks to its long-run goals of price stability and sustainable economic growth. FOMC Minutes are released by the Board of Governors of the Federal Reserve and are a clear guide to the future US interest rate policy.