Tag: NASDAQ

  • Forex Steadies Despite Fresh Tariff Escalations, Euro Starting to Retreat

    Forex Steadies Despite Fresh Tariff Escalations, Euro Starting to Retreat


    Forex markets are holding steady in Asian session today, with major currency pairs and crosses all confined within yesterday’s ranges. This lack of movement comes despite a significant escalation in the US-led trade war, as newly effective 25% tariffs on all imported steel and aluminum products have prompted swift retaliation from key trading partners.

    In swift response, European Commission President Ursula von der Leyen announced that the EU would implement retaliatory tariffs of equal value, totaling USD 28B, on a range of U.S. goods beyond just metals. These measures, set to take effect on April 1, will target products including textiles, home appliances, and agricultural goods. Meanwhile, Canada—the largest supplier of steel and aluminum to the U.S.—is hitting back with USD 20.7B in countermeasures, including a 25% tariff on steel products and increased taxes on US imports ranging from computers and servers to sports equipment and cast-iron products.

    The UK has so far taken a more measured stance, with Prime Minister Keir Starmer stating that his government is adopting a “pragmatic approach” while keeping “all options on the table.” Australia, on the other hand, has opted against imposing retaliatory tariffs for now. Instead, Prime Minister Anthony Albanese has urged Australians to support local industries in response to Trump’s refusal to grant an exemption for Australian steel and aluminum.

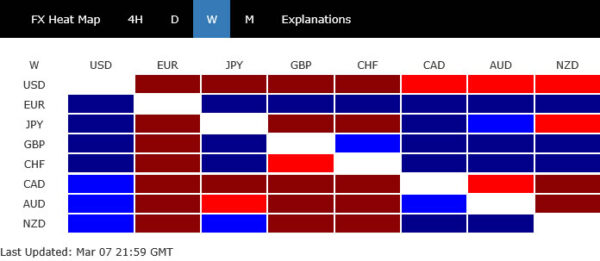
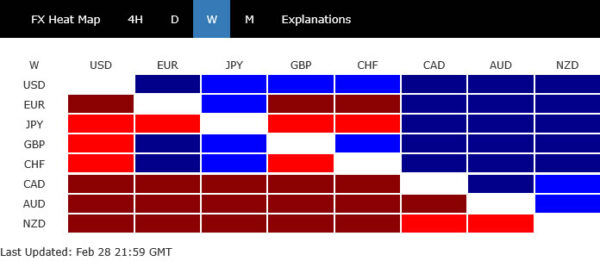
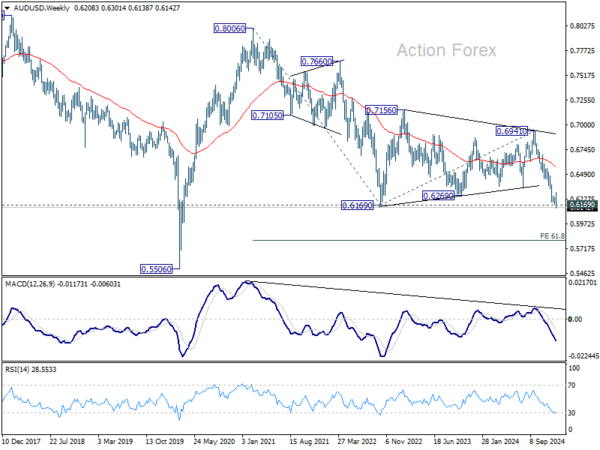
    On the currency front, Swiss Franc is so far the weakest performer this week, followed by Loonie and then Dollar. Euro remains the strongest but has begun to pull back in some crosses, with Sterling and Kiwi following. Yen and Aussie are positioned in the middle.

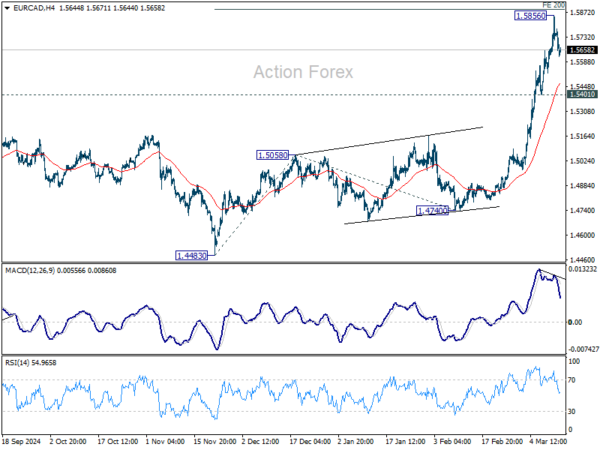
    Technically, EUR/CAD could have formed a short term top at 1.5856, ahead of 200% projection of 1.4483 to 1.5058 from 1.4740 at 1.5890. Some consolidations would be seen with risk of deeper retreat to 55 4H EMA (now at 1.5470). But downside should be contained by 1.5401 support to bring rebound, and up trend resumption later.

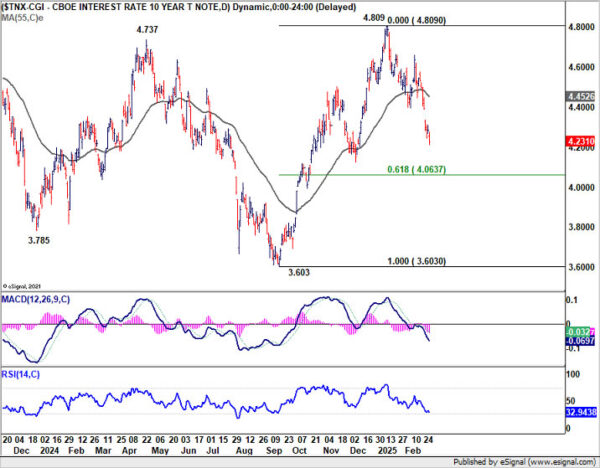
    In Asia, at the time of writing, Nikkei is up 0.09%. Hong Kong HSI is down -1.44%. China Shanghai SSE is down -0.73%. Singapore Strait Times is down -0.03%. Japan 10-year JGB yield is up 0.017 at 1.541. Overnight, DOW fell -0.20%. S&P 500 rose 0.49%. NASDAQ rose 1.22%. 10-year yield rose 0.030 to 4.318.

    BoJ’s Ueda expects real wages to rise, boosting consumption

    BoJ Governor Kazuo Ueda signaled optimism about Japan’s economic outlook, telling the parliament today that “import-cost-driven inflation” is expected to moderate while wages continue to “rise steadily.” This shift could lead to an improvement in real wages and consumption, a critical factor for sustaining domestic demand.

    Ueda’s comments align with recent developments in Japan’s annual “shunto” wage negotiations, which have resulted in record pay hikes across major companies.

    Hitachi announced a record 6.2% rise in monthly wages, fully meeting union demands. Toyota’s key auto parts supplier, Denso, also committed to historic pay hikes, while Toyota itself stated that the overall wage increase for its manufacturing staff would match last year’s levels—the highest seen since 1999.

    Further clarity on the scale of wage hikes will come on March 14, when Rengo, Japan’s largest labor union federation representing 7 million workers, releases its preliminary report. Rengo had been seeking an average wage increase of 6.09%, up from last year’s 5.85%.

    US stocks find temporary support, but downside risks persist

    Risk sentiment showed signs of stabilization in the US overnight, with S&P 500 and NASDAQ posting gains. However, stocks are merely digesting recent steep losses rather than having a decisive turnaround.

    The reaction to lower-than-expected US consumer inflation data was relatively muted. The market’s cautious interpretation of the data is justified, as the latest CPI figures do not yet capture the full effects of tariff-related price pressures. There is still a lack clarity on how inflation will evolve under the new tariff regime, particularly when reciprocal tariffs come into play on April 2. Nevertheless, for the moment at least, disinflationary momentum is leaning in the Fed’s favor.

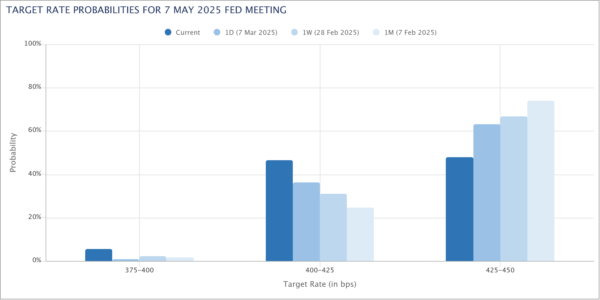
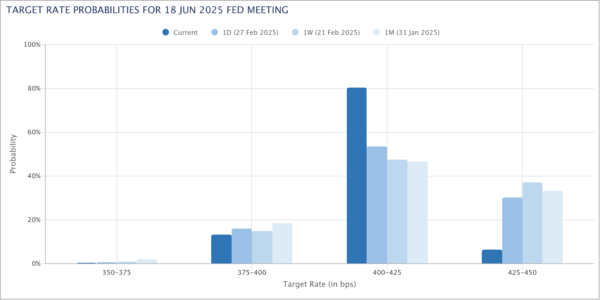
    Interestingly, market pricing has shifted the expected timing of Fed’s next rate cut back from May to June. Futures now show just 31% probability of a 25bps cut in May, while the odds for a June cut have climbed to 78%.

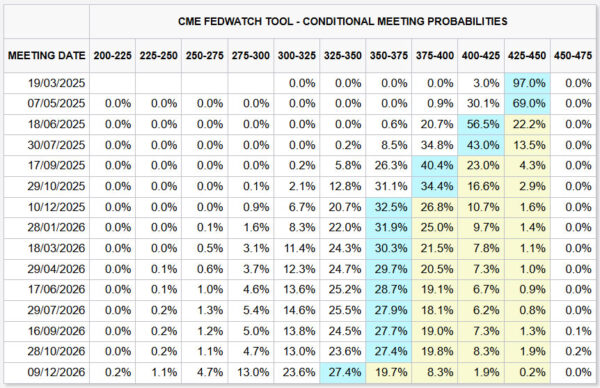
    Traders appear to believe Fed will need additional time to assess the economic impact of tariffs before making a policy move. From a timing perspective, June would align better with Fed’s next round of economic projections, allowing policymakers to incorporate more data into their decision-making.

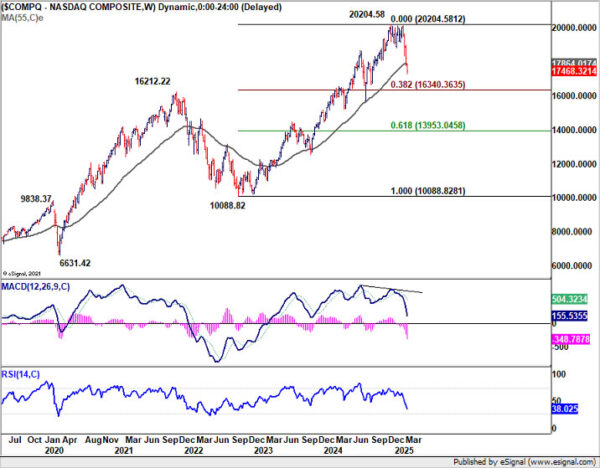
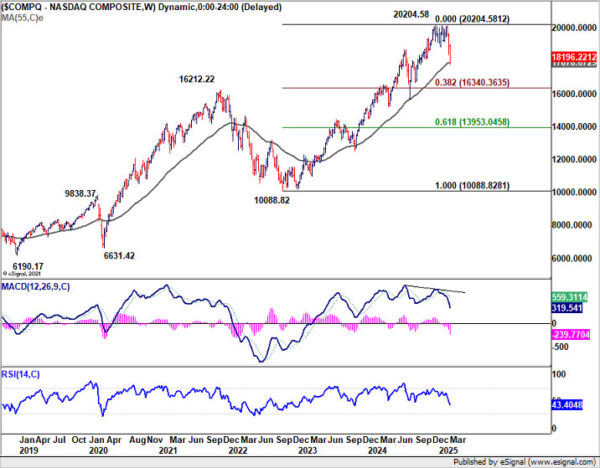
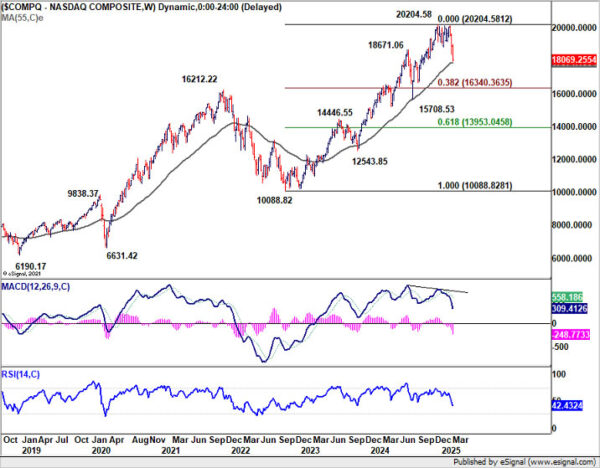
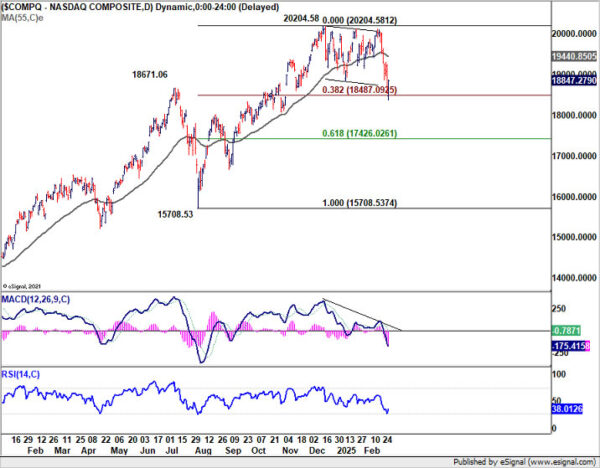
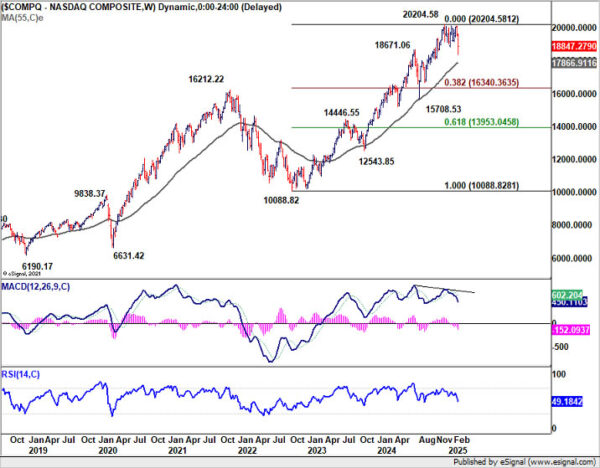
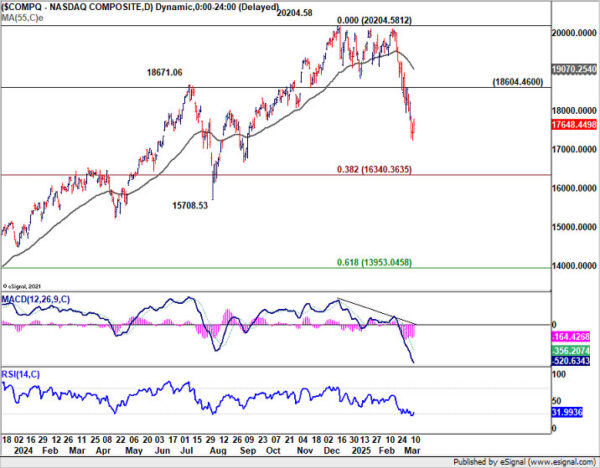
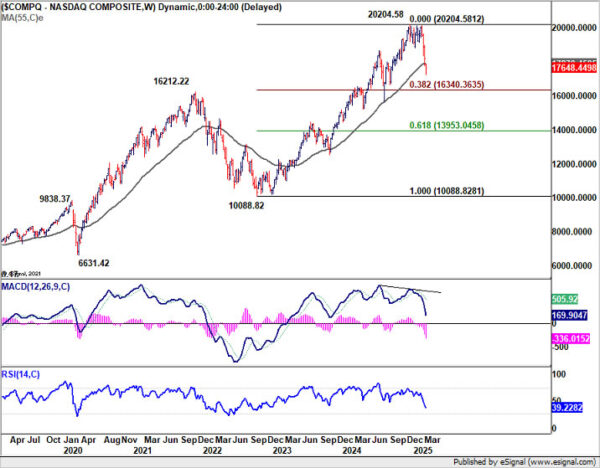
    As for NASDAQ, oversold condition as seen in D RSI could start to slow downside momentum, and some near term consolidations cannot be ruled out. But risk will stay on the downside as long as 18604.46 resistance holds. Fall from 20204.58 is seen as a correction to the whole up trend from 10088.82 (2022 low) at least. It should extend to 38.2% retracement of 10088.82 to 20204.58 at 16340.36 before bottoming.

    Gold gains as markets await Russia’s response to ceasefire proposal

    Gold picked up momentum as investors closely monitor Kremlin’s response to the proposed ceasefire deal in Ukraine, as US officials head to Russia for negotiations.

    Russia has yet to publicly endorse an immediate ceasefire, but has indicated that it is reviewing the plan, and a phone call between US President Donald Trump and Russian President Vladimir Putin is on the table.

    However, Trump remains skeptical, stating that while he has received “positive messages” about the ceasefire, such reassurances “mean nothing” without concrete action from Putin.

    Trump also warned that if Putin refuses to sign the deal, the US could take “financially very bad” actions against Russia, likely hinting at severe sanctions.

    Ukrainian President Volodymyr Zelenskyy said earlier in the week that stronger Western financial and military support would follow should the ceasefire negotiations fail.

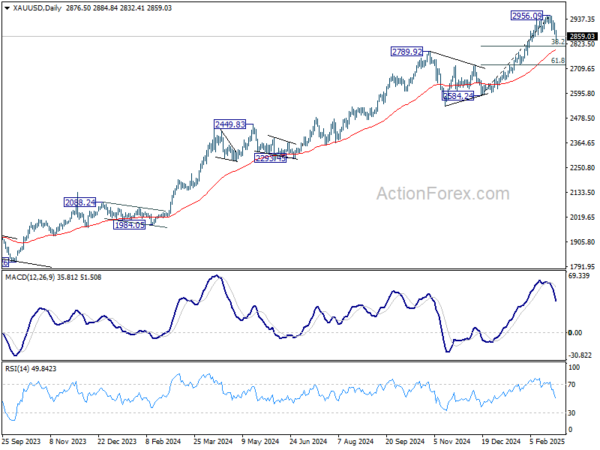
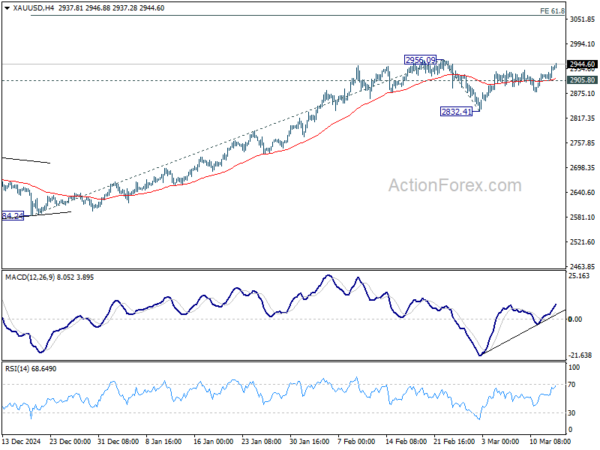
    Technically, Gold’s near term rebound from 2832.41 extended higher today and focus is now on 2956.09 resistance. Decisive break there will resume the larger up trend to 3000 psychological, and possibly further to 61.8% projection of 2584.24 to 2956.09 from 2832.41 at 3062.21.

    However, break of 2905.80 support should extend the corrective pattern from 2956.09 with another falling leg back to 2832.41 and possibly below.

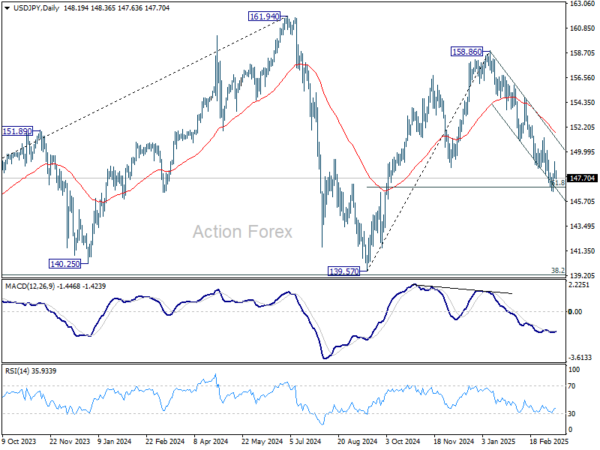
    USD/JPY Daily Outlook

    Daily Pivots: (S1) 147.51; (P) 148.35; (R1) 149.10; More…

    Intraday bias in USD/JPY remains neutral for the moment, and more consolidations could be seen above 146.52. Upside of recovery should be limited by 150.92 support turned resistance. On the downside, sustained trading below 61.8% retracement of 139.57 to 158.86 at 146.32 will pave the way to 139.57 support.

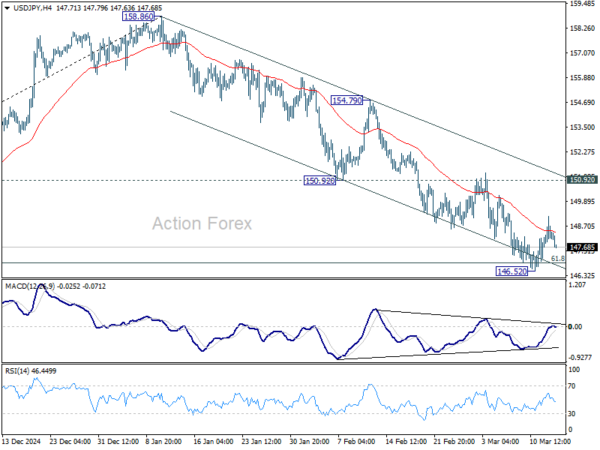
    In the bigger picture, price actions from 161.94 are seen as a corrective pattern to rise from 102.58 (2021 low), with fall from 158.86 as the third leg. Strong support should be seen from 38.2% retracement of 102.58 to 161.94 at 139.26 to bring rebound. However, sustained break of 139.26 would open up deeper medium term decline to 61.8% retracement at 125.25.

    Economic Indicators Update

    GMT CCY EVENTS ACT F/C PP REV
    00:00 AUD Consumer Inflation Expectations Mar 3.60% 4.60%
    00:01 GBP RICS Housing Price Balance Feb 11% 20% 22%
    07:30 CHF Producer and Import Prices M/M Feb 0.20% 0.10%
    07:30 CHF Producer and Import Prices Y/Y Feb -0.30%
    10:00 EUR Eurozone Industrial Production M/M Jan 0.80% -1.10%
    12:30 USD Initial Jobless Claims (Mar 7) 224K 221K
    12:30 CAD Building Permits M/M Jan -4.80% 11.00%
    12:30 USD PPI M/M Feb 0.30% 0.40%
    12:30 USD PPI Y/Y Feb 3.30% 3.50%
    12:30 USD PPI Core M/M Feb 0.30% 0.30%
    12:30 USD PPI Core Y/Y Feb 3.60% 3.60%
    14:30 USD Natural Gas Storage -46B -80B


    Source link

  • Recession Fears Weigh on Markets as Risk-Off Trade Intensifies

    Recession Fears Weigh on Markets as Risk-Off Trade Intensifies


    The risk-off sentiment that triggered the biggest US stock market selloff in months has spilled over into Asian markets, leading to broad declines across the region. The currency markets reflect this shift too, with traditional safe havens such as Japanese Yen and Swiss franc leading gains in Asia, while risk-sensitive currencies like the Australian and New Zealand Dollars face pressure.

    Unlike previous bouts of risk aversion, Dollar is not benefiting from the current flight to safety. This time, the core of the problem originates from the US economy itself, where recession worries are intensifying. Rather than flocking to the greenback, investors appear to be diversifying into other safe havens or moving to the sidelines until the dust settles.

    The uncertainty surrounding US trade policies has left businesses and consumers hesitant, potentially dragging economic growth lower. In response to the changing economic outlook, market participants are increasingly convinced that Fed will resume policy easing within the first half of the year. The only question is whether the next rate cut will arrive in May or June.

    Another driver of Dollar weakness is the extending decline in yields since mid January. Technically, there is prospect for 10-year yield to draw support from 4.000 psychological level, which is slightly below 61.8% retracement of 3.603 to 4.809 at 4.063, to form a near term bottom. However, there is little prospect for 10-year yield to rebound strongly through 55 D EMA (now at 4.412). But at least, sideway movement in 10-year yield could help lift the pressure on Dollar.

    Overall for the week so far, Yen is the best performer, followed by Euro, and then Swiss Franc. Aussie is the worst, followed by Loonie and then Kiwi. Dollar and Sterling are positioning in the middle.

    In Asia, at the time of writing, Nikkei is down -1.02%. Hong Kong HSI is down -1.02%. China Shanghai SSE is down -0.50%. Singapore Strait Times is down -2.02%. Japan 10-year JGB yield is down -0.063 at 1.509. Overnight, DOW fell -2.08%. S&P 500 fell -2.70%. NASDAQ fell -4.00%. 10-year yield fell -0.104 to 4.213.

    US stock market correction deepens as recession fears take hold

    The US stock market suffered its most significant setback in months, with the S&P 500 dropping -2.7%, its biggest one-day decline since December 18. NASDAQ also lost -4.0%, marking its worst single-day percentage loss since September 2022. Analysts widely point to mounting recession worries as the primary catalyst behind the selloff.

    Initial concerns emerged over the past month following a series of weaker economic data points, believed by some to be early reactions to an increasingly contentious tariff policy. These worries intensified after recent remarks from the White House suggested a bumpy economic outlook ahead.

    In an interview aired on Sunday, US President Donald Trump fueled apprehensions further by describing the economy as going through “a period of transition.” When pressed about an impending recession, he avoided a direct prediction but acknowledged potential “disruption.” His remarks—“Look, we’re going to have disruption, but we’re OK with that”—did little to reassure investors already on edge about growth prospects.

    Adding further weight to recession fears, historical bond market indicators have been flashing warning signs. The 10-year to 2-year US yield curve inverted in mid-2022—a classic recession signal—and only turned positive again in September 2024. Historically, a U.S. recession tends to follow within months after the yield curve normalizes (i.e., turned positive again). If this trend holds true, the US economy could be inching closer to a downturn.

    However, another view posits that tariffs are a distraction and that the real driver behind the US selloff is the recent surge in Japanese government bond yields, which have hit a 16-year high. As the carry trade unwinds—where investors borrow in low-yield currencies, often involving Japanese Yen, to fund investments in higher-yield or high-growth assets—capital is flowing out of big tech names, contributing to the NASDAQ’s outsized losses.

    Technically, NASDAQ’s strong break of 55 W EMA (now at 17864.01) suggests that it’s already in correction to the up trend from 10088.82 (2022 low). Deeper fall should be seen to 38.2% retracement of 10088.82 to 20204.58 at 16340.36. Reaction from there will decide whether it’s merely in a medium consolidations phase or in an out-right bearish trend reversal.

    As for DOW, immediate focus is now on 41844.89 support. Firm break there will complete a double top reversal pattern (45073.63, 45054.36). That should set up deeper fall to 38.2% retracement of 32327.20 to 45073.63 at 40204.49 at least, even it’s just a correction to the rise from 32327.20.

    Australia Westpac consumer sentiment jumps to 95.9, soft landing achieved

    Australian consumer sentiment saw a strong rebound in March, with Westpac Consumer Sentiment Index jumping 4.0% mom to 95.9, the highest level in three years and not far from neutral 100 mark.

    Westpac attributed the improvement to slowing inflation and February’s RBA interest rate cut which have lifted confidence across households. positive views on job security suggest that “soft landing has been achieved”. Nevertheless, “unsettling overseas news” continues to weigh on the broader economic outlook.

    Looking ahead to RBA’s upcoming meeting on March 31-April 1, Westpac expects the central bank to keep the cash rate unchanged. RBA was clear that the 25bps cut in February “did not mean further reductions could be expected at subsequent meetings.”

    Westpac added, “further slowing in inflation will give the RBA sufficient confidence to deliver more rate cuts this year with the next move coming at the May meeting”.

    Australia’s NAB business confidence slips back into negative as cost pressures persist

    Australia’s NAB Business Confidence fell from 5 to -1 in February, erasing last month’s gain and returning to below-average levels. While business conditions improved slightly from 3 to 4, the decline in confidence suggests that businesses remain cautious despite RBA’s recent rate cut and positive Q4 GDP data.

    NAB Chief Economist Alan Oster noted that the lift in sentiment seen in January was not sustained, signaling ongoing uncertainty in the business environment. Persistent cost pressures and subdued profitability appear to be key factors weighing on sentiment, keeping confidence below long-term norms.

    Within business conditions, trading conditions ticked up from 7 to 8, and profitability conditions rose slightly from -2 to -1, though still remaining in negative territory. Employment conditions, however, weakened from 5 to 4.

    Cost pressures remain a concern, with purchase cost growth accelerating from 1.1% to 1.5% in quarterly equivalent terms. On the positive side, labor cost growth eased from 1.7% to 1.5%, indicating that wage price pressures are gradually cooling. Meanwhile, final product price growth slowed from 0.8% to 0.5%, though retail price inflation held steady at 1.0%.

    EUR/AUD Daily Outlook

    Daily Pivots: (S1) 1.7149; (P) 1.7213; (R1) 1.7320; More…

    EUR/AUD’s rally resumed and brief consolidations and intraday is back on the upside. Rise from 1.6335 should now target 161.8% projection of 1.5963 to 1.6800 from 1.6355 at 1.7709 next. On the downside, below 1.7102 minor support will turn intraday bias neutral again and bring consolidations, before staging another rally.

    In the bigger picture, up trend from 1.4281 (2022 low) is resuming. Sustained trading above 1.7180 key resistance will pave the way to 61.8% projection of 1.4281 to 1.7062 from 1.5963 at 1.7682, which is also close to 61.8% retracement of 1.9799 (2020 high) to 1.4281 at 1.7691. For now, this will remain the favored case as long as 1.6355 support holds, even in case of deep pullback.

    Economic Indicators Update

    GMT CCY EVENTS ACT F/C PP REV
    21:45 NZD Manufacturing Sales Q4 2.60% -1.20% 0.20%
    23:30 AUD Westpac Consumer Confidence Mar 4.00% 0.10%
    23:30 JPY Overall Household Spending Y/Y Jan 0.80% 3.60% 2.70%
    23:50 JPY GDP Q/Q Q4 F 0.60% 0.70% 0.70%
    23:50 JPY GDP Deflator Y/Y Q4 F 2.90% 2.80% 2.80%
    23:50 JPY Money Supply M2+CD Y/Y Feb 1.20% 1.40% 1.30%
    00:30 AUD NAB Business Confidence Feb -1 4 5
    00:30 AUD NAB Business Conditions Feb 4 3
    06:00 JPY Machine Tool Orders Y/Y Feb P 4.70%
    10:00 USD NFIB Business Optimism Index Feb 101 102.8


    Source link

  • A Multi-Decade Trend Reversal Underway in EUR/USD?

    A Multi-Decade Trend Reversal Underway in EUR/USD?


    The sharp contrast between Europe’s newfound unity and the ongoing tariff chaos in the US has been a defining theme in the financial markets. Euro’s extraordinary strength last week reflected growing investor confidence in the region’s strategic shift toward fiscal expansion and defense spending. From the formation of the “Coalition of the Willing” to the ReArm Europe initiative, they highlighted a strong, coordinated response to challenges, be it geopolitical or economic. That could set the stage for a long-term structural shift in European markets.

    Meanwhile, the US continued to grapple with trade policy uncertainty, with tariffs now more seen as a drag on sentiment and economic growth rather than a source of inflationary pressure. The recent exemptions granted to Canada and Mexico only reinforced the perception of inconsistency in Washington’s trade strategy. The lack of clarity on future policy moves has started to weigh on investor sentiment. That, if persists, could lead to a outflow of capital from the US and weakening the Dollar further.

    From a technical points of view, EUR/USD has shown clear signs of a potential long-term bullish reversal. The pair’s strong surge last week suggests that the multi-year downtrend may have bottomed out, with further upside potential if Europe successfully executes its ambitious fiscal and defense spending plans. However, challenges remain, including implementation risks and the broader impact of trade tensions on European exports.

    Currency market performance last week reflected the shifting sentiment. Euro ended as the strongest performer, followed by Sterling and Swiss Franc, which also benefited from Europe’s renewed economic confidence.

    On the other hand, Dollar closed as the worst performer, struggling under the weight of investor skepticism and diminishing safe-haven appeal. Elsewhere, Canadian Dollar and Australian Dollar also underperformed, indicating that risk-off sentiment remains present, particularly in the US. Yen and Kiwi positioned themselves in the middle of the performance spectrum.

    Europe’s Bold Shift Ignites Market Optimism

    Last week brought a seismic shift in Europe’s geopolitical, defense, and fiscal policies. In a move not seen in decades, the region is asserting greater strategic independence while ramping up economic stimulus. The changes were embraced by investors with enthusiasm, fueling rallies in European assets, particularly in Euro and German equities.

    Euro surged 4.4% against Dollar, its best weekly performance since 2009. Meanwhile, Germany’s 10-year yield posted its biggest jump since the fall of the Berlin Wall. DAX hit fresh record highs, with cyclical and defense-related stocks leading the charge.

    At the heart of this shift is the “ReArm Europe” initiative, which commits the EU to a significant defense buildup. European Commission President Ursula von der Leyen has proposed mechanisms to mobilize up to EUR 800B in special funds. This landmark decision not only strengthens military readiness, but also reduces reliance on external allies.

    Further reinforcing this new direction, EU leaders took a bold stand against Hungarian Prime Minister Viktor Orbán, overriding his veto on aid to Ukraine. In an unusual move, member states issued a separate statement reaffirming their unified support for Kyiv.

    Meanwhile, in Germany, despite ongoing coalition talks, CDU leader Friedrich Merz wasted no time aligning with the SPD to push for loosening of the “debt brake”, which would unlock EUR 500B for infrastructure projects. Additionally, defense spending above 1% of GDP will be permanently exempt from fiscal constraints. Over the next decade, these measures could increase government spending by a staggering 20% of GDP. The scale surpasses even that seen after German reunification in the 1990s.

    This massive fiscal shift in Germany carries significant upside potential for both domestic and Eurozone growth. With a sharp boost in public spending, it could also act as a buffer against potential US tariffs. For years, European growth has been held back by fiscal conservatism—but now, these bold new policies could reshape the region’s economic future for years to come.

    Technically, DAX might be rebuilding upside momentum as seen in D MACD. Current up trend should head to take on 161.8% projection of 14630.21 to 18892.92 from 17024.82 at 23921.87. Decisive break there would target 200% projection at 25550.22 next. Nevertheless, firm break of 22226.34 support will suggest DAX has topped for the near term at least, and consolidations should follow first.

    Is Euro Entering a Long-Term Bull Cycle?

    As Europe embarks on a new era of fiscal expansion and policy coordination, Euro’s looks well-positioned for a prolonged rally and with prospects of long term bullish trend reversal.

    Another key factor supporting Euro is the growing belief that ECB is nearing a pause in its policy easing cycle. With monetary policy now “meaningfully less restrictive”, as described by President Christine Lagarde, a pause could start as soon as in April. ECB could opt for a wait-and-see approach, to assess how trade policy, fiscal initiatives, and broader geopolitical risks play out.

    However, key risks remain, including escalation in trade disputes with the US, as well as how effectively Europe executes its ambitious spending plans. The coming months will be crucial in determining whether this historic shift translates into sustained economic momentum or if internal and external headwinds slow down the Euro’s resurgence.

    Technically, EUR/USD’s strong rally suggests that fall from 1.1274 (2023 high) has completed as a correction, with three waves down to 1.0176. Firm break of 1.1274 would resume larger rally from 0.9534 (2022 low), to 100% projection of 0.9534 to 1.1274 from 1.0176 at 1.1916.

    More significantly, if the bullish case is realized, that would push EUR/USD through the two-decade falling channel resistance, which could be an important sign of long term trend reversal.

    US Stocks at Risk of Bearish Trend Reversal Amid Tariff Chaos

    US stocks endured a turbulent week as investors wrestled with the unpredictable nature of President Donald Trump’s trade policies. The volatility has taken a clear toll on market sentiment, with technical indicators increasingly pointing to bearish trend reversal in major indexes. The coming weeks could prove decisive in determining whether the strong uptrend that has defined the past few months has reversed or if equities can regain their footing.

    S&P 500 logged its worst week since September, falling -3.1%, while DOW dropped -2.4%. NASDAQ was hit hardest, tumbling -3.5%.

    The implementation of 25% tariffs on Canadian and Mexican imports on March 4, had initially sent markets into a tailspin. However, Trump’s decision on Thursday to pause tariffs on USMCA-covered goods for another month only added to the confusion, as investors struggled to decipher the long-term direction of trade policy.

    This chaotic cycle of tariff imposition followed by temporary reversals has created an uncertain and fragile investment environment. Businesses remain hesitant to make forward-looking decisions, while consumer confidence is showing signs of strain. The erratic nature of US trade policy has left markets with little clarity, and the risk of further deterioration in sentiment remains high.

    Nevertheless, Friday’s non-farm payroll report provided some relief, as job growth remained near its recent average, unemployment stayed within its recent range, and wage growth held robust. The data suggested that, at least for now, the feared economic fallout from tariffs has not yet materialized in a meaningful way. However, lingering uncertainty around trade and global economic conditions continues to weigh on sentiment.

    Meanwhile, Fed Chair Jerome Powell reiterated on Friday that the central bank is in no rush to cut rates, stating that the Fed is “well-positioned to wait for clarity.” Powell’s cautious stance contrasts with growing market expectations for rate cuts, as investors bet on economic weakness forcing the Fed’s hand.

    While a hold in March remains the base case, with 88% odds, Fed fund futures now price in a 52% probability of a 25bps rate cut in May, up sharply from 33% a week ago and 26% a month ago. This suggests that investors are bracing for the possibility of further economic softening, with Fed being forced to act sooner than its current guidance suggests.

    Technically, DOW’s up trend should still be intact as long as 41844.89 support holds. However, firm break there will argues that it’s already in correction to the up trend from 28660.93 (2022 low). Sustained trading below 55 W EMA (now at 41332.86) will further solidify this bearish case. Next target will be 38.2% retracement of 28660.94 to 45087.75 at 38812.71.

    As for NASDAQ, it’s now pressing 55 W EMA (at 17878.67). Sustained break there will also indicate that it’s already correcting the up trend from 10088.82 (2022 low). Next target is 38.2% retracement of 10088.82 to 20204.58 at 16340.36.

    As for Dollar Index, last week’s steep decline and strong break of 55 W EMA (now at 105.31) argues that corrective pattern from 99.57 (2023 low) has completed with three waves up to 110.17. Near term risk will now stay on the downside as long as 55 D EMA (now at 106.91) holds. Further downside acceleration will raise the chance that Dollar Index is indeed resuming the whole down trend from 114.77 (2022 high) .

    While it’s still too early to confirm the bearish case, firm break of 100.15 support could set up further medium term fall to 100% projection of 114.77 to 99.57 from 110.17 at 94.97.

    The challenge for Dollar is that risk aversion no longer seems to be offering support. Tariffs are providing little help unlike what it did this year. Meanwhile, Fed appears poised to resume rate cuts sooner than expected. With these factors in play, it’s unclear what could drive a rebound for the greenback, other then implosion of Euro and other currencies

    EUR/CHF Weekly Outlook

    EUR/CHF surged to as high as 0.9634 last week but faced strong resistance from long term falling channel and retreated. Initial bias stays neutral this week first and some more consolidations could be seen. Further rally will be expected as long as 55 4H EMA (now at 0.9467) holds. On the upside, above 0.9634, and sustained trading above 0.9651 fibonacci level will pave the way back to 0.9928 key resistance next.

    In the bigger picture, the strong break of 55 W EMA (now at 0.9482) is a medium term bullish sign. Sustained break trading above long-term falling channel resistance (at around 0.9620) would suggest that the downtrend from 1.2004 (2018 high) has bottomed at 0.9204. Stronger rally should then be see to 0.9928 key resistance at least.

    In the long term picture, bullish signs are emerging. However, the important hurdle at 0.9928 resistance, which is close to 55 M EMA (now at 0.9960), is needed to be taken out decisively before considering long term trend reversal. Otherwise, outlook is neutral at best.


    Source link

  • Risk Aversion Creeps Back as Markets Unconvinced by Trump’s Temporary Tariff Exemptions

    Risk Aversion Creeps Back as Markets Unconvinced by Trump’s Temporary Tariff Exemptions


    Risk sentiment in the forex markets appears to be tilting towards risk aversion in Asian trading, marking a shift from the broad Dollar selloff earlier in the week. Overnight, US President Donald Trump granted temporary tariff exemptions for Canadian and Mexican goods under the USMCA, delaying a full-scale implementation until April 2. While this provided some relief for Canadian Dollar, overall market sentiment remained fragile, with major US equity indexes closing in the red, led by losses in NASDAQ.

    The temporary exemption covers roughly 50% of Mexican imports and 38% of Canadian imports. However, Trump’s move has done little to inspire confidence, as markets remain skeptical about his erratic trade policies. Investors have become wary of his inconsistent messaging—one day insisting on strict tariff enforcement, the next day granting exemptions. This unpredictability has left traders cautious, unsure of how to position for potential future shifts in trade policy.

    Despite the tariff delay, risk-sensitive currencies like Australian and New Zealand Dollars have come under renewed selling pressure in Asia. The broader market focus has shifted toward the April 2 deadline, when Trump’s proposed “reciprocal tariffs” are set to take effect. These tariffs will target foreign nations that impose import taxes on US goods, keeping trade war fears firmly in play.

    Adding to market unease is the upcoming US non-farm payrolls report. With sentiment already on shaky ground, any significant weakness in the jobs data could deepen risk aversion. While a weaker NFP might increase expectations for a Fed rate cut, traders are growing concerned that deteriorating labor market conditions could signal a sharper economic slowdown. This dynamic suggests that even rising Fed cut bets may not be enough to offset broader recession fears.

    So far for the week, Dollar remains the worst-performing currency, struggling to find any solid footing. Canadian Dollar follows closely as the second weakest, alongside Australian Dollar. On the stronger side, Euro continues to outperform, driven by optimism over fiscal expansion plans in Europe. Sterling and Swiss Franc are also holding firm, while Yen and Kiwi are settling in the middle.

    In Asia, the time of writing, Nikkei is down -2.07%. Hong Kong HSI is down -0.06%. China Shanghai SSE is up 0.15%. Singapore Strait Times is down -0.01%. Japan 10-year JGB yield is up 0.023 at 1.535. Overnight, DOW fell -0.99%. S&P 500 fell -1.78%. NASDAQ fell -2.61%. 10-year yield rose 0.021 to 4.286.

    NFP in focus: NASDAQ and S&P 500 at risk of deeper correction

    US markets are standing on precarious footing, with investors attention on the February non-farm payrolls report due later in the day. There has been noticeable anxieties surrounding the impact of fiscal and trade policies changes. A set of weaker-than-expected NFP data could be taken as another signal of swift deceleration in the economy and rattle market sentiment further.

    Cooldown in the job market might prompt Fed to resume rate cuts earlier. Markets are currently pricing in 53% chance of a 25bps rate cut in March, reflecting growing belief that Fed will need to act sooner rather than later. However, the immediate market response to downside surprises may not be relief over monetary easing but rather heightened concerns about the pace of economic weakening, given recent policy uncertainties and trade disruptions.

    Markets anticipate 156k increase in NFP for February, up from 143k in January. The unemployment rate is forecast to remain at 4.0%, while average hourly earnings should hold steady at 0.3% m/m.

    The latest indicators paint a mixed picture: ISM Manufacturing PMI Employment subindex dropped to 47.6 from 50.3, while ISM Services PMI Employment inched up to 53.9 from 52.3. Meanwhile, ADP Employment reading of 77k missed last month’s 186k, and the 4-week moving average of jobless claims rose to 224k—its highest level so far this year.

    Technically, NASDAQ has been sliding for two consecutive weeks, now testing its 55-week EMA at 17,874.13. A decisive break below this level would confirm that the index is at least in a correction relative to the broader uptrend from the 10,088.82 low in 2022. The next key support to watch is the 38.2% Fibonacci retracement of 10,088.82 to 20,204.58, which comes in at 16,340.36. Extended losses here could set a negative tone for broader U.S. equities.

    The S&P 500, still trading comfortably above its 55-week EMA at 5,590.31, may follow in the NASDAQ’s footsteps if sentiment sours further. Should the index breach this EMA convincingly, it would likely confirm that the fall from 6,147.43 is a correction of the uptrend from the 3,491.58 low in 2022. This scenario would set a 38.2% retracement target around 5,132.89, marking a significant downside pivot.

    Overall, whether today’s NFP meets, misses, or exceeds expectations, the market’s reaction will hinge on how investors interpret the labor data in the context of looming trade uncertainties and weakening growth momentum. A softer reading could drive near-term Fed cut bets higher but might also deepen concerns that the U.S. economy is losing steam, thereby raising the stakes for traders and policymakers alike.

    Technically, NASDAQ is now eyeing 55 W EMA (now at 17874.13) with the extended decline in the past two weeks. Sustained break there will confirm that it’s at least in correction to the up trend from 10088.82 (2022 low). Next target will be 38.2% retracement of 10088.82 to 20204.58 at 16340.36.

    Extended selloff in NASDAQ could be a prelude to the similar development in S&P 500. While it’s still well above 55 W EMA (now at 5590.31), sustained break there will align the outlook with NASDAQ. Fall from 6147.43 would then be correcting the up trend from 3491.58 (2022 low) at least, and target 38.2% retracement of 3491.58 to 6147.43 at 5132.89.

    Fed’s Waller: No immediate rate cut, but open to future easing

    Fed Governor Christopher Waller suggested that another rate cut at the next FOMC meeting is unlikely, but he remains open to further easing down the line.

    “I would’t say at the next meeting, but could certainly see [cuts] going forward,” he noted. Waller particularly highlighted the February inflation report and the evolving impact of trade policies as key factors in shaping the Fed’s outlook.

    Waller acknowledged the challenges in assessing the economic effects of tariffs, citing changing economic conditions and President Trump’s harder trade stance as factors complicating policy decisions.

    He noted that evaluating the impact of tariffs is more difficult this time, adding, “It’s very hard to eat a 25% tariff out of the profit margins.”

    Fed’s Bostic: Economy in flux, no rush to adjust policy

    Atlanta Fed President Raphael Bostic emphasized the high level of uncertainty in the US economy due to evolving policies under the Trump administration. With inflation, trade policies, and government spending all in flux, he suggested that meaningful clarity may not emerge until “late spring or summer”. Given this, he reiterated “We’ll have to just sort of really be patient.”

    Speaking overnight, he described the situation as being in “incredible flux,” with rapid shifts in trade and fiscal policies making it difficult to predict economic trends. Given this backdrop, Bostic urged caution, stating, “You’ve got to be patient and not want to get too far ahead.”

    He noted that just this week, there have been significant swings in expectations regarding economic policy. “If I was waiting before to see and get a clear signal about where the economy is going to go, I’m definitely waiting now,” he said.

    BoE’s Mann: Larger rate cuts needed as global spillovers worsen

    BoE MPC member Catherine Mann argued that recent monetary policy actions have been overshadowed by “international spillovers.” Financial market volatility, particularly from cross-border shocks, has disrupted traditional policy signals, making “founding premise for a gradualist approach to monetary policy is no longer valid”.

    Mann said that larger rate cuts, like the 50bps reduction she supported at the last BoE meeting, would better “cut through this turbulence” and provide clearer guidance to the economy.

    She believes that a more decisive policy stance would help steer inflation expectations and stabilize economic conditions, rather than allowing uncertainty to linger with smaller, incremental moves.

    Despite her stance, the BoE opted for a smaller 25bps rate cut in its latest decision, with Mann and dovish member Swati Dhingra being outvoted 7-2.

    China’s exports rise 2.3% yoy, imports fall -8.4% yoy

    China’s exports rose just 2.3% yoy to USD 539.9B in the January–February period, coming in below forecasts of 5.0% yoy and down sharply from December’s 10.7% yoy.

    Meanwhile, imports sank -8.4% yoy to USD 369.4B, missing expectations of 1.0% yoy growth and marking a noticeable drop from December’s 1.0% yoy.

    As a result, trade balance resulted in USD 170.5B surplus exceeding projections of USD 147.5B.

    Looking ahead

    Germany factory orders, Swiss foreign currency reserves and Eurozone GDP revision will be released in European session. Later in the day, Canada employment will also be published alongside US NFP.

    USD/CHF Daily Outlook

    Daily Pivots: (S1) 0.8800; (P) 0.8863; (R1) 0.8900; More…

    Intraday bias in USD/CHF remains on the downside for the moment. Rise from 0.8374 should have completed at 0.9222, after rejection by 0.9223 key resistance. Deeper fall should be seen to 61.8% retracement of 0.8374 to 0.9200 at 0.8690 next. On the upside, above 0.8924 minor resistance will turn intraday bias neutral first. But rise will now stay on the downside as long as 0.9035 resistance holds, in case of recovery.

    In the bigger picture, rejection by 0.9223 key resistance keep medium term outlook bearish. That is, larger fall from 1.0342 (2017 high) is not completed yet. Firm break of 0.8332 (2023 low) will confirm down trend resumption.

    Economic Indicators Update

    GMT CCY EVENTS ACT F/C PP REV
    03:02 CNY Trade Balance (USD) Feb 170.5B 147.5B 104.8B
    07:00 EUR Germany Factory Orders M/M Jan -2.40% 6.90%
    07:45 EUR France Trade Balance (EUR) Jan -4.1B -3.9B
    08:00 CHF Foreign Currency Reserves (CHF) Feb 736B
    10:00 EUR Eurozone GDP Q/Q Q4 0.10% 0.10%
    13:30 CAD Net Change in Employment Feb 17.8K 76K
    13:30 CAD Unemployment Rate Feb 6.70% 6.60%
    13:30 CAD Capacity Utilization Q4 79.00% 79.30%
    13:30 USD Nonfarm Payrolls Feb 156K 143K
    13:30 USD Unemployment Rate Feb 4% 4%
    13:30 USD Average Hourly Earnings M/M Feb 0.30% 0.50%


    Source link

  • Safe-Haven Demand Fuels Dollar Rally Amid Trade, Geopolitical Turmoil

    Safe-Haven Demand Fuels Dollar Rally Amid Trade, Geopolitical Turmoil


    Market sentiment took a decisive turn for the worse last week, with risk aversion dominating across asset classes. The combination of deteriorating domestic economic conditions in the US and heightened global uncertainties has fueled concerns that risk appetite could weaken further. Equities faced renewed selling pressure, yields dropped sharply.

    Domestically, US economic data painted a troubling picture. Consumer confidence deteriorated sharply, while weak personal spending data and a rise in jobless claims suggested that the labor market could be facing new headwinds. With the economy looking increasingly fragile, concerns are mounting that the economy may struggle to maintain momentum, reinforcing speculation about Fed rate cuts.

    Externally, the risk of a full-blown trade war continues to escalate. US President Donald Trump doubled down on his aggressive tariff agenda, reaffirming the March 4 deadline for 25% tariffs on Canada and Mexico and indicating that the EU would be next in line with reciprocal tariffs.

    Geopolitical tensions also worsened, particularly after a dramatic Oval Office showdown between Trump, Vice President JD Vance, and Ukrainian President Volodymyr Zelenskiy. The meeting, initially expected to pave the way for a mineral deal between the US and Ukraine—potentially a step toward resolving the Russian invasion—ended in failure. With US-Ukraine relations strained and no clear resolution in sight, uncertainty in the region remains elevated.

    On the bright side, markets have scaled up expectations for a Fed rate cut in the first half of the year. However, it’s unclear whether additional monetary easing will truly bolster risk sentiment or simply underscore the extent of the economic challenges ahead. A rate cut could offer short-term relief for risk assets, but it might also underscore fears of an impending downturn in domestic activity.

    In the forex market, Dollar emerged as the clear winner for the week, benefiting from risk aversion rather than rate expectations. Sterling and Swiss Franc followed as the next strongest currencies, with the UK seemingly avoiding US tariff threats and the Franc gaining from both risk aversion and Euro weakness. At the other end of the spectrum, commodity currencies struggled, with New Zealand Dollar leading the declines, followed by Australian and Canadian Dollars. Meanwhile, Euro ended in a mixed manner, with the initial post-German election boost fading as tariff threats weighed. Yen also struggled to extend its rally, leaving it stuck in the middle of the performance ladder.

    Investors Pin Hopes on Fed Easing as Stocks Sell Off, But Is Relief Temporary?

    US equity markets ended February on a weak note, with NASDAQ suffering a sharp -3.5% weekly decline despite a late recovery. S&P 500 also lost nearly -1%, while DOW managed to close about 1% higher, benefiting from recovery after leading the selloff earlier in the month. However, the broader market sentiment remained fragile.

    For the entire month, NASDAQ dropped -4%, marking its worst monthly performance since April 2024. S&P 500 fell -1.5%, while the DOW ended down -1.6%. Several factors weighed on market sentiment, including intensifying trade war risks, particularly as the scheduled 25% tariffs on Canada and Mexico approach on March 4. The more consequential reciprocal tariffs, set to take effect on April 2, also remain a source of significant uncertainty.

    US economic data further exacerbated concerns, with sharp decline in consumer confidence, jump in jobless claims, and contraction in personal spending, all pointing to risk of extended weakness in household demand. These indicators have fueled doubts about the strength of US consumption, which remains a critical driver of economic growth.

    With these headwinds and decline in PCE core inflation as released on Friday, expectations for another Fed rate cut in the first half of the year continued to rise. Fed fund futures now price in a 94% probability of a 25bps cut to 4.00%-4.25% in June, up significantly from 63% just a week ago. This growing optimism about resumed Fed easing has provided some support to market sentiment. But it remains unclear whether it will be enough to reverse the pre-dominating risk-off mood or merely slow the pace of decline.

    Technically, NASDAQ is tentatively drawing support from 38.2% retracement of 15708.53 to 20204.58 at 18487.09. Strong rebound from current level, followed by firm break of 55 D EMA (now at 19440.85) will suggest that the corrective pattern from 20204.58 has completed. That will also keep the medium term up trend intact for another rally through 20204.58 at a later stage.

    However, sustained break of 18487.09 will raise the chance that a larger scale correction has already started. In the bearish case, NASDAQ should be correcting whole uptrend from 10088.82 (2022 low). Further break of 55 W EMA (now at 17866.91) will confirm this bearish case and pave the way to 38.2% retracement of 10088.82 to 20204.58 at 16340.36.

    Risk Aversion Drags Yields Down, But Lifts Dollar Higher

    Risk aversion was also evident in the US bond markets, with 10-year Treasury yield tumbling sharply to its lowest level since December. The sharp drop highlights growing concerns over economic uncertainty and trade tensions.

    Technically, current development suggests that rise from 3.603 (2024 low) has completed at 4.809 already, well ahead of 4.997 (2023 high). Current fall is seen as another downleg in the sideway corrective pattern from 4.997. Deeper decline is expected to 61.8% retracement of 3.603 to 4.809 at 4.063 next. Risk will stay on the downside as long as 55 D EMA (now at 4.452) holds, in case of recovery.

    Dollar Index clear reacted more to risk aversion than falling yields and Fed cut expectations. The’s strong bounce towards the end of the week and the break of 55 D EMA (now at 107.31) suggests that fall from 110.17 has completed at 106.12. That came after defending 38.2% retracement of 100.15 to 110.17 at 106.34. Further rise should be seen to 108.52 resistance. Firm break there will target a retest on 110.17 high.

    In the bigger picture, Dollar Index is holding comfortably above 55 W EMA (now at 105.37), and thus rise from 100.15 and 99.57 should still be intact. Break of 110.17 will pave the way back to 114.77 (2022 high) at a later stage.

    NZD/USD and AUD/USD Sink, Eye 2025 Lows for Support

    Kiwi and Aussie were the worst-performing currencies last week, each losing around -2.4% against the greenback. With risk sentiment deteriorating downside pressure on these two currencies could persistent. The key focus now is whether risk aversion would intensify and push NZD/USD and AUD/USD through this year’s lows to resume the long term down trend. There these key support levels could offer a breather to them.

    Technically, NZD/USD’s steep decline last week suggests that corrective rebound from 0.5515 should have completed at 0.5571 already. Retest of 0.5515 should be seen next. Strong support from there could bring rebound to extend the corrective pattern with another rising leg. But outlook will stay bearish as long as 38.2% retracement of 0.6378 to 0.5515 at 0.5848 holds. Firm break of 0.5515 will resume the long term down trend to 61.8% projection of 0.7463 to 0.5511 from 0.6378 at 0.5172.

    Similarly, AUD/USD’s corrective rebound from 0.6087 should have completed at 0.6407. Retest of 0.6087 low should be seen next. Strong rebound from there would extend the corrective pattern with another rising leg. But outlook will stay bearish as long as 38.2% retracement of 0.6941 to 0.6087 at 0.6413 holds. Firm break of 0.6087 will resume the long term down trend to 61.8% projection of 0.8006 to 0.6169 from 0.6941 at 0.5806.

    Bitcoin and Gold Tumble on Risk-Off Sentiment

    Bitcoin and Gold struggled under renewed risk aversion last week, extending their losses in line with broader market weakness. While Gold retains a comparatively better outlook, both assets remain vulnerable to ongoing volatility.

    Bitcoin suffered a sharp fall, decisively breaking 89127 support, confirming medium-term topping at 109571. The current slide is seen as a correction of the entire uptrend from the 15452 (2022 low). Deeper decline toward 55 W EMA (now at 74129) is expected.

    Strong support could emerge from the 73812 cluster zone (38.2% retracement of 15452 to 109571 at 73617) to bring rebound, at least first attempt. However, downside risks remain as long as 55 D EMA (now at 95288) caps any recovery.

    Decisive break of 73617/73812 zone could extended the decline to 50k mark, which is close to 49008 support and 61.8% retracement at 51405.

    By contrast, Gold’s outlook is less overtly bearish. 2956.09 is seen as a short term top only, for now. Subsequent pullback is viewed primarily as a correction of the rise from 2584.24. Strong support might be seen from 55 D EMA (now at 2792.05) to bring rebound, and set the base for uptrend resumption at a later stage.

    However, considering that Gold was just rejected by 3000 psychological level sustained trading below 55 D EMA would argue that larger scale correction in underway. In the bearish case, Gold could be starting a medium term decline back to 55 W EMA (now at 2522.33).

    EUR/USD Weekly Outlook

    EUR/USD reversed after edging higher to 1.0527 last week, and the development suggests that consolidation from from 1.0176 has already completed. Initial bias stays on the downside this week for retesting 1.0176/0210 support zone first. Firm break there will resume whole fall from 1.1213, and carry larger bearish implications. On the upside, above 1.0419 minor resistance will turn intraday bias neutral. But outlook will stay bearish as long as 38.2% retracement of 1.1213 to 1.0176 at 1.0572 holds.

    In the bigger picture, immediate focus is on 61.8 retracement of 0.9534 (2022 low) to 1.1274 (2024 high) at 1.0199. Sustained break there will solidify the case of medium term bearish trend reversal, and pave the way back to 0.9534. However, reversal from 1.0199 will argue that price actions from 1.1274 are merely a corrective pattern, and has already completed.

    In the long term picture, down trend from 1.6039 remains in force with EUR/USD staying well inside falling channel, and upside of rebound capped by 55 M EMA (now at 1.0929). Consolidation from 0.9534 could extend further and another rising leg might be seem. But as long as 1.1274 resistance holds, eventual downside breakout would be mildly in favor.


    Source link

  • Global Markets Look Beyond Trump’s Inauguration as Local Drivers Take the Lead

    Global Markets Look Beyond Trump’s Inauguration as Local Drivers Take the Lead


    Global markets are buzzing in anticipation of Donald Trump’s inauguration on January 20, yet the latest developments suggest investors may already be looking past the immediate impact. Despite speculation surrounding Trump’s policies—particularly tariffs—various benchmarks and asset classes are charting their own directions based on localized drivers and monetary policy expectations.

    In the US, the strong bounce in major stock indexes owes something to hopes of expansive fiscal stimulus under Trump. However, a significant portion of the rally can be traced to an improving inflation outlook and the view that Fed remains on track to further monetary easing. Additionally, the lack of significant concern over tariffs impacting inflation suggests that investors may not see Trump’s trade policies as an immediate threat to the US economy.

    Meanwhile record-breaking runs in FTSE and DAX signal distinct optimism. UK investors are banking on additional BoE easing after disappointing GDP, retail sales, and CPI data highlighted ongoing struggles. Germany’s DAX is supported by ECB’s dovish leanings as well as hopes of a political turnaround after snap elections in Germany in February. Market enthusiasm for Europe clearly isn’t driven by any expectation of beneficial tariffs; rather, local factors are in control.

    Japan, not a prime target of Trump’s tariff rhetoric, saw Nikkei weighed down by intensifying speculation about a looming Bank of Japan rate hike. This dynamic stands in sharp contrast to the overarching risk-on atmosphere elsewhere.

    In the currency markets, Yen emerged as the strongest performer last week, propelled by bets on BoJ action. Australian and New Zealand dollars followed suit, aided by the broader risk-on mood. On the weaker side of the spectrum, Canadian Dollar was the worst-performing currency, finally something reflecting potential vulnerability to Trump’s trade policies as BoC may have underestimated the economic risks posed by tariffs. Sterling also underperformed while Dollar was similarly subdued. Euro and Swiss Franc ended the week in middle positions.

    Risk Appetite Returns: DOW, S&P 500, NASDAQ End Week with Solid Gains

    Risk-on sentiment returned to US equity markets this week, with all three major indexes posting strong gains. DOW surged 3.69% for the week, S&P 500 rose 2.91%, and NASDAQ climbed 2.45%. Technically, the robust rebound eased fears of an imminent bearish reversal, affirming that recent pullbacks were likely just corrections within a broader uptrend.

    Market attention was drawn to Fed Governor Christopher Waller’s remarks at CNBC’s “Squawk on the Street”, interpreted by some as a dovish tilt. He expressed confidence that the inflationary stickiness seen in 2024 will begin to “dissipate” in 2025 and described himself as “more optimistic” about inflation than many of his Fed colleagues. Waller indicated the potential for three or four 25bps rate cuts this year, contingent on favorable inflation data.

    However, it should emphasized that Waller also tempered this optimism with caution, acknowledging that “If the data doesn’t cooperate, then you’re going to be back to two, maybe even one”.

    Waller left the door open for a rate cut in March, remarking that such a move “cannot be completely ruled out.” However, the message underlying was still consistent with market expectation that May or June might be more likely.

    Overall, despite the dovish interpretation by some, Waller’s comments suggest a flexible, data-dependent approach rather than a clear commitment to easing. The comments also largely aligned with market pricing.

    Nonetheless, inflation data for December did provide some relief. While, headline CPI rose from 2.7% to 2.9% yoy, core CPI edged down from 3.3% to 3.2%. This incremental progress reduces pressure on the Fed to maintain restrictive policy for an extended period. More importantly, that makes a return to tightening less likely.

    Futures pricing didn’t change much over the week, reflecting a 97.9% chance that Fed will hold rates steady at 4.25–4.50% at the January meeting, with a 72.4% chance of another hold in March. The probability of a May rate cut stands at 44%, rising to 66% by June. By year-end, markets still project a 52.1% chance of just one rate cut, reducing rates to 4.00–4.25%.

    Technically, DOW’s break of 55 D EMA (now at 43038.33) suggests that pullback from 45073.63 has completed at 41844.98 already. The medium term channel holds intact, as well as the up trend. Whether DOW is ready for another record run through 45073.63 would depend on the momentum of the next rise.

    But even in case that corrective pattern from 45073.63 is going to extend with another falling leg, downside looks more likely than not to be contained by cluster support level at around 40k, with 39889.05 resistance turned support, and 38.2% retracement of 32327.20 to 45073.63 at 40204.49.

    NASDAQ’s price actions from 20204.58 are also clearly corrective looking so far, with notable support from 18671.06 resistance turned support. With this support intact, larger up trend should resume through 20204.58 sooner rather than later.

    Yields and Dollar Index Form Short-Term Top With Improved Risk Sentiment

    Improved risk sentiment in US markets has triggered pullback in both 10-year Treasury yield and the Dollar Index, suggesting a temporary pause in their recent rally.

    Technically, a short term top is likely in place at 4.809 in 10-year yield, considering that D MACD has crossed below signal line. More consolidations should follow in the near term below 4.809, with risk of deeper pull back to 55 D EMA (now at 4.434). But outlook will continue to stay bullish as long as 38.2% retracement of 3.603 to 4.809 at 4.348 holds. Another rally through 4.809 to retest 4.997 high is expected, though breaking the psychological 5% level may prove challenging without stronger momentum.

    Dollar Index could have formed a short term top at 110.17 too, just ahead of 61.8% projection of 100.15 to 108.87 from 105.42 at 110.31, with D MACD crossed below signal line. Deeper retreat could be seen to 108.07 resistance turned support, or even further to 55 D EMA (now at 107.15). But near term outlook will stay bullish as long as 38.2% retracement of 100.15 to 110.17 at 106.34 holds. Firm break of 110.17 will resume the rally to 100% projection at 113.34.

    FTSE and DAX Surge to Record Highs

    Risk-on sentiment was also evident in the European equity markets, with FTSE 100 and DAX surged to new record highs. The optimism was fueled by expectations of rate cuts, positive economic projections, and hopes for political stability.

    In the UK, a trio of softer economic data—GDP, retail sales, and CPI—reinforced market expectations for BoE easing. Markets now anticipate more than 75 basis points of rate cuts throughout 2025, compared to just 50 basis points priced in the prior week. A 25bps rate cut in February is now universally expected.

    Supporting this sentiment, IMF upgraded its UK growth forecast for 2025 by 0.1 percentage points to 1.6%, making the UK the third-fastest-growing G7 economy after the US and Canada. IMF attributed this optimism to increased government investment, improved household finances, and anticipated rate cuts.

    That’s a strong nod to the Labour government despite wide criticism on its Autumn Budget. Meanwhile, IMF also projects BoE’s headline rate to fall from 4.75% to 3.75% by year-end.

    Technically, FTSE’s break of 8474.41 confirmed that triangle consolidation from there has completed at 8002.34, and larger up trend has resumed. Next target is 61.8% projection of 7404.08 to 8474.41 from 8002.34 at 8663.80.

    In Germany, DAX surged to new record on improving risk appetite and expectations of continued ECB easing.

    ECB’s December meeting minutes leaned towards the dovish side, and revealed discussions about a more aggressive 50-basis-point cut. The central bank ultimately favored a measured approach, with consensus on a more controlled pace of easing, to allow for checkpoints to confirm that disinflation remains on track.

    While IMF downgraded its 2025 growth forecasts for Germany and France, the outlook still points to modest recovery. Germany, previously expected to grow by 0.8%, is now forecasted to expand by just 0.3%, marking a slow rebound from two years of contraction. France’s growth forecast was also reduced by 0.3 percentage points to 0.8%. The positive side of the forecasts is that both economies are expected to regain some footing this year.

    It should also be noted that markets are probably pricing in a degree of optimism around the February 23 snap elections, which could lead to greater political stability and more consistent economic policies in Germany.

    Technically, DAX should now be on track to 100% projection of 14630.21 to 18892.92 from 17024.82 at 21287.52 next.

    Nikkei Weighed by BoJ Hike Risks, SSE Struggles to Rebound

    Investor sentiment in Asia, however, was much less optimistic, with Japan facing headwinds from growing expectations of Bank of Japan policy normalization, while China’s economic recovery struggles to inspire confidence amid external pressures.

    In Japan, speculation over a rate hike at the upcoming January 23–24 BoJ meeting has intensified. Governor Kazuo Ueda and Deputy Governor Ryozo Himino have repeatedly hinted at the possibility of policy tightening, with analysts interpreting their comments as preparation for market adjustments.

    Additionally, reports suggest BoJ is likely to raise its inflation forecasts in its quarterly outlook, highlighting upside risks fueled by the persistently weak Yen and elevated import costs. Internally, BoJ policymakers believe that stabilizing inflation expectations around the 2% target could allow short-term rates to rise as high as 1% without hindering economic growth.

    Traders are pricing in an 80% chance of a rate hike from 0.25% to 0.50%.

    Nikkei weakened for the week on expectations of BoJ’s normalization move, but stayed above 37651.07 support.

    Outlook is unchanged that price action from 42426.77 are developing in to a medium term three wave consolidation pattern, with rebound from 31156.11 as the second leg.

    For now, another rally cannot be ruled out, but strong resistance should emerge below 42426.77 to limit upside. Firm of 37651.07 support will in turn indicate that the third leg has likely commenced, and bring deeper fall to 35253.43 support and below

    In China, Shanghai SSE Composite struggled to generate meaningful gains other than a mild recovery.

    China’seconomy grew 5.4% yoy in Q4, lifting full-year GDP growth to 5.0%, matching the government’s target.Meanwhile, market rumors suggest Beijing is hesitant to use Yuan depreciation as a tool to counter tariffs from a second Trump presidency. Analysts believe sharp currency depreciation, as seen during Trump’s first term, could harm the struggling economy more than it would help.

    However, market confidence remains subdued, and the stock market recovery appeared technical rather than driven by fundamentals.

    SSE found support at the 50% retracement level of 2,635.09 to 3,674.40 at 3154.74, but remained capped below 55 D EMA (now at 3279.16).

    Risk remains on the downside for the near term for SSE. Break of 3140.90 will extend the corrective fall from 3674.40 to 61.8% retracement at 3032.11. Nevertheless, sustained break above the 55 D EMA will indicate that stronger near term rebound is underway back towards 3494.86 resistance.

    USD/CAD Weekly Outlook

    USD/CAD’s late break of 1.4466 resistance confirms larger up trend resumption. Initial bias is back on the upside this week for 1.4667/89 long term resistance zone. For now, outlook will stay bullish as long as 1.4302 support holds, in case of retreat.

    In the bigger picture, up trend from 1.2005 (2021) is in progress for retesting 1.4667/89 key resistance zone (2020/2015 highs). Decisive break there will confirm long term up trend resumption. Next target is 100% projection of 1.2401 to 1.3976 from 1.3418 at 1.4993. Medium term outlook will remain bullish as long as 1.3976 resistance turned holds (2022 high), even in case of deep pullback.

    In the longer term picture, price actions from 1.4689 (2016 high) are seen as a consolidation pattern, which might have completed at 1.2005. That is, up trend from 0.9506 (2007 low) is expected to resume at a later stage. This will remain the favored case as long as 1.3418 support holds.


    Source link

  • Dollar Gains Momentum as Fed Cuts Come Into Question

    Dollar Gains Momentum as Fed Cuts Come Into Question


    The US markets last week were shaped by two dominant themes: uncertainty surrounding trade policies of the incoming US administration and the impact of robust US economic data. Initial market confusion, driven by ambiguous signals regarding tariffs, created significant volatility. However, this indecisiveness gave way to clarity as strong US data reaffirmed the resilience of the economy, casting doubt on the likelihood of more Fed rate cuts in 2025.

    US Treasury yields surged as markets recalibrated their expectations for Fed policy, while equities faced notable selling pressure. This dual development provided a substantial boost to Dollar, which ended the week broadly higher. While some traders remain cautious, wary of surprises tied to US political developments, the Dollar’s upward momentum appears poised to persist, supported by the hawkish shift in Fed expectations and strong macroeconomic fundamentals.

    Across the Atlantic, Sterling faced intense pressure, falling sharply as concerns over fiscal de-anchoring took center stage. Rising UK gilt yields, coupled with a weakening Pound, highlighted fears of a negative spiral for the UK’s fiscal health. Investors are increasingly concerned that higher borrowing costs could exacerbate fiscal imbalances, particularly in an environment of tepid growth and stagflationary risks. Sterling’s underperformance made it the worst performer among major currencies.

    Elsewhere, Canadian Dollar emerged as the strongest currency of the week, but only for consolidating recent losses. Yen followed Dollar as the third strongest, benefiting from a late-week risk-off environment. On the other hand, Aussie and Kiwi, reflecting their risk-sensitive nature, were among the weakest performers. Euro and Swiss Franc ended in middle positions.

    Fed Pause to Extend, Rate Cuts in 2025 Less Certain, Hike Risks Emerge?

    Dollar and US Treasury yields soared last week, while equities took a hit, as a new idea gained traction: Fed might refrain from any rate cuts in 2025. This shift in market sentiment emerged after several catalysts converged, including robust employment data, jump in inflation expectations, and public remarks from key Fed officials. Traders are now rethinking their scenarios for the months ahead, pricing in the possibility that the central bank will remain on hold longer than previously thought.

    Driving the narrative is the unexpectedly strong December non-farm payroll report. Employers added 256k new jobs, surpassing consensus forecasts of 150k and even outpacing the monthly average of 186k for 2024. Unemployment rate dipped back to 4.1%, reinforcing the view that the labor market is in solid shape.

    These data points suggest not only a healthy labor market but also reacceleration in hiring after last year’s elections, bolstered by expectations of pro-business policies under the incoming Trump administration. If these dynamics persist, the labor market could tighten further, reigniting inflationary pressures. The timing of these numbers matters greatly too, as they have arrived just as the market was anticipating a more tempered economy heading into 2025.

    Another factor reshaping investor expectations is the January University of Michigan survey, which revealed a marked rise in inflation expectations. One-year inflation forecasts jumped from 2.8% to 3.3%, the highest since May, while long-run expectations climbed to 3.3%, not seen since June 2008. These developments highlight a growing concern that inflation could move beyond Fed’s comfort zone, especially with additional fiscal and trade policies fueling price pressures ahead.

    In parallel, the incoming Trump administration’s policy stance, in particular on trade, adds more complexity. While the president-elect denied reports of a shift to sector-specific tariffs out of concerns over political backslash, subsequent speculation about declaring a national economic emergency to justify tariffs has left markets unsettled.

    It should be emphasized that these scenarios are not mutually exclusive. Trump could still use emergency powers to target specific sectors or countries. This uncertainty is likely to persist at least until his inauguration on January 20.

    Looking at Fed, three key takeaways have taken form. First, a pause in January appears virtually locked in, with robust data and upbeat official commentary reinforcing the case for no immediate move. Second, markets are now leaning toward the next cut being postponed until May, representing a prolonged window of inactivity. Third, there is a growing notion that Fed could deliver just one cut in 2025 or potentially none at all, should inflation remain elevated and growth hold steady.

    Meanwhile, central bank communication has echoed these changing expectations. Former rate-cut proponents at Fed have begun to indicate growing consensus that policy easing may be nearing an end. However, it should be clarified that Fed Governor Michelle Bowman described December’s cut as the “final step” in the “recalibration” process only. She stopped short of declaring an outright end to the cycle. Still, Bowman’s words imply that a higher threshold for further reductions is now in play.

    Adding to the hawkish tilt, analysts from Bank of America have raised the possibility of a Fed rate hike rather than additional cuts. Such a scenario isn’t the baseline, given that policies are still restrictive, despite being close to neutral. Fed appears content to let existing policy restrictions work their way through the economy for now.

    However, significant acceleration in core inflation—particularly if it exceeds 3%—could force Fed policymakers to reconsider their stance. But then the bar for a hike is also high.

    DOW Correction Deepens, 10-Year Yield and Dollar Index Power Up

    Technically, DOW’s correction started to take sharp as the decline from 45703.63 resumed last week. Two near term bearish signal emerged recently, rejection by 55 D EMA and break of rising channel support.

    Further fall is expected as long as 55 D EMA (now at 43504.46) holds, targeting 38.2% retracement of 32327.20 to 45073.63 at 40204.49. Nevertheless, this decline is seen as correcting the rise from 32327.20 only. Hence strong support should be seen from 40204.49 which is close to 40k psychological level, to contain downside.

    Also, the broader US equity markets remain relatively resilient, with S&P 500 and NASDAQ hold well above support levels at 5669.67 and 18671.06, respectively. These two levels will need to be decisively broken to confirm broader medium-term corrections. Without such breaks, the overall market appears to be in a sideways consolidation phase, with DOW underperforming.

    10-year yield’s rally from 3.603 reaccelerated last week and powered through 61.8% projection of 3.603 to 4.505 from 4.126 at 4.683. Further rally is now expected in the near term to 4.997 high. And possibly further to 100% projection at 5.028. In any case, near term outlook will remain bullish as long as 4.517 support holds during any pullbacks.

    The bigger picture in 10-year yield still suggests that up trend from 0.398 (2020 low) is ready to resume. Consolidations from 4.997 (2023 high) should have completed at 3.603 already.

    It may still be a bit early, but this bullish medium term scenario is getting closer. Firm break of 4.997 will target 38.2% projection of 0.398 to 4.997 from 3.603 at 5.359.

    Dollar Index’s rally from 100.15 continued last week and remains on track to 61.8% projection of 100.15 to 108.87 from 105.42 near term target. Decisive break there will target 100% projection at 113.34. In any case, near term outlook will stay bullish as long as 107.73 support holds.

    In the bigger picture, Dollar index now looks on track to retest 114.77 key resistance (2022 high). But more importantly, considering the strong support from rising 55 M EMA, it might also be ready to resume the long term up trend from 70.69 (2008 low), with its sight on 61.8% projection of 89.20 to 114.77 from 100.15 at 115.95.

    Fiscal De-anchoring Fears Send UK Bond Yields Soaring, Pound Plunging

    The UK also found itself at the center of market attention last week, with 10-year Gilt yield surging to its highest level since 2008. At the same time, Sterling sank to a more-than-one-year low against Dollar.

    The simultaneous rise in bond yields and depreciation of the currency has raised alarm bells, as some analysts interpret it as a sign of fiscal de-anchoring. In this scenario, higher yields push up borrowing costs, compounding fiscal worries and creating a negative feedback loop.

    Investors have increasingly voiced concern about stagflationary environment in the UK, marked by both subdued economic growth and rising inflationary pressures. The Autumn Budget, with its array of tax and fiscal measures—including an increase in employers’ national insurance contributions—appears to have hindered economic activity to a greater extent than initially expected.

    Comparisons to the “Truss Crisis” of 2022 have naturally emerged. Back then, the mini-budget proposed by Prime Minister Liz Truss and Chancellor Kwasi Kwarteng triggered a dramatic collapse in Sterling from 1.16 to 1.05 against Dollar, alongside a sudden spike in Gilt yields. Those moves, however, were entirely reversed within a few weeks once both the Chancellor and Truss resigned, paving the way for a change in policy direction.

    The scope of last week’s market shifts is notably smaller by comparison, providing a measure of reassurance that the current situation may not descend into a repeat of that crisis. Nonetheless, market sentiment appears less likely to stabilize quickly this time, as there is no indication of immediate change in key government positions.

    Prime Minister Keir Starmer and Chancellor of the Exchequer Rachel Reeves are expected to remain in office despite the current headwinds, which differs markedly from the abrupt reshuffling seen in 2022. Without a rapid pivot in fiscal policy, the overhang of higher borrowing costs and fragile investor confidence could persist, prolonging downward pressure on Sterling and upward pressure on bond yields.

    The confluence of looming stagflation, renewed fiscal anxieties, and limited policy flexibility casts a shadow over Sterling’s outlook. Where the pound plummeted sharply during the Truss episode—only to bounce back swiftly—the new environment suggests a more gradual but persistent decline.

    Technically, with last week’s strong rally, EUR/GBP’s is now back on 0.8446 resistance, which is close to 55 W EMA (now at 0.8444). Decisive break there will firstly confirm medium term bottoming at 0.8221, after drawing support from 0.8201 (2022 low). Further rally should be seen to 0.8624 cluster resistance ( 38.2% retracement of 0.9267 to 0.8221 at 0.8621), even as a correction. Reactions from there would then decide whether the whole down trend from 0.9267 (2022 high) has reversed.

    As for GBP/CHF, it has clearly struggled to sustain above flat 55 W EMA, which kept outlook neutral at best. Break of 1.1106 support will indicate that rebound from 1.0741 has completed, and deeper fall should be seen back to this support. More importantly, downside acceleration below 1.1106 will raise the chance that fall from 1.1675 is resuming the long term down trend, which could send GBP/CHF through 1.0741 to retest 1.0183 (2022 low) at least.

    AUD/USD Weekly Report

    AUD/USD’s break of 0.6169 key support level last week confirms larger down trend resumption. Initial bias stays on the downside this week for 61.8% projection of 0.6687 to 0.6198 from 0.6301 at 0.5999. For now, outlook will stay bearish as long as 0.6301 resistance holds, in case of recovery.

    In the bigger picture, down trend from 0.8006 (2021 high) is resuming with break of 0.6169 (2022 low). Next medium term target is 61.8% projection of 0.8006 to 0.6169 from 0.6941 at 0.5806, In any case, outlook will stay bearish as long as 55 W EMA (now at 0.6587) holds.

    In the long term picture, prior rejection by 55 M EMA (now at 0.6846) is taken as a bearish signal. But for now, fall from 0.8006 is still seen as the second leg of the corrective pattern from 0.5506 long term bottom (2020 low). Hence, in case of deeper fall, strong support should emerge above 0.5506 to contain downside to bring reversal. However, this view is subject to adjustment if current decline accelerates further.


    Source link