- The Dow Jones shed 400 points on Thursday, falling 1.45%.
- US PPI inflation hit a soft patch, further easing fears of an inflation reignition.
- Despite easing price pressures, equities still took a hit as Trump threatens more tariffs.
The Dow Jones Industrial Average (DJIA) fell some 400 points on Thursday, declining around one full percent after United States (US) President Donald Trump and his administration ramped up their trade war rhetoric. President Trump pivoted to threatening new tariffs on targeted goods from the European Union after his tactic of trying to strong-arm Canada into making trade concessions went nowhere earlier this week.
The US Producer Price Index (PPI) cooled faster than expected in February, with core PPI inflation easing to 3.4% YoY versus the expected print of 3.5% and January’s 3.6%. Headline PPI inflation also chilled, falling to 3.2% on an annualized basis compared to the forecast of 3.3%, however January’s headline PPI print was revised higher to 3.7% as revisions continue to be a thorn in the side of preliminary data watchers.
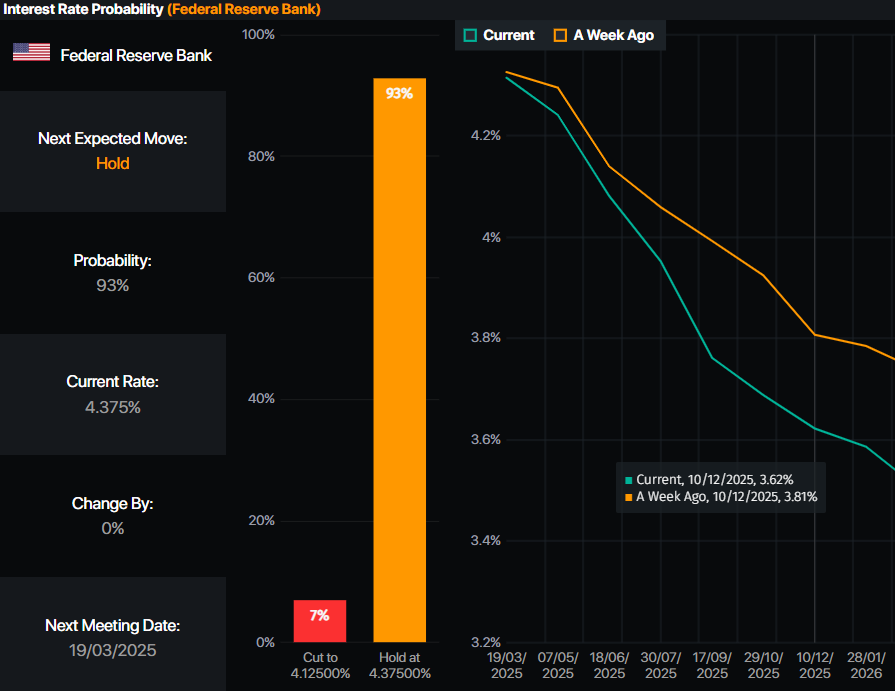
Despite a general easing in this week’s batch of inflation data, the odds of another rate cut from the Federal Reserve (Fed) next week look slim. Inflation metrics are still running well above the Fed’s 2% annual target, and according to the CME’s FedWatch Tool, rate markets are pricing in functionally 100% odds of the Fed holding rates steady after its rate call meeting next week. Rate traders expect the Fed’s next move on rates to be in June, if not later.
US President Donald Trump hit the ground running on Thursday, vowing to impose a stiff 200% tariff on European wines if the EU doesn’t back off from its 50% tariff on US-produced whisky, which was imposed as a retaliatory measure against the US’s global 25% steel and aluminum tariff that went into effect this week. President Trump attempted to strong-arm his Canadian neighbors into not retaliating against his steel import fees.
However, those measures largely fizzled and resulted in no concessions from Canada, and now the Trump administration is shifting its tit-for-tat tariff strategy on Europe. Donald Trump also returned to musing about ‘taking’ Greenland from Denmark as the US president revisits talking points from his campaign trail.
Dow Jones news
A large majority of the stocks listed on the Dow Jones fell back on Thursday, with two-thirds of the index’s securities slipping into the red. Verizon (VZ) rebounded 2.5% to above $43 per share as the telecoms giant recovers from a rout earlier this week. Salesforce (CRM) and Home Depot (HD) both fell over 4%, falling to $271 per share and below $350 per share, respectively. Tech stocks and building suppliers are growing increasingly uneasy in the face of the Trump administration’s trade policies.
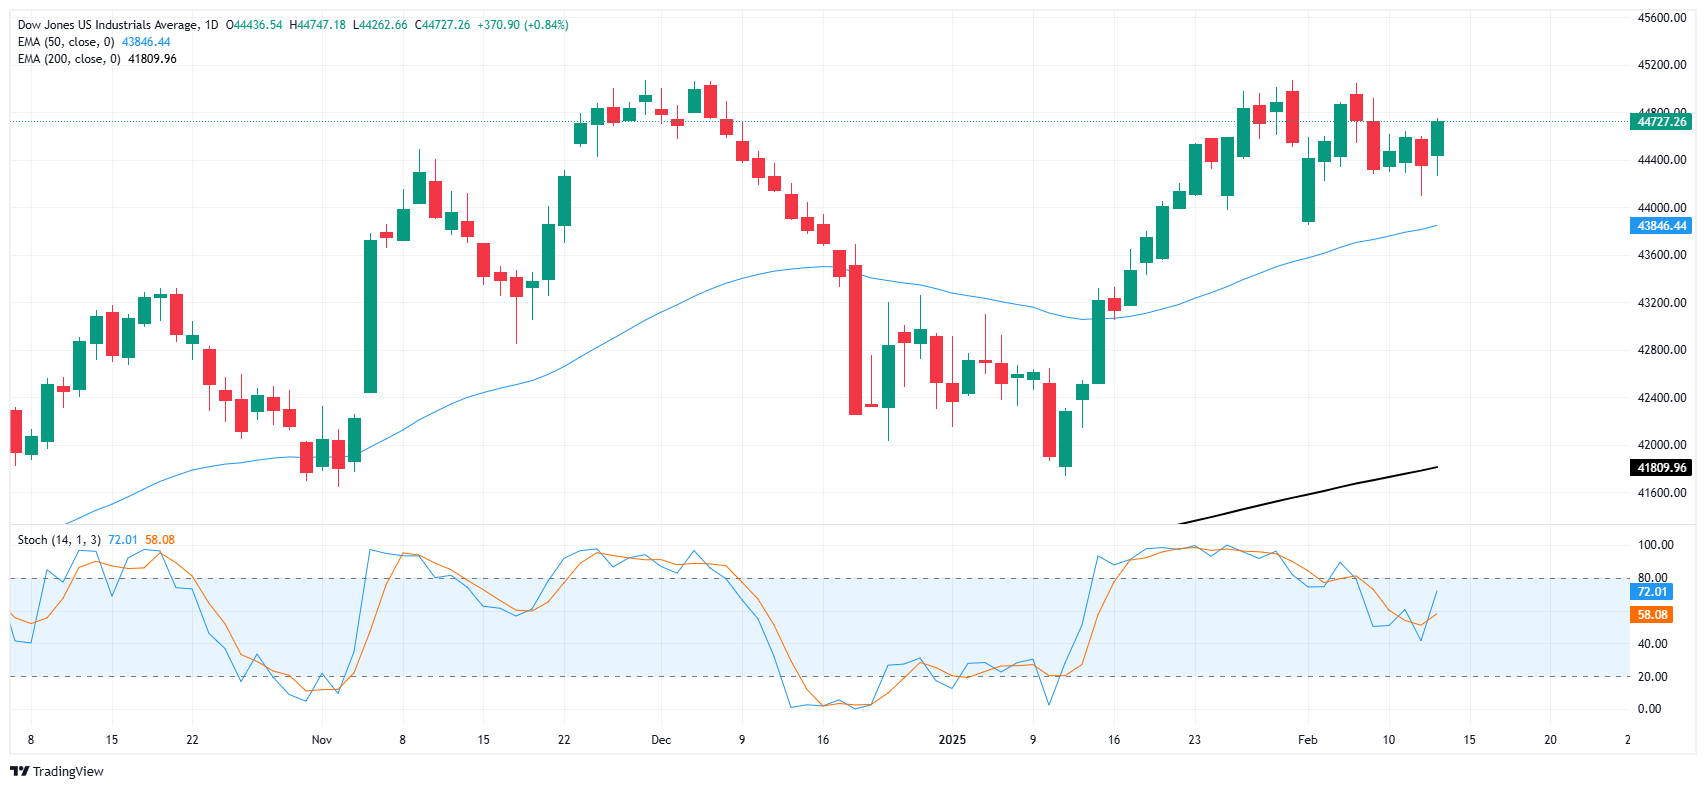
Dow Jones price forecast
Losses are beginning to accumulate on the Dow Jones Industrial Average chart, dragging the major equity index into correction territory with the Dow Jones down 2,000 points on the week. The DJIA has shed nearly 10% from last November’s record highs just north of 45,000, and price action is back below the 41,000 handle for the first time in 6 months.
Dow Jones 4-hour chart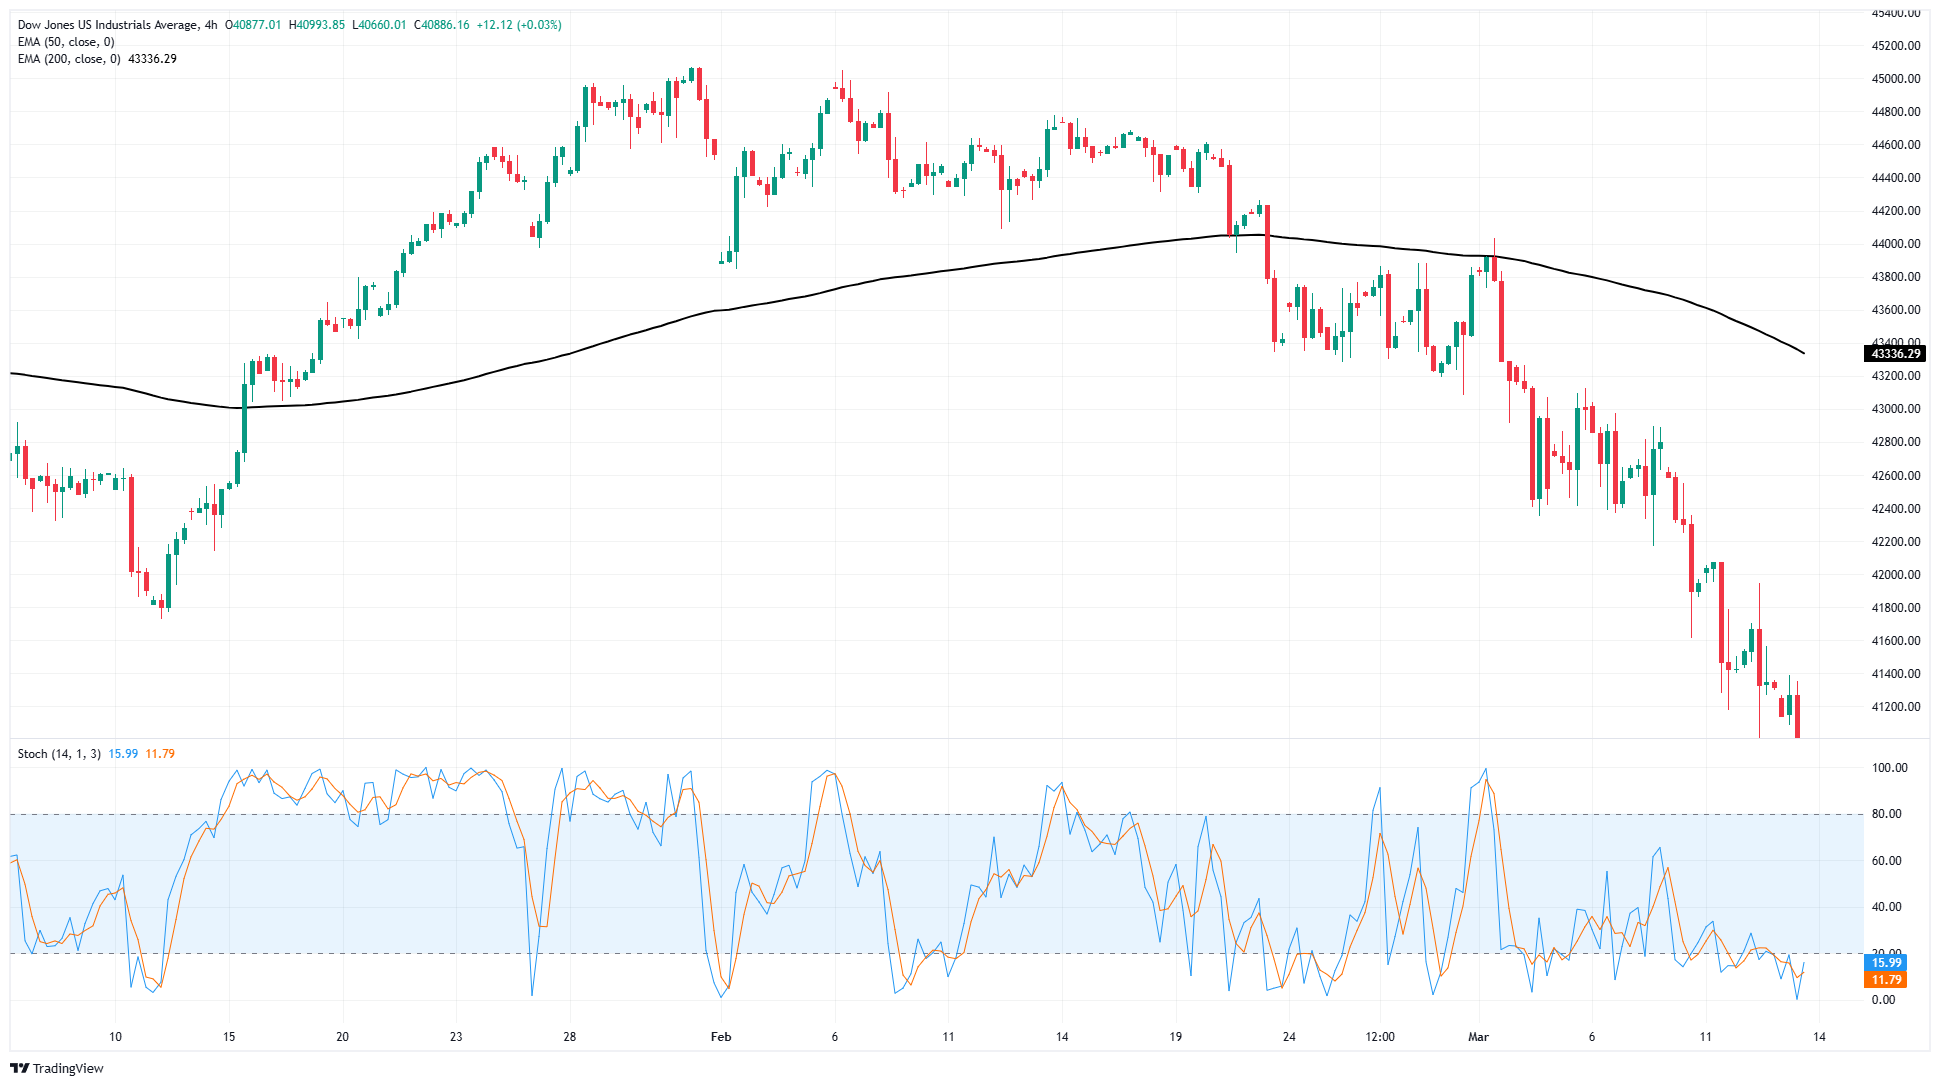
Tariffs FAQs
Tariffs are customs duties levied on certain merchandise imports or a category of products. Tariffs are designed to help local producers and manufacturers be more competitive in the market by providing a price advantage over similar goods that can be imported. Tariffs are widely used as tools of protectionism, along with trade barriers and import quotas.
Although tariffs and taxes both generate government revenue to fund public goods and services, they have several distinctions. Tariffs are prepaid at the port of entry, while taxes are paid at the time of purchase. Taxes are imposed on individual taxpayers and businesses, while tariffs are paid by importers.
There are two schools of thought among economists regarding the usage of tariffs. While some argue that tariffs are necessary to protect domestic industries and address trade imbalances, others see them as a harmful tool that could potentially drive prices higher over the long term and lead to a damaging trade war by encouraging tit-for-tat tariffs.
During the run-up to the presidential election in November 2024, Donald Trump made it clear that he intends to use tariffs to support the US economy and American producers. In 2024, Mexico, China and Canada accounted for 42% of total US imports. In this period, Mexico stood out as the top exporter with $466.6 billion, according to the US Census Bureau. Hence, Trump wants to focus on these three nations when imposing tariffs. He also plans to use the revenue generated through tariffs to lower personal income taxes.